The federal budget deficit increases significantly in relation to gross domestic product over the next 30 years, in CBO’s projections, pushing federal debt held by the public far beyond any previously recorded level.
Economy
 Report
In CBO’s projections, federal budget deficits total $20 trillion over the 2025–2034 period and federal debt held by the public reaches 116 percent of GDP. Economic growth slows to 1.5 percent in 2024 and then continues at a moderate pace.
 Blog Post
CBO will release "The Budget and Economic Outlook: 2024 to 2034" at 2 p.m. EST on February 7.
 Report
CBO provides details about the agency's most recent projections of the economy through 2025, which reflect economic developments as of December 5, 2023.
 Report
In CBO’s latest projections, economic growth slows and then picks up over the 2023–2025 period. That initial slowdown in economic growth drives up unemployment. Inflation continues to gradually decline.
 Report
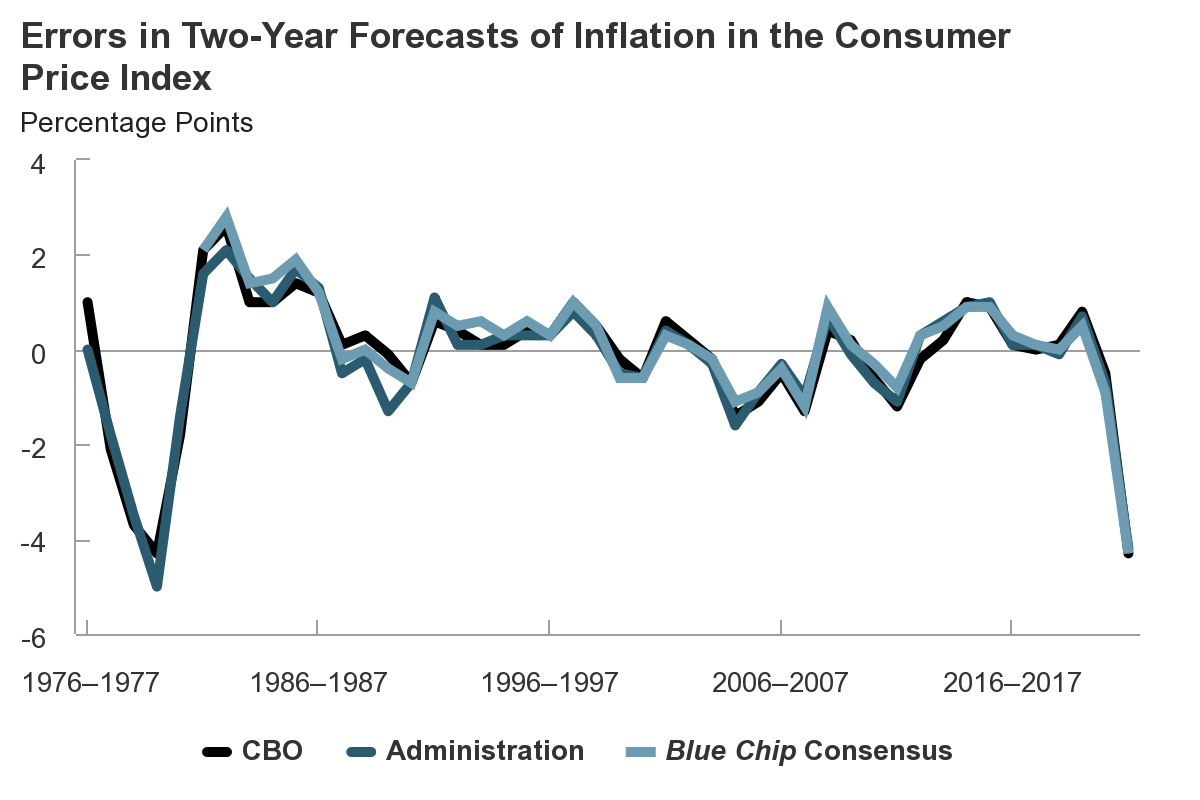
CBO assesses its two-year and five-year economic forecasts and compares them with forecasts of the Administration and the Blue Chip consensus, an average of about 50 private-sector forecasts.
 Report
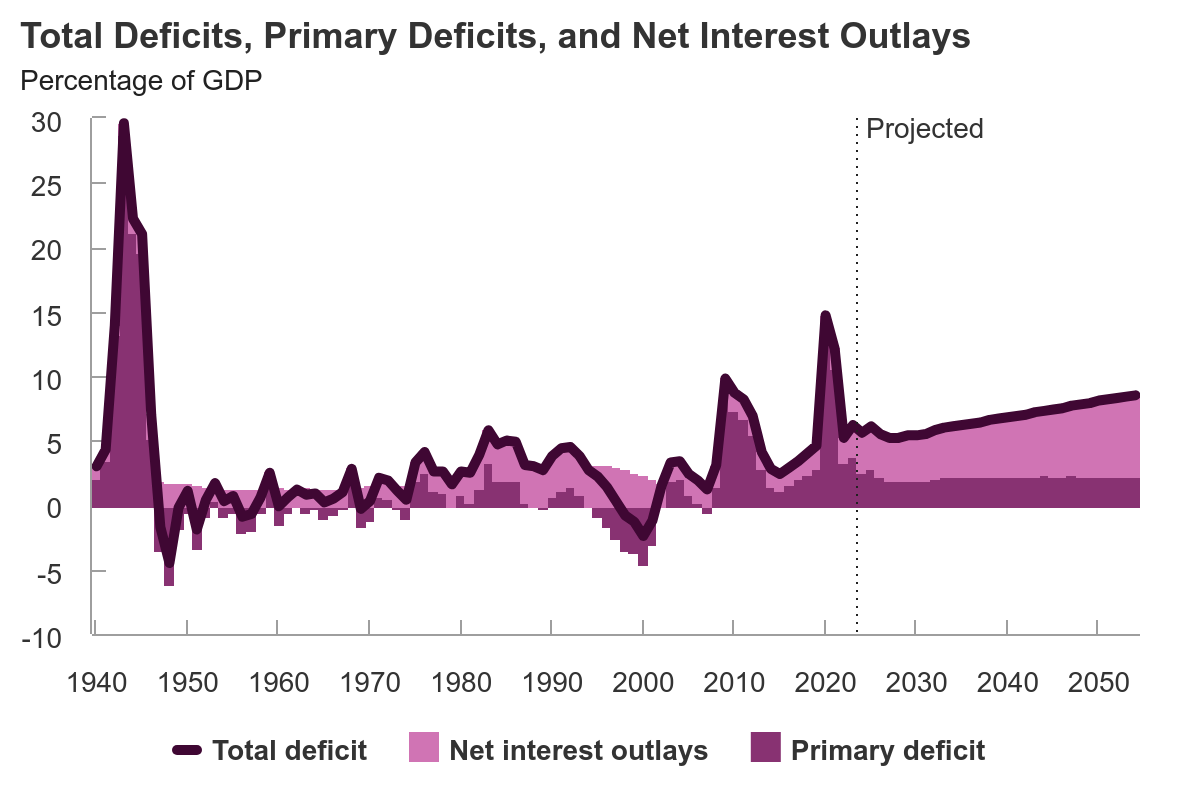
The U.S. faces a challenging fiscal outlook in the coming years, according to CBO's projections. Measured as a percentage of GDP, large and sustained deficits lead to high and rising federal debt that exceeds any previously recorded level.
 Report
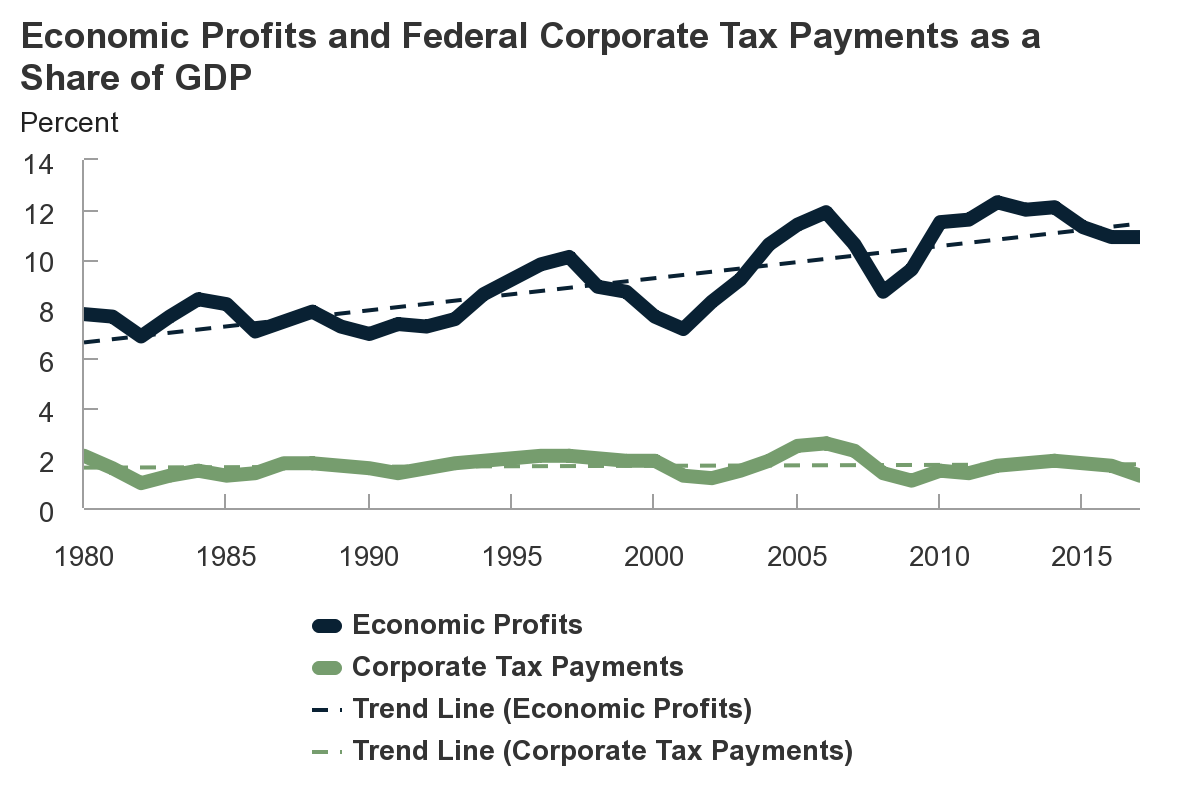
Over recent decades, corporate economic profits have grown faster than the amounts that corporations pay in federal taxes. CBO examined the factors that explain why corporate tax payments have not grown with corporate economic profits.
 Report
To show how variations in economic conditions might affect its budget projections, CBO analyzed how revenues, outlays, and deficits might change if the values of key economic variables differed from those in the agency’s forecast.
 Report
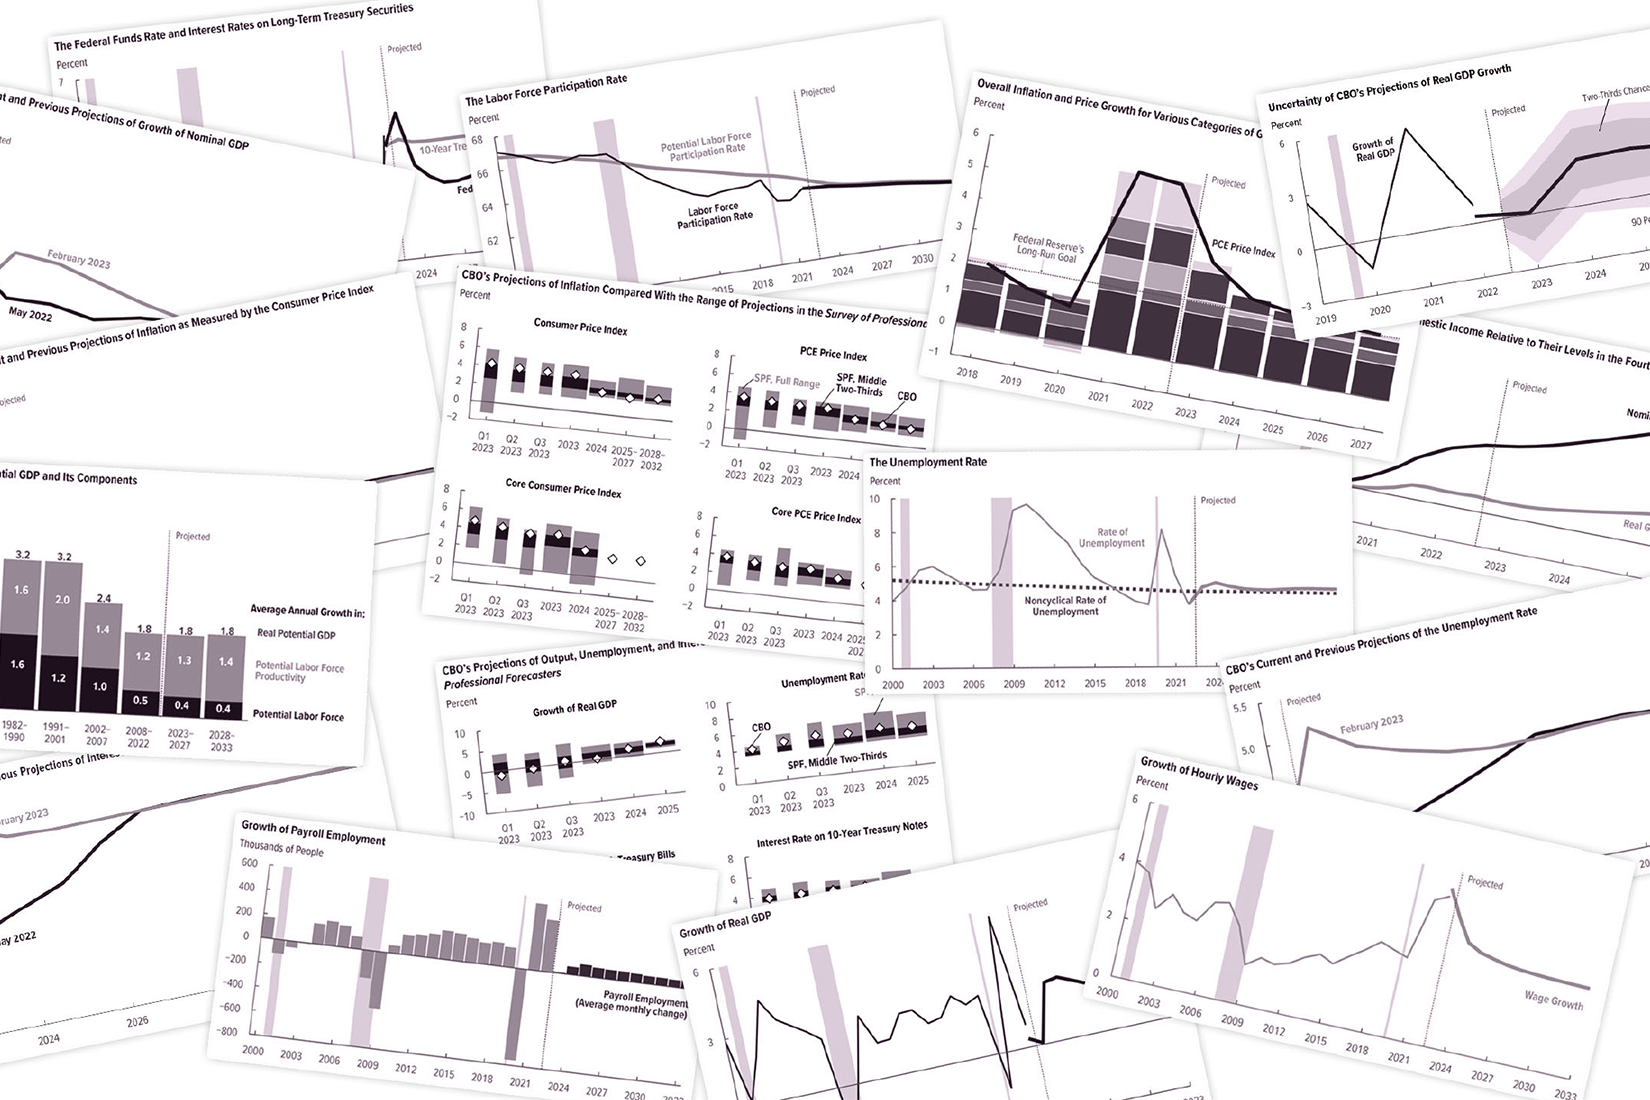
CBO summarizes in graphic form its projections of what the economy would look like this year and over the next decade if current laws governing federal taxes and spending generally remained in place.
 Report
In CBO’s projections, the federal deficit totals $1.4 trillion in 2023 and averages $2.0 trillion per year from 2024 to 2033. Real GDP growth comes to a halt in 2023 and then rebounds, averaging 2.4 percent from 2024 to 2027.
 Report
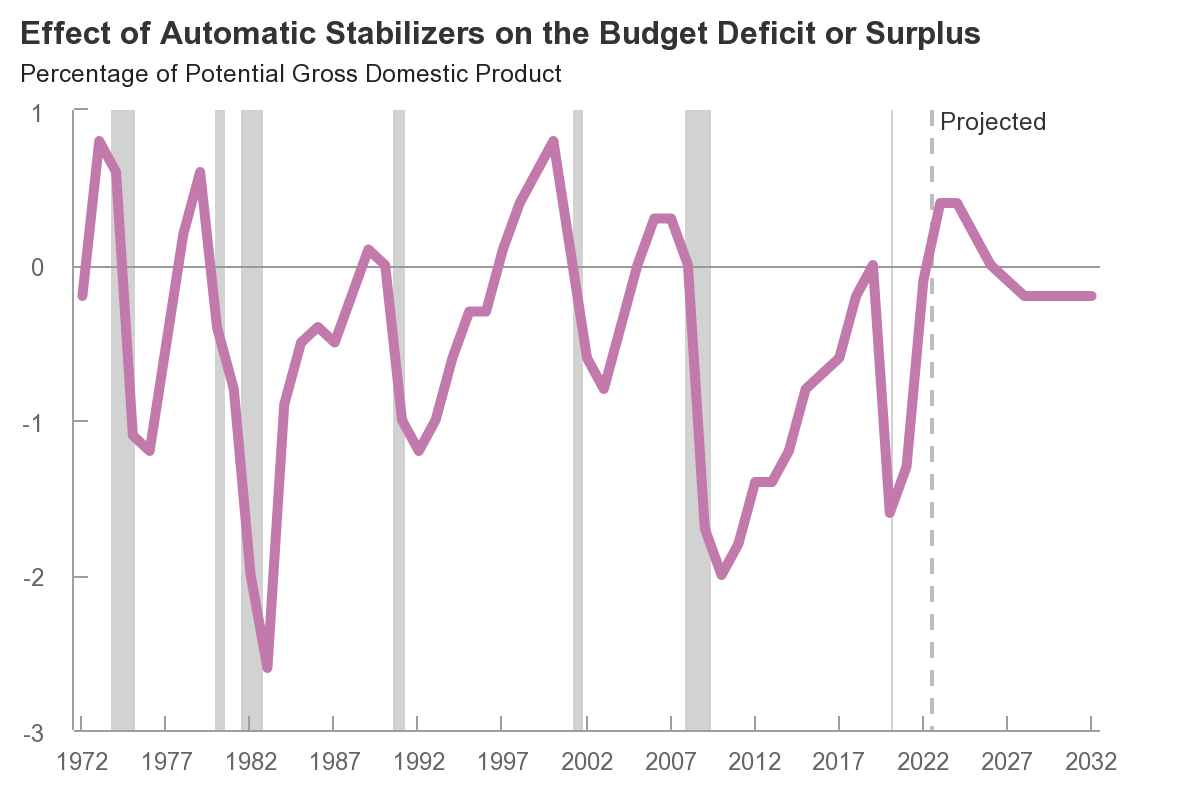
CBO projects the budgetary effects of automatic stabilizers—as well as the size of deficits without them—from 2022 to 2032 and provides historical estimates of the stabilizers’ effects since 1972.
 Report
CBO examines how inflation has affected households at different income levels and compares inflation since 2019 with the growth in household income over the same period.
-
Working Paper
This paper presents a practical method for assessing the uncertainty of long-term economic projections.
-
Working Paper
CBO developed a Markov-switching model to help incorporate asymmetric dynamics into macroeconomic projections and cost estimates that require simulations of the national unemployment rate.
 Report
By providing financial support to households, businesses, and state and local governments, federal laws enacted in response to the 2020 coronavirus pandemic will offset part of the deterioration in economic conditions brought about by the pandemic.