This workbook allows users to define and analyze alternative economic scenarios by specifying differences in the values of four economic variables relative to the values underlying CBO's February 2024 projections.
Interactives


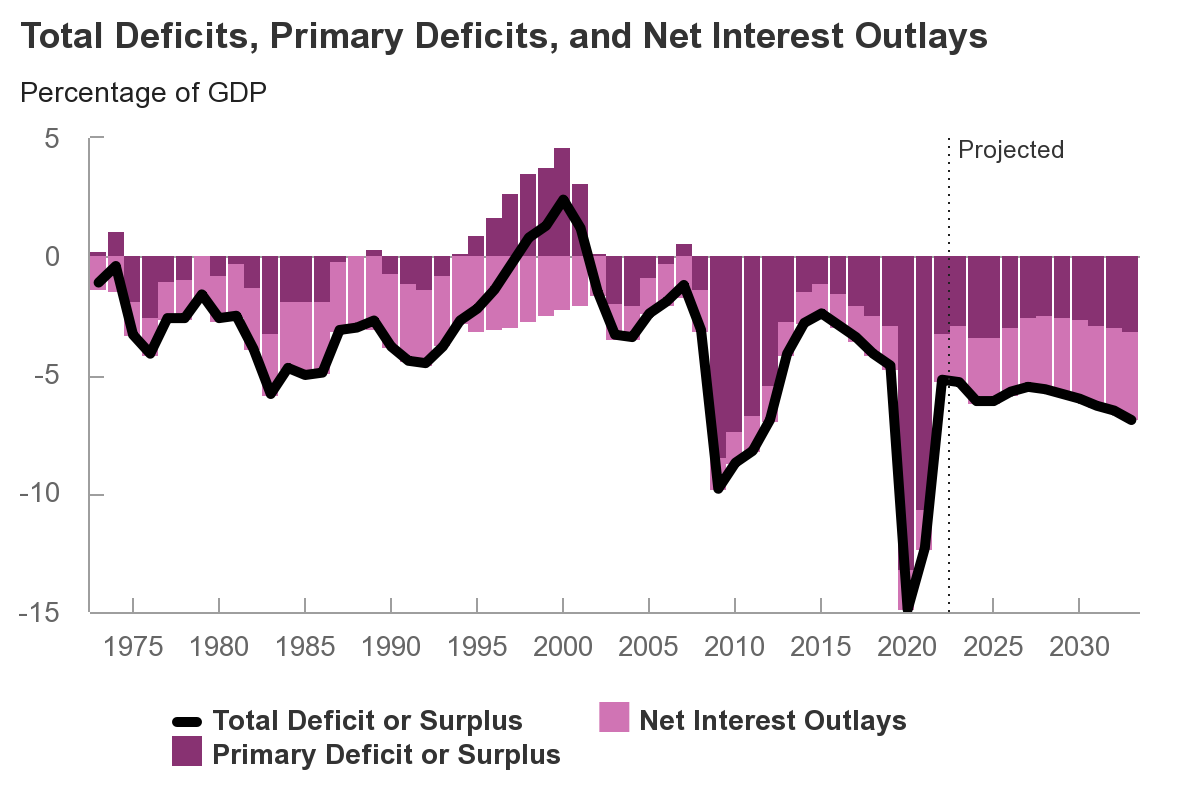
The federal deficit in 2023 was $1.7 trillion, equal to 6.3 percent of gross domestic product.

CBO's interactive tool allows users to simulate the agency's process for projecting discretionary budget authority and outlays for different types of spending over the course of 10 years.

This interactive workbook allows users to see how revenues and outlays that differed from those in CBO’s February 2024 baseline budget projections would increase or decrease net interest costs and thus affect deficits and debt.
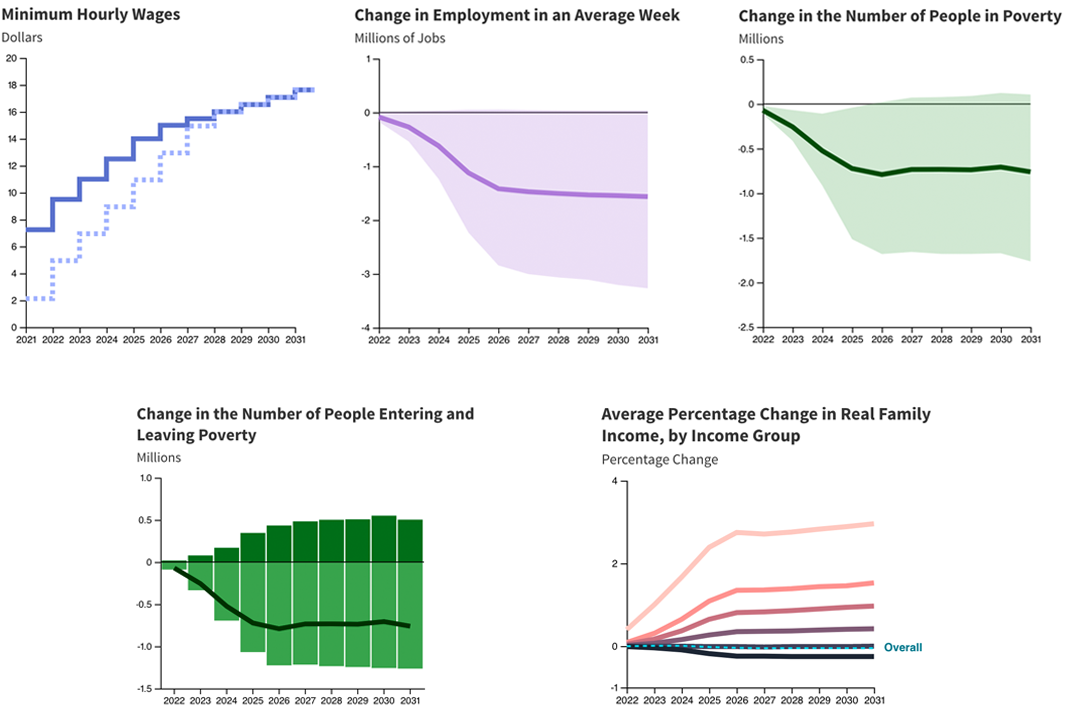
This interactive tool, updated in January 30, 2024, allows users to explore how various policies to increase the federal minimum wage would affect earnings, employment, family income, and poverty.

This tool allows the user to see the effects on the Department of Defense’s total operation and support costs and on the size of the military of adding or subtracting tanks, ships, aircraft, and other units.
This interactive workbook allows users to see how revenues and outlays that differed from those in CBO’s February 2023 baseline budget projections would increase or decrease net interest costs and thus affect deficits and debt.

In 2018, average household income after accounting for means-tested transfers and federal taxes was $37,700 among households in the lowest quintile and $243,900 among households in the highest quintile.

This interactive tool lets the user explore seven policy options that could be used to improve the finances of the Social Security program and delay the exhaustion of its trust funds.