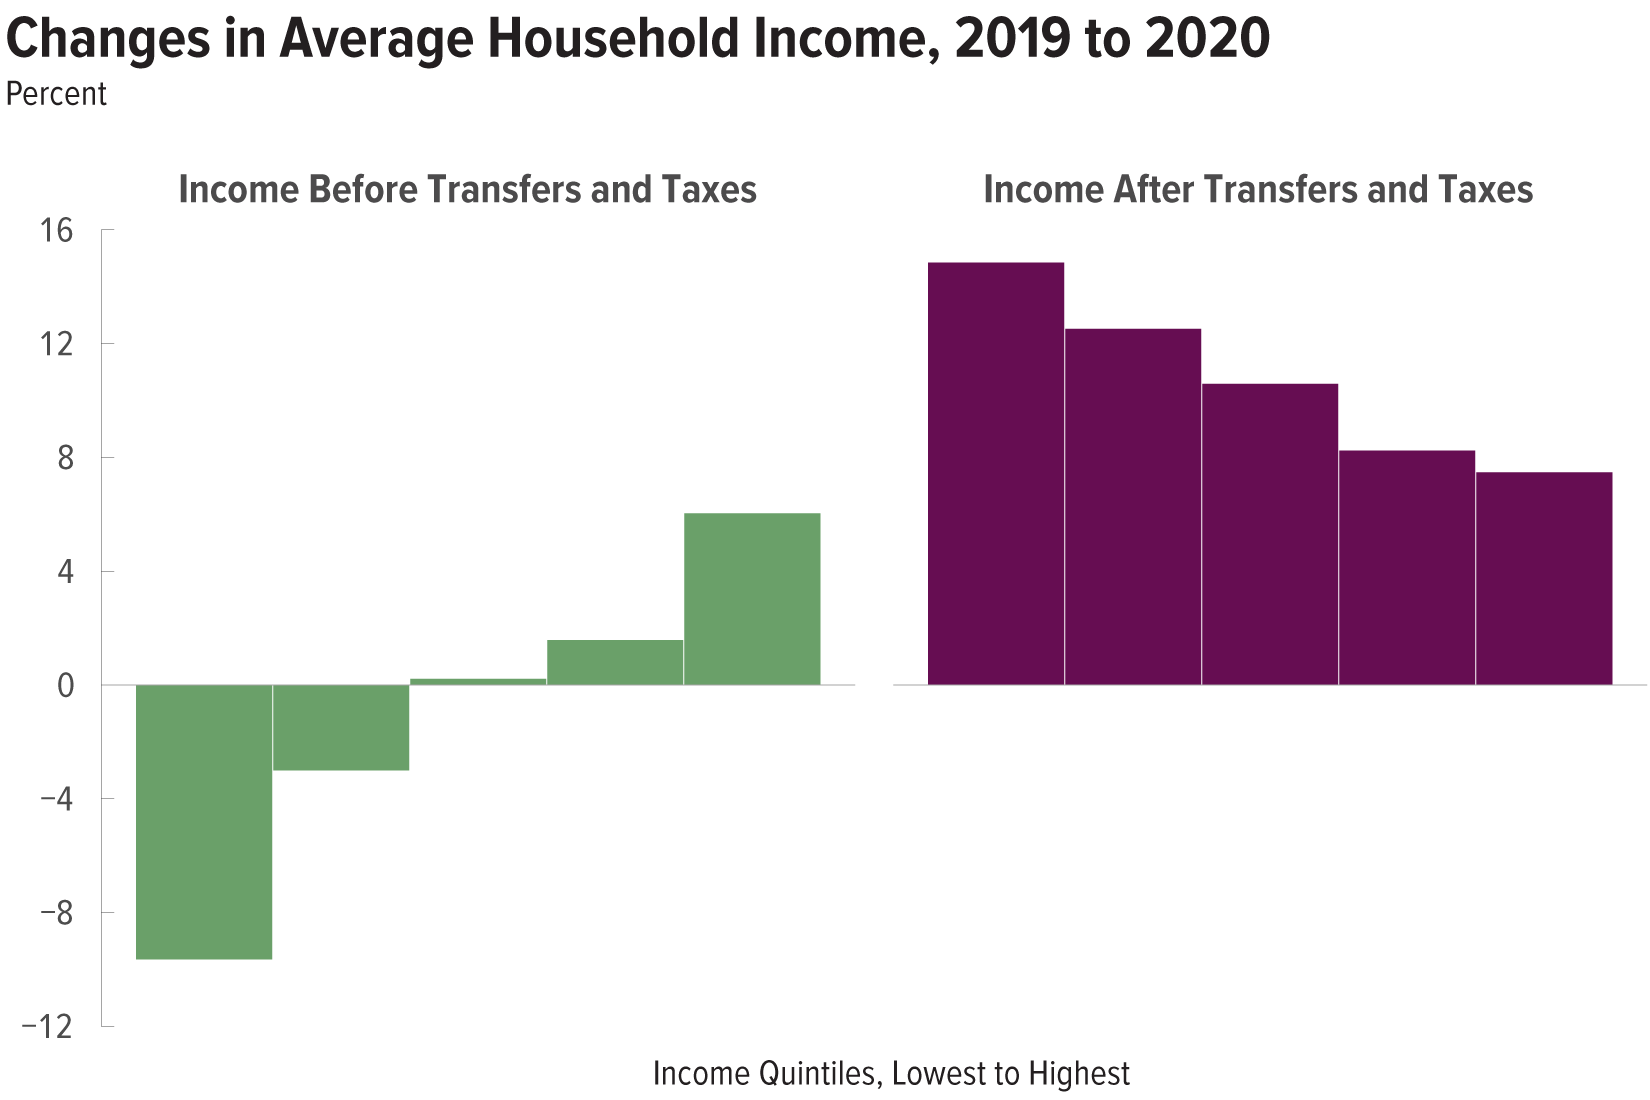
In 2020, the coronavirus pandemic and the ensuing federal response had significant effects on the distribution of household income. Income inequality before transfers and taxes increased, but inequality after transfers and taxes decreased.
Income Distribution
 Presentation
CBO regularly analyzes the distribution of income in the United States and how it has changed over time. This slide deck presents the distributions of household income, means-tested transfers, and federal taxes between 1979 and 2020.
 Report
CBO regularly analyzes the distribution of income in the United States and how it has changed over time. This report presents the distributions of household income, means-tested transfers, and federal taxes between 1979 and 2019.
 Report
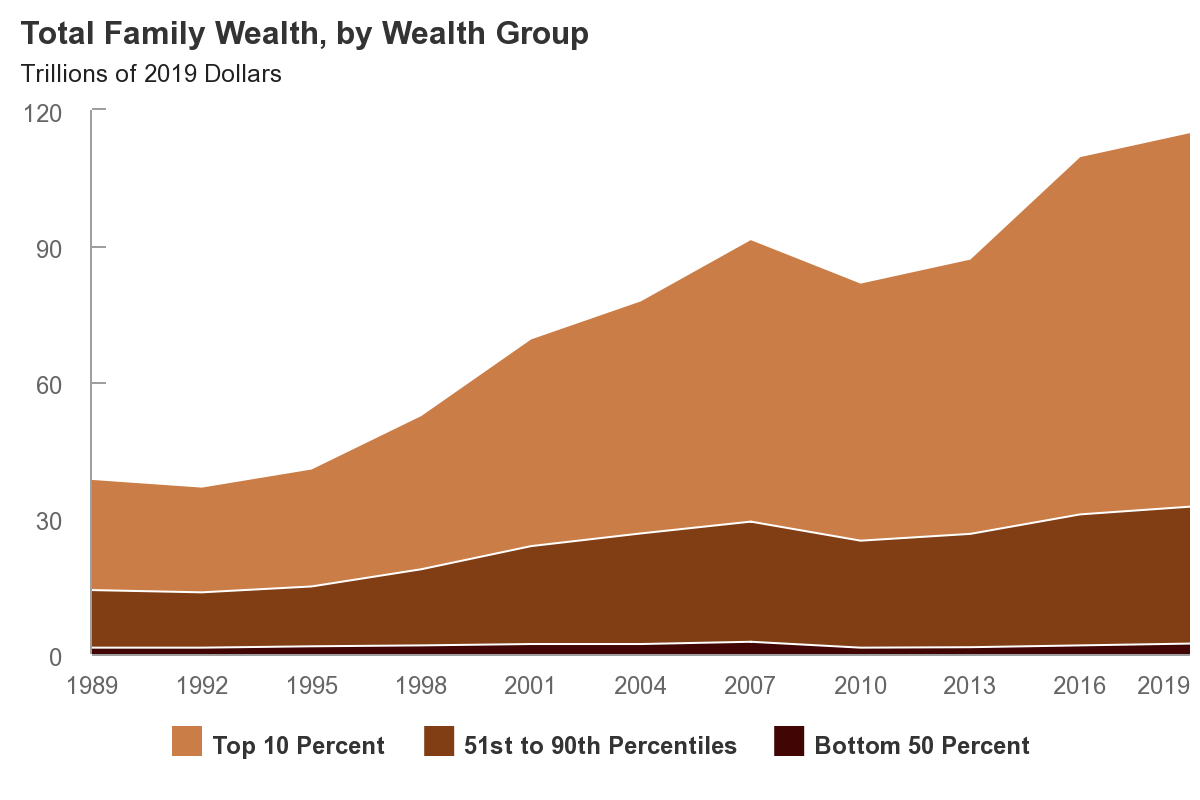
CBO examines changes in the distribution of family wealth from 1989 to 2019 and analyzes those changes in relation to several family characteristics. In addition, the agency examines how total family wealth has changed since 2019.
 Report
CBO examines how inflation has affected households at different income levels and compares inflation since 2019 with the growth in household income over the same period.
 Report
CBO examined how the benefits from major tax expenditures in the individual income tax and payroll tax systems were distributed among households in different income groups in 2019.
 Report
In 2018, average household income after accounting for means-tested transfers and federal taxes was $37,700 among households in the lowest quintile and $243,900 among households in the highest quintile.
 Report
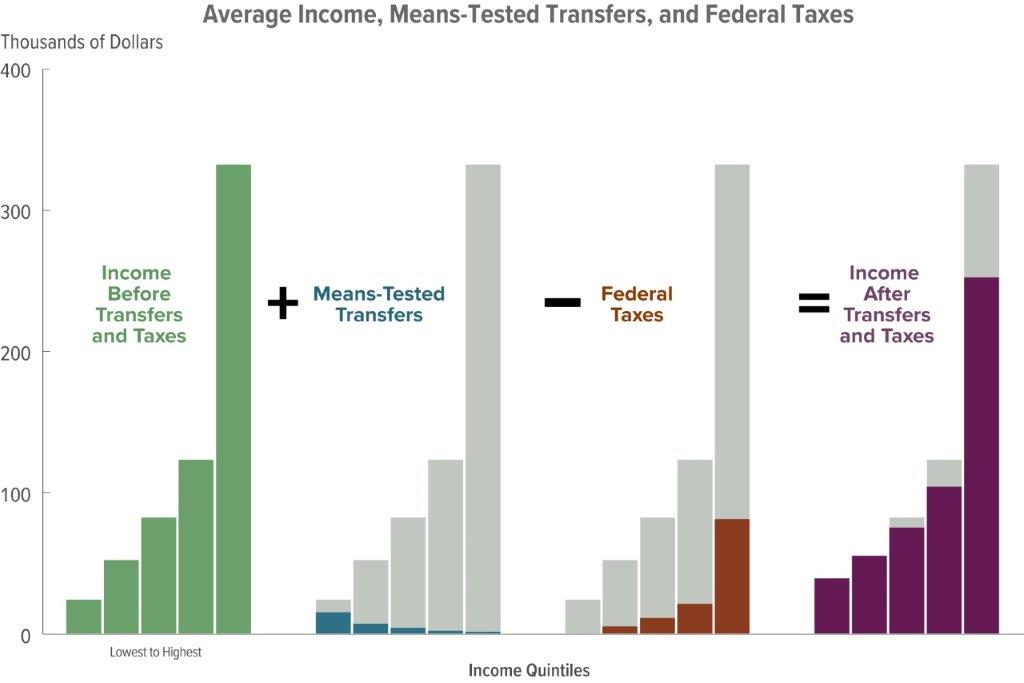
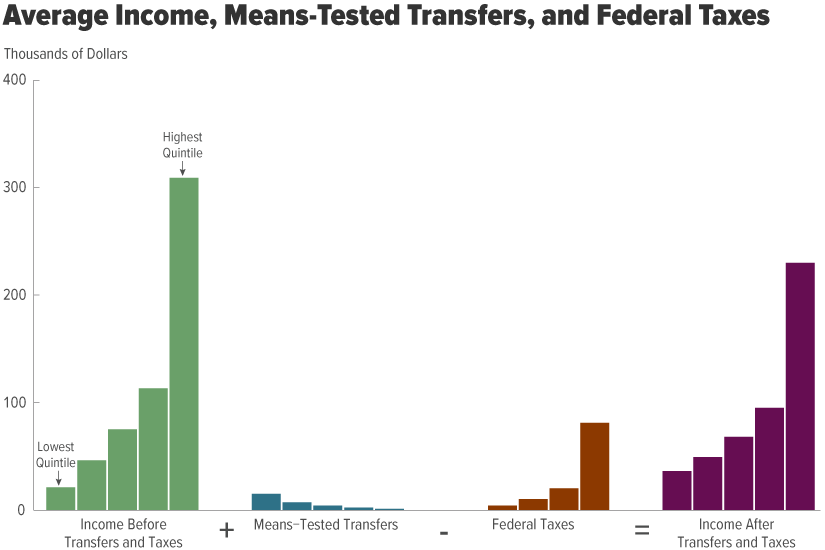
In 2017, average household income before accounting for means-tested transfers and federal taxes was $21,300 for the lowest quintile and $309,400 for the highest quintile. After transfers and taxes, those averages were $35,900 and $229,700.
 Report
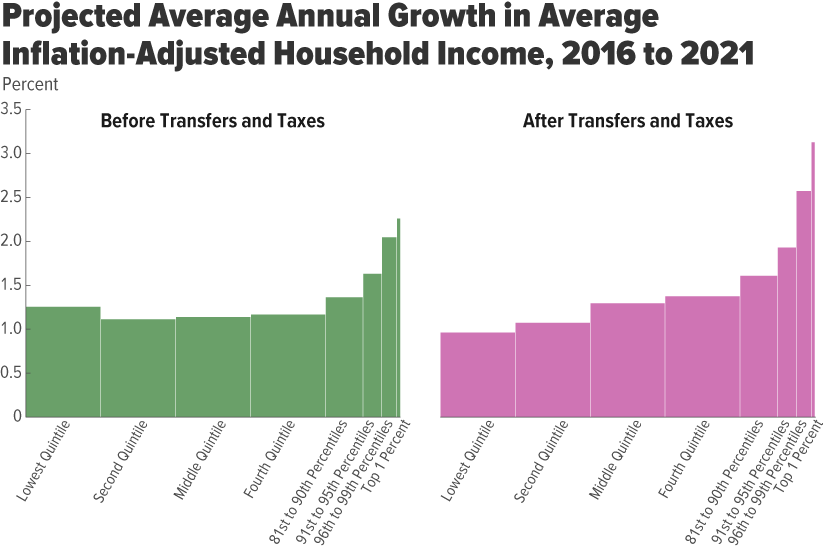
This report projects the distributions of household income, means-tested transfers, and federal taxes under current law in 2021 and compares them with the actual distributions in 2016.