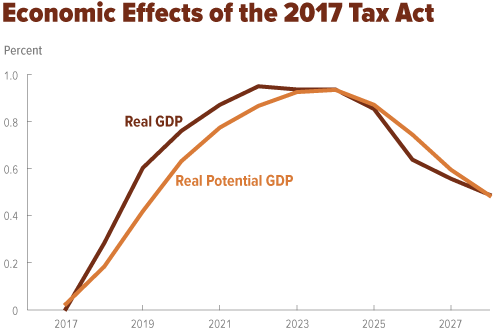
Last Monday, CBO released The Budget and Economic Outlook: 2018 to 2028. This week, CBO is publishing daily blog posts to share key excerpts from the report. Today’s post describes how the 2017 tax act affects the agency’s projections.
CBO Blog

Last Monday, CBO released The Budget and Economic Outlook: 2018 to 2028. This week, CBO is publishing daily blog posts to share key excerpts from the report, and today’s post is about the agency’s projections of federal deficits and debt.

Last Monday, CBO released The Budget and Economic Outlook: 2018 to 2028. This week, CBO is publishing daily blog posts to share key excerpts from the report, and today’s post is about the projections of federal revenues.

CBOLT is the main analytical tool that CBO uses to make long-term projections of the economy and federal budget. Those projections help shed light on fiscal challenges that extend beyond CBO’s standard 10-year projection window.

Last Monday, CBO released The Budget and Economic Outlook: 2018 to 2028. This week, CBO is publishing daily blog posts to share key excerpts from the report, and today’s post is about the agency’s projections of federal spending.
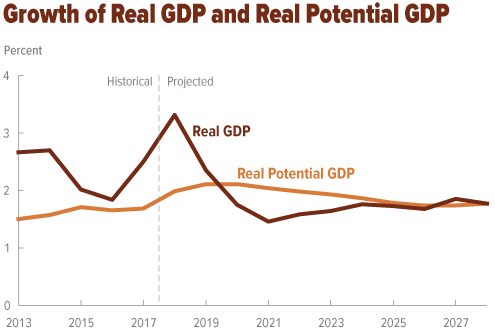
Last Monday, CBO released The Budget and Economic Outlook: 2018 to 2028. This week, CBO is publishing daily blog posts to share key excerpts from the report, and today’s post is about the agency’s economic projections.

This afternoon I briefed the press about The Budget and Economic Outlook: 2018 to 2028, which CBO published today. I delivered the following summary of our analysis, with an accompanying slide deck.

The federal budget deficit was $598 billion for the first half of fiscal year 2018, CBO estimates, $71 billion more than the shortfall recorded during the same period last year.

In 2014, average household income before accounting for means-tested transfers and federal taxes was $19,000 for the lowest quintile and $281,000 for the highest quintile. After transfers and taxes, those averages were $31,000 and $207,000.

CBO estimates that the costs of achieving a 355-ship Navy under two different approaches would average over $100 billion annually through 2047. Those scenarios are compared with two others that would cost less and involve a smaller fleet.