Yesterday’s release of an interactive tool for analyzing the military’s forces is one of many ways the agency is working to be transparent.
CBO Blog
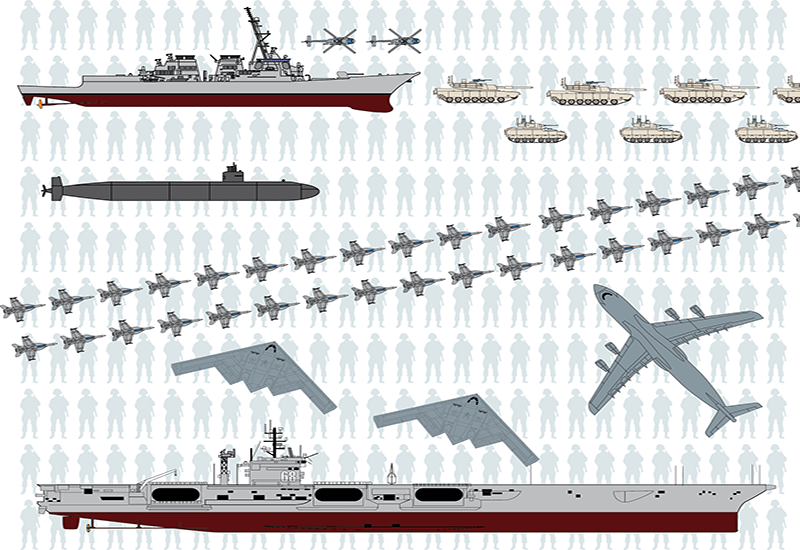
This spreadsheet provides the data that underlie CBO’s interactive force structure tool.

In a report required by law, CBO provides estimates of the caps on discretionary funding for each fiscal year through 2021. CBO concludes that the discretionary appropriations provided to date for 2018 do not exceed the caps for this year.
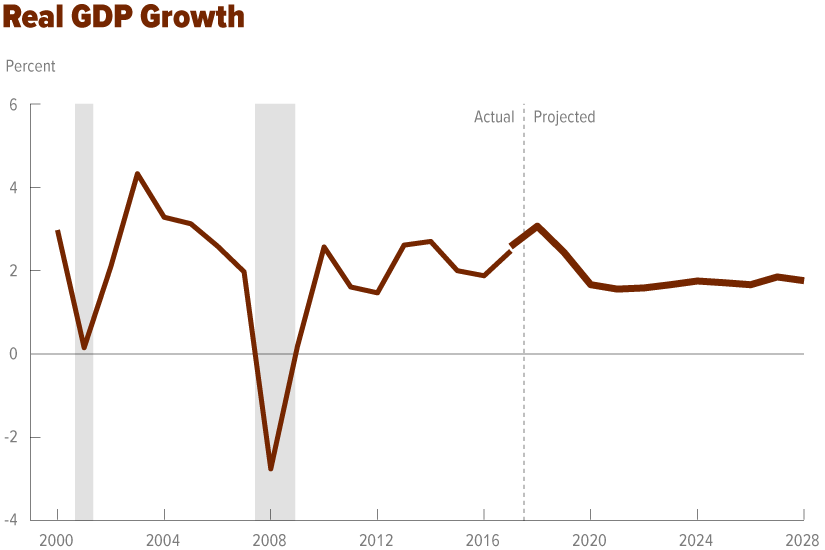
Today, CBO released An Update to the Economic Outlook: 2018 to 2028. The report presents the agency’s latest economic forecast, which includes projections of real (inflation-adjusted) gross domestic product (GDP) and other factors.

I recently returned from the 10th Annual Meeting of the Network of Parliamentary Budget Officials and Independent Fiscal Institutions, which is coordinated by the Organisation for Economic Co-operation and Development.
-
The report will include updates to CBO’s economic projections for the period from 2018 to 2028, but not updates to its baseline budget projections.

Expanding on its earlier long-term baseline projections, CBO shows how the federal budget and the economy would evolve under three scenarios in which laws would be changed to continue certain policies now in place, leading to higher debt.
-
CBO makes transparency a top priority, and the agency has worked hard to explain its methods and release more data.

The federal budget deficit was $682 billion for the first 10 months of fiscal year 2018, CBO estimates, $116 billion more than the shortfall recorded during the same period last year.

CBO presents information on enrollment in and spending for Medicaid managed care and analyzes factors affecting those measures—including the types of beneficiaries, geographic areas, and range of services that managed care programs cover.