
At a Glance
In this report, the Congressional Budget Office analyzes the costs from 2024 through 2028 of the Department of Defense’s (DoD’s) plans as presented in the 2024 Future Years Defense Program (FYDP) and projects how those plans would affect defense costs through 2038.
- The proposed budget for DoD in fiscal year 2024 totals $842 billion. Adjusted for inflation, that amount is about the same as the amount appropriated for 2023 (excluding the supplemental funding provided in 2023) but is 5 percent more than the amount anticipated for 2024 in the previous FYDP.
- According to the 2024 FYDP, DoD’s budget after 2024 would remain nearly unchanged (when adjusted for inflation) through 2028. The relative shares of funding for operation and support, acquisition, and infrastructure would also change little.
- Over the following 10 years, the cost of DoD’s plans would increase by 10 percent, reaching $922 billion (in 2024 dollars) in 2038, CBO projects. Nearly 70 percent of that increase would be for operation and maintenance or military personnel.
- The costs of DoD’s plans may be underestimated in the 2024 FYDP. They would be about 3 percent higher from 2024 to 2028 and about 4 percent higher from 2024 to 2038 if the department’s costs grew at rates consistent with CBO’s economic forecast (in areas such as compensation) or historical trends (in areas such as weapons acquisition). To accommodate higher costs, DoD would need to scale back its plans or request larger budgets than are anticipated in the 2024 FYDP.
Notes
All years referred to in this report are federal fiscal years, which run from October 1 to September 30 and are designated by the calendar year in which they end.
Dollar amounts are expressed in 2024 dollars. To remove the effects of inflation, the Congressional Budget Office adjusted dollar amounts using its projections of the gross domestic product price index. Those projections are available in The Budget and Economic Outlook: 2023 to 2033 (May 2023), www.cbo.gov/publication/59096. Dollar amounts attributed to the Department of Defense (DoD) for 2024 through 2028 are based on DoD’s estimates in nominal dollars adjusted to 2024 dollars using CBO’s inflation indexes.
In this report, “cost” refers to total obligational authority (TOA), a financial measure used by DoD to identify the funding available for its programs. TOA differs from budget authority, most notably in its adjustment for the timing of rescissions and lapses of prior-year budget authority. In recent years, the difference between TOA and discretionary budget authority in DoD’s budget request for the coming year has generally been $1 billion or less.
Numbers may not add up to totals because of rounding.
Previous editions of this report, which CBO publishes annually, are available at https://go.usa.gov/xEnE6.
The photographs on the cover show the following (clockwise from top left): A Marine Corps MV-22 Osprey lands on the USNS Patuxent in the Atlantic Ocean (Marine Corps Lance Cpl. Rafael Brambila-Pelayo); an Air Force B-52H Stratofortress taxis after landing at the Kualanamu International Airport in Medan, Indonesia (Air Force Tech. Sgt. Zade Vadnais); a Falcon 9 rocket carrying a GPS III satellite launches at Cape Canaveral Space Force Station, Florida (Air Force Senior Airman Thomas Sjoberg); the guided-missile destroyer USS Oscar Austin cruises near Tromsø, Norway (Navy photo); and Washington National Guard soldiers fire a 155-mm howitzer during annual training at Yakima Training Center, Washington (Army Staff Sgt. Adeline Witherspoon).
CBO has corrected this report since its original publication. The correction is described at the end of the report.
Summary
In most years, the Department of Defense (DoD) produces a five-year plan, called the Future Years Defense Program (FYDP), that is associated with the budget it submits to the Congress. The 2024 FYDP, issued in May 2023, comprises DoD’s request for appropriations in 2024 and a series of planned budgets for 2025 through 2028. In this report, the Congressional Budget Office analyzes the 2024 FYDP and summarizes DoD’s expectations about the costs of its plans for 2024 through 2028. Because decisions made in the near term can have consequences for the defense budget in the longer term, CBO projected the costs of DoD’s 2024 plan through 2038, 10 years beyond the period covered by the current five-year plan.
What Are DoD’s Budget Plans According to the 2024 FYDP?
The proposed budget for DoD in 2024 totals $842 billion. That amount is about the same as the amount that was appropriated in 2023 in real terms (that is, after removing the effects of inflation) if the supplemental appropriations provided in 2023 for Ukraine and natural disasters are excluded. When adjusted for inflation, the amounts that DoD indicated it would request for each of the remaining four years of the FYDP period are within $1 billion of the 2024 request. Those totals include a small placeholder amount of less than 1 percent of the total budget each year for possible war costs.
The federal budget is presented in broad categories, called budget functions, that describe the general purpose of each activity. Budget function 050, which is labeled “national defense,” includes DoD’s military activities, the nuclear weapon–related activities of the Department of Energy (DOE), and the national security activities of several other agencies. The cap set for security funding (that is, budget function 050) in the Fiscal Responsibility Act of 2023 (Public Law 118-5)—$886 billion in 2024—is consistent with the amount the Administration requested for that budget function: $842 for DoD, $33 billion for DOE, and $12 billion for defense activities of other agencies. The cost of budget function 050 activities for 2025 under the current FYDP would be about 1 percent higher than the cap on security funding for that year.
The Fiscal Responsibility Act of 2023 also includes provisions that could limit discretionary spending for 2026 through 2029 but would not prescribe a distribution between security and nonsecurity spending for those years. Moreover, the caps under the Fiscal Responsibility Act can be exceeded with emergency supplemental appropriations.
Within DoD’s total budget, the relative amounts allocated for day-to-day operations, the acquisition of new weapons (including their development and procurement), and the upkeep of infrastructure would remain nearly unchanged over the FYDP period; as a fraction of the total budget, costs for day-to-day operations would increase slightly and costs for acquisition would decrease slightly. The decrease in acquisition costs—about 3 percent over the five-year period—would result from much larger changes within the acquisition category: Procurement costs would increase by 4 percent and development costs would decrease by 10 percent as DoD shifted from developing weapons to purchasing them.
What Would DoD’s Plans Cost Beyond the FYDP Period?
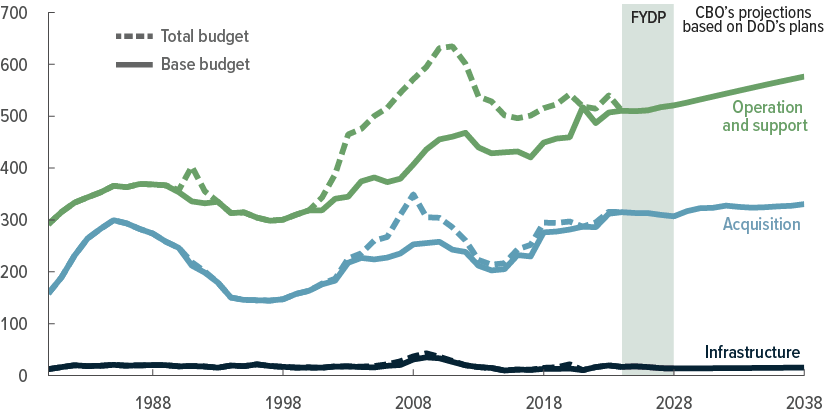
CBO’s projections indicate that in the decade after 2028, DoD’s costs would increase faster than inflation, rising by 10 percent in real terms—from $842 billion to $922 billion (in 2024 dollars; see Figure S-1).
Figure S-1.
Historical Funding for DoD’s Activities and Projected Costs Through 2038
Billions of 2024 dollars

DoD’s 2024 FYDP indicates no growth in costs (after removing the effects of inflation) through 2028. CBO projects that in later years, increases in costs would be more consistent with the rate of increase over the past 20 years.
Data source: Congressional Budget Office. See www.cbo.gov/publication/59511#data.
DoD’s total budget consists of the following: base-budget funding that is appropriated for normal, peacetime operations and other activities that are anticipated during the regular budgeting process; and supplemental funding that is appropriated for overseas contingency operations and emergencies such as natural disasters.
DoD = Department of Defense; FYDP = Future Years Defense Program.
Two key factors explain that increase:
- Costs to compensate military personnel and for operation and maintenance (O&M) are projected to grow faster than inflation, and
- Costs to acquire weapon systems are projected to increase quickly in the first two years after the FYDP period and then more slowly (on average) thereafter.
Of the $81 billion increase in annual costs that CBO projects between 2028 and 2038, 26 percent would be for military personnel, 43 percent for O&M, 29 percent for developing and purchasing weapon systems, and 2 percent for infrastructure.
How Would Costs Change if Growth Followed Historical Patterns?
In many areas of DoD’s budget, costs have historically grown more rapidly than DoD has projected in the FYDP. For example, lawmakers have often enacted increases in compensation for military and civilian personnel that were larger than the increases DoD incorporated in its plans. Similarly, DoD has frequently underestimated costs for O&M and the acquisition of weapon systems. For example, the 2024 FYDP incorporates increases in military and civilian compensation for 2025 through 2028 that are substantially smaller than increases in compensation in CBO’s economic forecast.
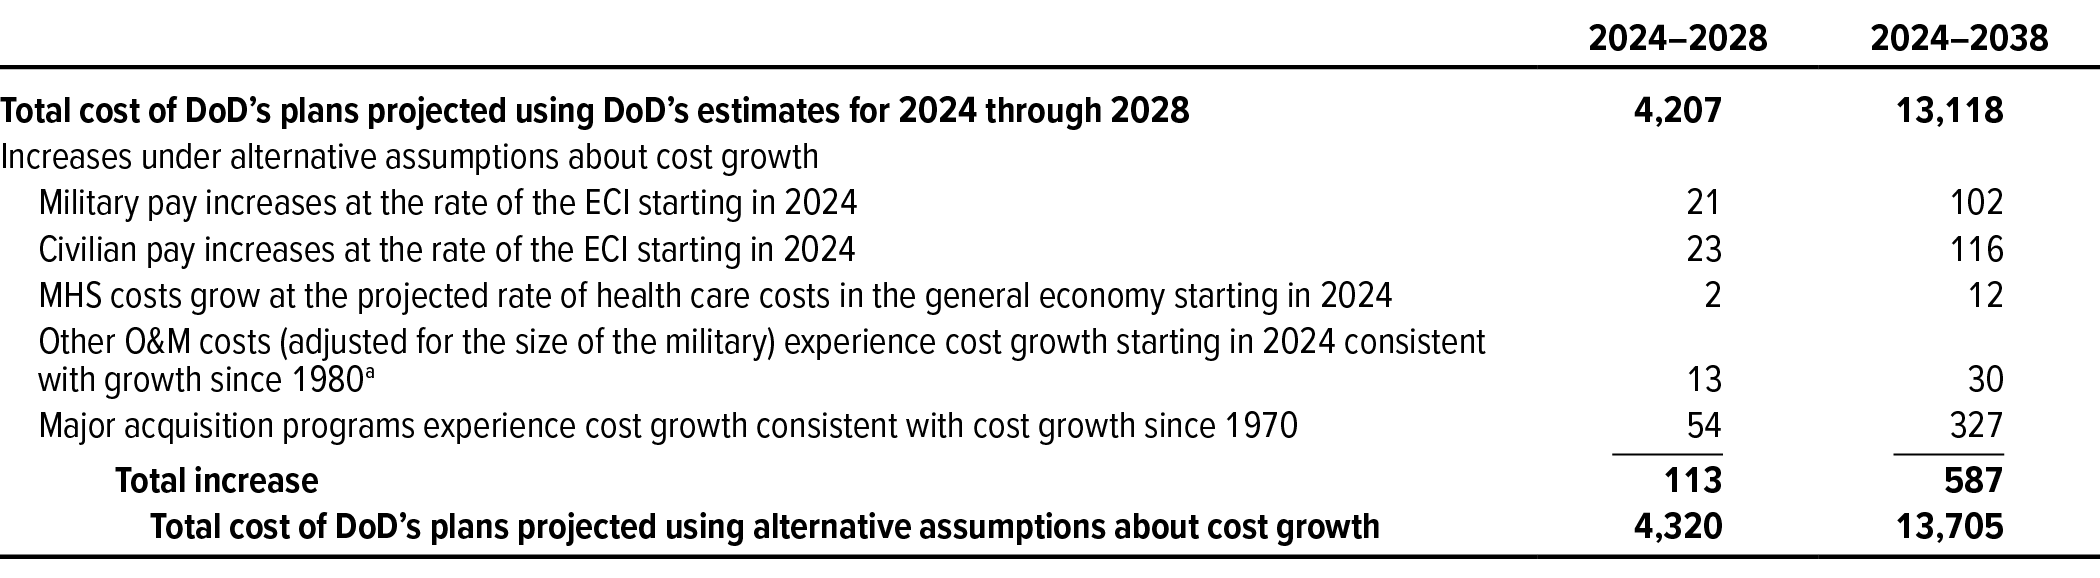
To examine how such factors might affect DoD’s budgets, CBO prepared alternative projections of the costs of implementing DoD’s 2024 plans under the assumption that growth in DoD’s costs would be consistent with trends over the past several decades. According to those estimates, total costs from 2024 through 2028 would be $113 billion (or about 3 percent) higher than DoD indicated in the 2024 FYDP, and total costs from 2024 through 2038 would be $587 billion (or about 4 percent) higher than DoD indicated in the 2024 FYDP and CBO projected for subsequent years using DoD’s estimates (see Table S-1). Accommodating those higher costs would require DoD to scale back its plans or request larger budgets than it anticipated in the 2024 FYDP.
Table S-1.
Projections of DoD’s Costs Under Alternative Assumptions About Cost Growth
Billions of 2024 dollars
Data source: Congressional Budget Office. See www.cbo.gov/publication/59511#data.
DoD = Department of Defense; ECI = employment cost index for wages and salaries of workers in the private sector, as defined by the Bureau of Labor Statistics; MHS = Military Health System; O&M = operation and maintenance.
a. “Other O&M” is the sum of the O&M and revolving and management fund appropriation titles minus costs for civilian compensation and the MHS.
What Uncertainties Could Affect the Costs of DoD’s Plans?
DoD’s and CBO’s projections of the costs of executing DoD’s plans reflect those plans as they stood when the department was preparing its 2024 budget. Those plans could change as a result of international events, Congressional decisions, or other factors. Furthermore, even if DoD’s plans generally remained unchanged, many program-level policies that underlie DoD’s projections of its costs might not come to pass. For example, technical difficulties in a weapon-development program could cause DoD to cancel the program and instead extend the service life of existing weapons. Even if DoD’s plans came to pass as currently projected, uncertainties would remain in the projections of economic factors such as inflation, labor costs, or the costs of raw materials for weapon systems.
For those reasons, CBO’s projections should not be viewed as predictions of future funding for DoD; rather, the projections are estimates of the costs of executing the department’s 2024 plans under the premise that those plans would not change.
Chapter 1Costs of the 2024 Future Years Defense Program
The Congressional Budget Office analyzed the costs of the Department of Defense’s plans over the five-year period covered by the latest Future Years Defense Program—2024 through 2028—and projected the costs of those plans over an additional 10 years, through 2038. Nearly all of DoD’s funding is provided in appropriations under seven public law titles: military personnel; operation and maintenance; procurement; research, development, test, and evaluation (RDT&E); military construction; family housing; and revolving and management funds. For its analysis, CBO divided that funding into three broad categories, according to the types of activities that are funded:
- Military personnel, O&M, and revolving and management funds make up the operation and support (O&S) category;
- Procurement and RDT&E make up the acquisition category; and
- Military construction and family housing make up the infrastructure category.
DoD’s Estimates of Costs in the 2024 FYDP
The proposed budget for DoD in 2024 is $842 billion. That amount is $3.5 billion (or 0.4 percent) more, in real terms, than the amount that the Congress appropriated for 2023 if supplemental appropriations provided in 2023 for Ukraine and natural disasters are excluded.1 Measured in 2024 dollars, funding for O&S would increase by $3.3 billion (or 0.7 percent) in 2024, funding for acquisition would increase by $3.0 billion (or 1.0 percent), and funding for infrastructure would decline by $2.9 billion (or 15 percent). Although the amount requested for infrastructure in 2024 was smaller than the amount lawmakers enacted for 2023, it was $4.5 billion (or 37 percent) more than the amount DoD requested for that year.
According to the 2024 FYDP, DoD’s costs would remain nearly unchanged in real terms through 2028. Annual costs for O&S, which account for roughly two-thirds of DoD’s budget, would increase from $510 billion in 2024 to $521 billion in 2028. Costs for acquisition, which account for about one-third of the budget, would decrease from $315 billion to $307 billion. Infrastructure costs, which account for about 2 percent of DoD’s total costs over the FYDP period, would vary between $14 billion and $18 billion annually.
In May 2023, lawmakers enacted the Fiscal Responsibility Act of 2023, which established caps on discretionary funding for 2024 and 2025 in two broad categories—security and nonsecurity. The cap set for security funding (that is, budget function 050) in 2024—$886 billion—is consistent with the amount the Administration requested: $842 billion for DoD, $33 billion for nuclear weapon–related activities of the Department of Energy, and $12 billion for defense activities of other agencies. The cost of budget function 050 activities for 2025 anticipated in the current FYDP would be about 1 percent higher than the cap on security funding for that year.
The Fiscal Responsibility Act of 2023 also includes provisions that could limit total discretionary spending for 2026 through 2029, but it does not specify separate limits on security and nonsecurity funding in those years. In all years, moreover, the limits under the Fiscal Responsibility Act do not constrain emergency supplemental appropriations.
CBO’s Projections of DoD’s Costs for 2029 Through 2038
On the basis of DoD’s estimates in the FYDP (converted by CBO into 2024 dollars), CBO projects that the costs of the department’s plans over the 10 years following 2028 would increase at an average annual rate of 0.9 percent (in real terms), rising from DoD’s estimate of $842 billion at the end of the FYDP period to $922 billion in 2038 (see Figure S-1). The average annual increase from 2024 through 2038 would be 0.7 percent.
Costs for O&S, acquisition, and infrastructure would all contribute to the increase in the costs of DoD’s plans after 2028 (see Figure 1-1):
Figure 1-1.
Costs for Operation and Support, Acquisition, and Infrastructure in the 2024 FYDP and in CBO’s Projections
Billions of 2024 dollars
In CBO’s projections, costs for operation and support increase the most after 2028. Costs for acquisition increase sharply from 2028 to 2032 and more slowly thereafter.
Data source: Congressional Budget Office. See www.cbo.gov/publication/59511#data.
DoD’s total budget consists of the following: base-budget funding that is appropriated for normal, peacetime operations and other activities that are anticipated during the regular budgeting process; and supplemental funding that is appropriated for overseas contingency operations and emergencies such as natural disasters.
Funding for operation and support is the sum of the appropriations for military personnel, operation and maintenance, and revolving and management funds. Acquisition funding is the sum of the appropriations for procurement and for research, development, test, and evaluation. Infrastructure funding is the sum of the appropriations for military construction and family housing.
DoD = Department of Defense; FYDP = Future Years Defense Program.
- Costs for O&S would rise steadily, from DoD’s estimate of $521 billion in 2028 to $576 billion in 2038—an average annual increase of 1.0 percent.
- Costs for acquisition would increase by about 5 percent in the first two years after the FYDP period—from DoD’s estimate of $307 billion in 2028 to $323 billion in 2030—and would increase more slowly thereafter, ending the projection period at $330 billion.
- Costs for infrastructure would rise steadily after the FYDP period, from DoD’s estimate of $13.6 billion in 2028 to $15.4 billion in 2038.
CBO’s Estimates of DoD’s Costs Under Alternative Assumptions About Cost Growth
If DoD’s future costs were consistent with historical trends and current economic indicators, they would be larger than the estimates provided by DoD through 2028 and CBO’s projections (which are based on DoD’s plans) through 2038. Two of the many factors that could make DoD’s costs diverge from those estimates are pay raises and the costs of weapon systems. Historically, pay raises have often turned out to be larger than DoD planned in its FYDPs—and the pay raises for 2025 through 2028 reflected in the 2024 FYDP are smaller than those in CBO’s current economic projections, which suggests that they may be underestimates. DoD has also tended to underestimate the costs of weapon systems in its FYDPs.
To illustrate the effect that alternative assumptions about costs could have on estimates of overall defense costs, CBO estimated how DoD’s overall costs would change if the projected growth rate of O&S costs from 2029 through 2038 also applied over the FYDP period and if costs to acquire weapon systems grew as they have in the past. In those alternative projections, the costs of DoD’s plans are $113 billion (or about 3 percent) higher over the FYDP period. Over the full 2024–2038 period, they are $587 billion (or about 4 percent) higher (see Table S-1). Acquisition costs account for roughly half of that difference. Accommodating those higher costs would require DoD to scale back its plans or request larger budgets than it anticipated in the 2024 FYDP.
How CBO Projected the Costs of DoD’s Plans Beyond the FYDP Period
CBO’s analysis of the costs of DoD’s plans for 2029 through 2038 is based on the estimates DoD provided in the 2024 FYDP for 2024 through 2028. CBO’s projections for later years are based as much as possible on policies underlying DoD’s estimates of costs in the 2024 FYDP, current laws regarding the compensation of military personnel, and the longer-term acquisition plans that DoD publishes in official documents (such as the Navy’s 30-year shipbuilding plan). CBO incorporated its estimates of how the economy will change in the future in its projections of those costs.2 For the parts of DoD’s budget for which such policies and cost estimates were not specified, CBO generally based its projections on trends in prices and compensation anticipated for the broader economy (see Table 1-1).3
Table 1-1.
Methods Used by CBO to Project the Costs of DoD’s Plans Beyond the 2024 FYDP

Data source: Congressional Budget Office.
This table does not show the methods that CBO used to produce alternative projections of costs. Those alternative projections are based on historical trends and show how DoD’s costs might differ from the estimates provided in the 2024 FYDP.
DoD = Department of Defense; ECI = employment cost index for wages and salaries of workers in the private sector, as defined by the Bureau of Labor Statistics; FYDP = Future Years Defense Program; MHS = Military Health System.
CBO’s projections also incorporate the assumption that the size and composition of the military and the number of civilian personnel would remain unchanged after 2028 unless DoD has specified otherwise. Additionally, CBO’s projections reflect the assumption that for any major weapon system expected to reach the end of its service life before 2038 for which DoD has not yet announced a replacement, DoD would develop and purchase a generally similar but more modern system. For example, the Air Force may need to begin replacing its fleet of C-17 transport aircraft before 2038. Air Force officials have indicated that future airlifters may include capabilities that are not present in today’s fleet—but the absence of firm details led CBO to base its estimate of the cost of replacement aircraft on the cost of the C-17.4
CBO’s estimates of the costs for O&S and infrastructure over the 2029–2038 period are based primarily on the projected size of the force, historical cost growth, and economic factors such as the employment cost index (ECI) for wages and salaries of workers in the private sector and the gross domestic product price index. (The ECI is a measure of the cost of compensating workers that is reported by the Bureau of Labor Statistics.)
CBO’s estimates of acquisition costs are based primarily on how spending for individual DoD acquisition programs is expected to change over the projection period. About two-thirds of the total cost of acquisition in CBO’s projections is based on either DoD’s long-term plans for specific programs or CBO’s expectations about the way other major components of DoD’s acquisition portfolio (such as programs that DoD has not yet started but that CBO projects will be needed before 2038) might unfold over the coming years. The other one-third of the total cost of acquisition—primarily for smaller programs—is based on historical relationships between major acquisition efforts and the total acquisition budget. (For more details on O&S funding, see Chapter 2; for more details on acquisition funding, see Chapter 3; and for more details on infrastructure funding, see Chapter 4.)
1. Those supplemental appropriations totaled $37 billion (in 2024 dollars).
2. See the supplemental data that accompany Congressional Budget Office, The Budget and Economic Outlook: 2023 to 2033 (May 2023). The file, which is listed under the heading “Historical Data and Economic Projections,” is available at www.cbo.gov/data/budget-economic-data#11.
3. For a detailed discussion of CBO’s methods for projecting costs for the individual components of DoD’s budget, see Congressional Budget Office, An Analysis of the Obama Administration’s Final Future Years Defense Program (April 2017), www.cbo.gov/publication/52450. (Chapter 2 covers O&S, and Chapter 3 covers acquisition.)
4. See Brian Everstine, “USAF Accelerates Plans for Next-Generation Airlifter and Tanker,” Aviation Week Network (November 2, 2022), https://tinyurl.com/2f5htk62.
Chapter 2Projected Costs of Operation and Support
Funding for operation and support is the sum of the appropriations for three public law titles: military personnel, operation and maintenance, and revolving and management funds. (In this analysis, the Congressional Budget Office includes the relatively small amount that the Department of Defense requested for revolving and management funds with the O&M appropriation because those titles involve similar activities.)
O&S funding can be separated into three general types of costs, regardless of which public law title funds them:
- Compensation, which includes cash pay, noncash benefits, and accrual payments for retirement benefits for military personnel. For civilians and service contractors, it also includes DoD’s contributions for health insurance. Those costs fall under the appropriations for military personnel and O&M (for civilian employees and contractors).
- The Military Health System (MHS), which ensures military readiness for combat operations and provides medical care for military personnel, military retirees, and their families as part of the military’s compensation package. Those costs also fall under the appropriations for military personnel and O&M.
- Other O&M, which covers costs such as those for base operations, fuel, depot maintenance, spare parts, and transportation. Those costs fall entirely under the appropriation for O&M.
CBO based its projections of DoD’s O&S costs on the anticipated growth in those three categories of costs. A sum of the costs in all three categories would exceed total O&S funding because the costs of compensation for military and civilian personnel who work in the MHS would be counted twice: once in the compensation category and again in the MHS category (see Table 2-1). When discussing the categories in isolation, CBO includes those costs in both categories to present a more complete picture of each category’s costs, but it corrects for that double-counting in its presentation of overall O&S costs.
Table 2-1.
DoD’s Operation and Support Costs, by Appropriation Title and as Categorized by CBO
Billions of 2024 dollars

Data source: Congressional Budget Office. See www.cbo.gov/publication/59511#data.
Funding for operation and support is the sum of the appropriations for military personnel, operation and maintenance, and revolving and management funds.
DoD = Department of Defense; FYDP = Future Years Defense Program; MHS = Military Health System; O&M = operation and maintenance.
a. CBO included the relatively small amount in DoD’s budget for revolving and management funds with the O&M appropriation because those two titles involve similar activities.
b. Compensation consists of cash pay, noncash benefits, and accrual payments for retirement benefits. For civilians and contractors, it also includes DoD’s contributions for health insurance.
c. The amounts shown here do not include compensation for civilian personnel and contractors funded from accounts other than O&M.
d. These amounts do not include spending for the MHS in accounts other than operation and support. The amounts shown for military and civilian pay in the MHS and accrual payments for retirees are also included in the compensation category. Because those costs are included twice, the sum of the components in the lower panel of the table exceeds total appropriations for operation and support in the upper panel.
e. “Other O&M” is the sum of the O&M and revolving and management fund appropriation titles minus costs for civilian compensation and the MHS.
O&S Costs in the 2024 FYDP
Nearly two-thirds of DoD’s total budget request for 2024 was for O&S: $179 billion for military personnel and $332 billion for O&M. The $510 billion requested for O&S was about the same as the amount enacted for 2023 (after adjusting for inflation and excluding supplemental O&S funds provided in 2023 for assistance to Ukraine and disaster relief). Over the next four years, DoD expects O&S costs to increase slightly (by about 2 percent in real terms), ending the period covered by the Future Years Defense Program $10 billion above the amount requested for 2024.
Though total O&S funding would be only slightly higher in 2028, a policy change that DoD is considering for how it funds medical care for military retirees would lead to considerable changes in the military personnel and O&M accounts. Under that policy change, the cost of health care for younger military retirees—those too young for Medicare—would no longer be funded primarily with O&M appropriations, as it is for active-duty personnel. Instead, DoD would fund their health care as it funds health care for Medicare-eligible retirees: It would make accrual payments with military personnel funds to the Treasury, which would then bear the retirees’ health care costs in future years. In DoD’s budget plan, the resulting increases in the military personnel accounts (for the accrual payments) are offset by decreases in O&M of about the same size.1 Although the Congress has not yet approved that policy change, it is reflected in DoD’s plans, so CBO’s projections reflect it as well.
By 2028, military personnel costs would be $15 billion higher than they were in 2024. Most of that growth would occur in 2025—including an increase of $11 billion due to the proposed policy change, which would move health care funding for some retirees out of O&M and into military personnel accounts. Thereafter, military personnel costs would rise more slowly. The sharp growth in those costs in 2025 due to the change in how retirees’ health care is funded would be offset by an $11 billion decrease in O&M costs for the MHS. Excluding that change, DoD expects O&M costs to increase by about 2 percent through 2028.
Compensation
DoD’s total workforce comprises military personnel (both full-time and part-time personnel), federal civilians, and service contractors. Compensation for the three groups is spread across several categories of DoD’s budget, but most of the compensation is recorded in O&S. Service contractors are hired by private companies under service contracts awarded expressly to augment DoD’s military and civilian workforce. (Service contractors are distinct from the individuals employed by companies to produce weapons and provide other goods to DoD.)2
The size of DoD’s compensation budget is well documented for military and civilian personnel, but not for service contractors. Various reports published with the federal budget provide data that CBO uses to construct estimates of the size and cost of the contractor workforce, but the data on contractors’ compensation are known to be incomplete.3 For example, data from the Office of Management and Budget indicate that the number of service contractors is two to three times larger than reported by DoD.4 Further complicating issues is a lack of published compensation rates for DoD’s contractors.
Within the O&S category, total funding for compensation (including DoD’s estimates of compensation for service contractors) would increase by 5 percent (in real terms) over the FYDP period, rising from $329 billion in 2024 to $347 by 2028 (see Table 2-1). In its 2024 budget, DoD requested a 5.2 percent pay raise for the military workforce, equal to the increase in the employment cost index that DoD expected when the FYDP was prepared. DoD also requested a 5.2 percent pay raise for its civilian employees in 2024, equal to the pay raise the President proposed for civilian employees throughout the federal government.5 Those raises do not reflect the potential increases in costs to compensate service contractors hired to support DoD’s operations, which CBO assumes will grow with its projections of the ECI.6
For 2025 through 2028, DoD’s FYDP reflects the assumption that pay for military personnel would increase by 2.6 percent per year and pay for civilian personnel would increase by 2.1 percent per year (in current dollars). Both amounts are below the average annual increase in the ECI (3.9 percent) that CBO projects.7 (CBO examines the effect of that difference in the final section of this chapter.)
Military Health System
DoD requested $59 billion to fund the MHS in 2024. From 2024 through 2028, in DoD’s projections, MHS costs increase by a total of less than 1 percent in real terms (see Figure 2-1). There are five categories of MHS costs: military personnel (for uniformed health care providers), direct care (for government health care facilities and their civilian employees), purchased care (for private-sector health care providers), pharmaceuticals, and accrual payments for health care provided to military retirees and their families (including TRICARE for Life, which is funded through the Medicare-Eligible Retiree Health Care Fund, or MERHCF). The first and last categories are funded in the military personnel appropriation; the middle three categories are funded in the O&M appropriation.8
Figure 2-1.
Costs of the Military Health System in the 2024 FYDP and in CBO’s Projections
Billions of 2024 dollars

The costs of military health care rise in CBO’s projections, driven in large part by economywide increases in medical costs.
Data source: Congressional Budget Office. See www.cbo.gov/publication/59511#data.
Before 2001, pharmaceutical costs were not identified separately but were embedded in the costs of two categories: “purchased care and contracts” and “direct care and administration.” Since 2001, most pharmaceutical costs have been identified separately, but some are embedded in the category “accrual payments for retirees.”
The amounts shown here do not include spending for the Military Health System in accounts other than military personnel and operation and maintenance.
DoD = Department of Defense; FYDP = Future Years Defense Program.
a. Through 2024, accrual payments cover the costs of TRICARE for Life, which provides health care for Medicare-eligible retirees, and health care costs for younger, Medicare-ineligible retirees are included in the other categories. After 2024, DoD’s costs for the health care of all retirees are included in the “accrual payments for retirees” category.
Two developments affect MHS funding in DoD’s 2024 FYDP. First, because of the aforementioned policy change, beginning in 2025, there is an abrupt decrease in the O&M accounts for the Defense Health Program and a commensurate increase in accrual payments in the military personnel accounts (as shown by the increase in accrual payments for retirees and the decrease in the other military health care categories in Figure 2-1). That accounting change—which would move funds from the O&M appropriation to the military personnel appropriation—signals DoD’s desire to consolidate health care costs for its military retirees into a single place in the budget, the MERHCF accounts. In that case, the resulting unfunded liability for retirees’ health care would be paid by the Treasury.
Second, DoD projects that health care costs will decrease slightly (in real terms) over the FYDP period. DoD assumes that growth in the costs of medical care will be offset by savings stemming from the department’s plans to consolidate military treatment facilities and reduce the number of military personnel assigned to the MHS while shifting more responsibility for the costs of care to civilian personnel. That assumption stands in contrast to CBO’s projections of economywide growth in medical costs. Although DoD has been able to slow growth in such costs through efficiency initiatives in recent years, it is uncertain whether the department will be able to achieve the efficiencies planned over the next five years—including reductions in the number of military personnel providing care and consolidation of treatment facilities—that would be necessary to offset projected inflation in medical costs.
Other O&M
Other O&M costs are defined as the remainder of total O&M costs after excluding civilian compensation, the subset of DoD’s service contractor compensation that can be identified in federal budget data, and the cost of the MHS in the O&M appropriation.9 This category comprises thousands of activities in a wide range of areas, such as training, equipment maintenance, the operation of military bases, and purchases of fuel. In DoD’s projections, spending for other O&M increases by about 3 percent (in real terms) over the five-year FYDP period.
Projections of O&S Costs for 2029 Through 2038
Beyond the 2024 FYDP period, in CBO’s projections, O&S costs rise steadily. Those costs increase from DoD’s estimate of $521 billion in 2028 to $576 billion in 2038, at an average annual rate of 1 percent above inflation (see Figure 1-1). Costs for compensation, the MHS, and other O&M are all projected to increase after 2028.
Compensation
In total, CBO projects that annual spending for compensation for military personnel, federal civilians, and service contractors would increase by $38 billion, from $347 billion in 2028 to $384 billion in 2038, or at an average annual rate of 1 percent above the rate of inflation (see Table 2-1).
All told, costs for military compensation would rise by $21 billion from 2028 to 2038. CBO based its projections of compensation costs after 2028 on current law, which sets military pay raises equal to the growth in the ECI unless the Congress or the President act to provide different amounts. After that year, in CBO’s long-term economic projections, the ECI increases at an average annual rate of 1 percentage point above economywide inflation.
Other components of military cash compensation, including housing and subsistence allowances, would also grow faster than inflation, resulting in an overall real increase of $14 billion in that category of costs by 2038. Furthermore, increasing accrual charges in deferred compensation, for retirees’ health care, would add $7 billion to military compensation costs by 2038.
CBO projects that civilian pay would rise with the ECI, maintaining parity with military pay raises and resulting in an increase of $11 billion in compensation costs (in real terms) by 2038. Compensation for service contractors in the budget is also projected to grow with the ECI after 2028, resulting in an increase of $5 billion in compensation costs (in real terms) by 2038.
Military Health System
Three factors contribute to the projected growth in the costs of the MHS after 2028. First, CBO expects the cost of care under the MHS to grow at a rate similar to that of the cost of health care in the general economy. Second, changes in the demographics of the population under the care of the MHS are expected to change the amount and kinds of care provided by the MHS. Third, CBO’s projections incorporate the assumption that the compensation of military personnel and federal civilians in the MHS would grow at the rate of the ECI. Altogether, in CBO’s estimation, MHS costs would grow at an average annual rate of about 2 percent, climbing from $59 billion in 2028 to $72 billion in 2038 (see Figure 2-1).
Other O&M
CBO projects that, consistent with long-standing trends, costs for other O&M would increase faster than inflation.10 Between 1980 and 2020, other O&M costs more than quadrupled in real terms, increasing by about $1,300 annually per active-duty service member. Projected growth that is consistent with that historical trend would cause annual costs for other O&M to increase by $15 billion (or 9 percent) by 2038—an average real increase of 1 percent per year after 2028.
Uncertainty in Projections of O&S Costs
CBO’s projections are not meant to predict future budgetary outcomes. They are extrapolations of DoD’s estimates in the FYDP, made on the premise that most aspects of the current defense plan would remain unchanged. But DoD’s plans could change for many reasons. Projections of economic factors that could affect DoD’s costs—such as changes in the ECI or health care costs—are also uncertain. Higher- or lower-than-projected inflation over the next five years, for example, could affect the size of DoD’s budget substantially.
CBO’s Estimates of O&S Costs Under Alternative Assumptions About Cost Growth
DoD’s actual costs could differ from its estimated costs not only because of uncertainties but also because several of DoD’s assumptions about O&S costs over the FYDP period are not consistent with recent trends. Those estimates result in lower projected rates of cost growth over the FYDP period in all three categories of O&S when compared with CBO’s estimates for 2029 through 2038.
- Even though DoD planned for a 5.2 percent pay raise for both military and civilian personnel in 2024, the department assumed that annual pay raises would be a constant 2.6 percent for military personnel and 2.1 percent for civilian personnel over the remainder of the FYDP period. But CBO’s projections of growth in the ECI during those years are almost twice as high. If military pay raises matched CBO’s most recent ECI projections, DoD’s costs for military compensation would be larger than anticipated in the FYDP. If civilian pay raises matched the ECI projections, O&M costs for civilian compensation would also be larger than anticipated in the FYDP.
- DoD projected that costs for the MHS would remain nearly unchanged throughout the FYDP period, which is counter to CBO’s projections that economywide health care costs in the United States will increase through 2028.
- Other O&M costs have increased faster than inflation for decades despite DoD’s efforts to improve efficiency and eliminate unnecessary activities. Nonetheless, such costs continue to grow slowly in the department’s projections, rising by a total of 3 percent (in real terms) over the FYDP period. If those costs grew at their historical rate, they would exceed the amounts projected in the FYDP.
Using alternative assumptions about cost growth that are more consistent with the factors described above, CBO estimates that cumulative O&S costs from 2024 through 2028 would be $59 billion (or about 2 percent) higher than DoD estimated in the 2024 FYDP. Higher costs during the FYDP period would be compounded in the years after 2028: CBO estimates that cumulative O&S costs over the entire projection period (2024 through 2038) would be $260 billion (or about 3 percent) higher than costs based on CBO’s extension of DoD’s cost estimates (see Table S-1).
1. Although the amount of funds required to pay for health care for younger military retirees each year would not change under the new policy, the shift would create an unfunded liability that the Treasury would have to bear until the accrual charges for active-duty personnel accumulated enough funding to cover it. (That situation is similar to what occurred when DoD switched to accrual funding for military pensions and health care for Medicare-eligible military retirees.) DoD has not provided an estimate of the size of the liability that would result from the proposed policy change.
2. For more on the compensation of service contractors, see testimony of David E. Mosher, Director for National Security Analysis, Congressional Budget Office, before the Subcommittee on Personnel of the Senate Committee on Armed Services, Approaches to Reducing the Department of Defense’s Compensation Costs (July 26, 2023), www.cbo.gov/publication/59375. For a full description of what constitutes a contractor, see Heidi M. Peters, Defense Primer: Department of Defense Contractors, Report IF10600, version 12 (Congressional Research Service, January 17, 2023), https://tinyurl.com/kbkfypnv.
3. Timothy J. DiNapoli, Government Accountability Office, “Service Acquisitions: DoD’s Report to Congress Identifies Steps Taken to Improve Management, But Does Not Address Some Key Planning Issues,” GAO-21-267R (letter, February 22, 2021), www.gao.gov/assets/gao-21-267r.pdf.
4. CBO’s estimates of the size of service contractor workforce are based on data from Office of Management and Budget, Object Class Analysis: Budget of the U.S. Government, Fiscal Year 2024 (March 2023), p. 9, www.govinfo.gov/app/details/BUDGET-2024-OBJCLASS/.
5. About 93 percent of DoD’s civilian employees are compensated using funds from O&M or revolving and management accounts. The remainder are compensated using funds appropriated for procurement, military construction, family housing, or research, development, test, and evaluation.
6. See Congressional Budget Office, “Historical Data and Economic Projections” (February 2023), www.cbo.gov/data/budget-economic-data#11.
7. Ibid.
8. For more information about the Military Health System, see Congressional Budget Office, Approaches to Changing Military Health Care (October 2017), www.cbo.gov/publication/53137.
9. In previous editions of this report, compensation for service contractors was included in the other O&M category. This is the first year that CBO has included a separate analysis of compensation for service contractors, and some of those costs are now included in the compensation category. For a discussion of how CBO estimates the size and costs of DoD’s service contractor workforce, see Testimony of David E. Mosher, Director of National Security Analysis, before the Subcommittee on Personnel Committee of the Senate Committee on Armed Services, Approaches to Reducing the Department of Defense’s Compensation Costs (July 26, 2023), www.cbo.gov/publication/59375.
10. For more details on CBO’s approach to analyzing other O&M costs, see Congressional Budget Office, An Analysis of the Obama Administration’s Final Future Years Defense Program (April 2017), www.cbo.gov/publication/52450.
Chapter 3Projected Costs of Acquisition
Acquisition accounts for 37 percent of the Department of Defense’s funding request for 2024. Acquisition funding is used to develop and buy new weapon systems and other major equipment, to upgrade the capabilities or extend the service life of existing weapon systems, and to support research on future technologies. That funding comprises appropriations for procurement and for research, development, test, and evaluation.
How CBO Projected Acquisition Costs
The Congressional Budget Office used two approaches to project acquisition costs. For major programs involving the acquisition of new weapon systems or upgrades to existing systems, CBO projected costs and schedules on a program-by-program basis. For smaller programs and general activities related to research and development, CBO made aggregate projections on the basis of policies either stated or implied in DoD’s planning documents or on the basis of historical trends and historical relationships between total acquisition funding and the funding for major programs.
CBO based its program-by-program projections not only on the 2024 Future Years Defense Program but also on detailed plans, such as those described in Selected Acquisition Reports, that the services have issued for some major systems (such as the Air Force’s new trainer aircraft). For other major systems (such as a new assault aircraft for the Army), CBO based its estimates on more general descriptions the services have provided about schedules and costs for development and procurement. For still other systems (for instance, future fighter aircraft that the Navy and Air Force are considering fielding in the 2030s), CBO based its estimates on the premise that the services would replace retiring weapon systems with similar but more technologically advanced ones. In those cases, even though DoD has not yet developed detailed schedules or cost estimates, acquisition can be anticipated if DoD is to maintain the current size of the force when today’s weapons reach the end of their service lives.
Acquisition Costs in the 2024 FYDP
DoD’s 2024 budget request for acquisition totaled $315 billion in two appropriation titles—$170 billion for procurement and $145 billion for RDT&E. That request was about 1 percent more than the inflationadjusted amount appropriated for 2023 (excluding supplemental appropriations for Ukraine). Acquisition costs in the 2024 FYDP decrease by about 3 percent over the FYDP period, to $307 billion in 2028.
Costs by Appropriation Title
The $170 billion requested for procurement in 2024 is $1.9 billion (or about 1 percent) less, in real terms, than the total amount enacted for 2023 but $1.4 billion more than the 2023 amount if the 2023 supplemental appropriations are excluded. In the 2024 FYDP, costs for procurement rise to $178 billion in 2026 but fall back to $176 billion in 2028, for a net increase of nearly 4 percent over the FYDP period. The average cost over the FYDP period is about 9 percent higher than the inflation-adjusted average of total procurement costs (including costs for the wars in Afghanistan, Iraq, and Syria) from 2001 through 2023.
The increase in procurement costs over the FYDP period would be offset by a net decrease of 10 percent in RDT&E costs. Although the $145 billion requested for RDT&E in 2024 is $1.2 billion (or about 1 percent) more, in real terms, than the total amount enacted for 2023, RDT&E costs would fall to $131 billion by 2028. The winding down of the development phase of several major weapons programs that are slated to begin production in the later years of the FYDP period contributes to the decrease in RDT&E costs. Despite that decrease, costs for RDT&E would remain substantial compared with past costs; annual funding for RDT&E has averaged about $87 billion since 1980 and $104 billion since 2001 (in 2024 dollars).
Since the mid-2010s, RDT&E has accounted for a steadily increasing share of acquisition funding, reaching 46 percent in 2023 (see Figure 3-1). That increase is the result of DoD’s changing its focus from procuring weapons for counterinsurgency operations to developing new weapons for potential conflicts against adversaries with advanced military capabilities. The relative shift from RDT&E back to procurement over the FYDP period—a reversal of the recent trend—indicates that the services plan to begin purchasing the modern weapons that have been under development.
Figure 3-1.
Share of Acquisition Costs for Procurement and RDT&E in the 2024 FYDP and in CBO’s Projections
Percent

CBO projects that procurement’s share of acquisition costs would increase over the FYDP period. Beginning in 2030, that share would exceed the average since 2001.
Data source: Congressional Budget Office. See www.cbo.gov/publication/59511#data.
DoD = Department of Defense; FYDP = Future Years Defense Program; RDT&E = research, development, test, and evaluation.
Costs by Military Department
The Army’s annual acquisition costs would decrease slightly over the FYDP period, from $40 billion in 2024 to $39 billion in 2028 (see Figure 3-2). Costs for procurement would rise by 8 percent over that period as the Army continued to modernize nearly all of its major weapon systems.
Figure 3-2.
Acquisition Costs, by Military Department, in the 2024 FYDP and in CBO’s Projections
Billions of 2024 dollars
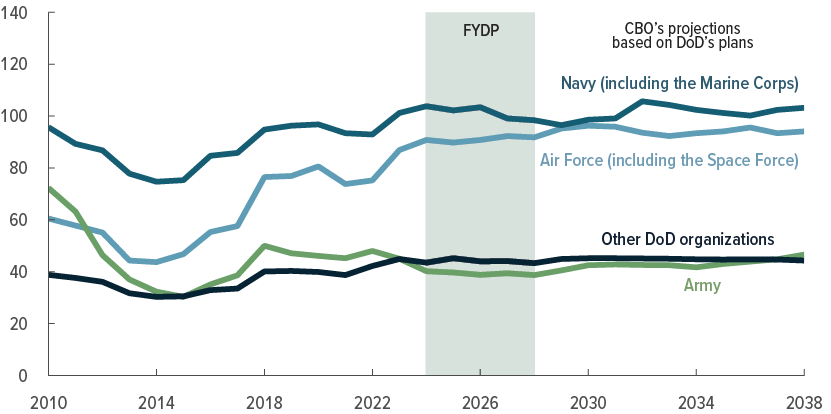
CBO projects that acquisition costs for all three military departments would increase after the FYDP period.
Data source: Congressional Budget Office. See www.cbo.gov/publication/59511#data.
Acquisition funding is the sum of the appropriations for procurement and for research, development, test, and evaluation.
Funding shown for the Air Force does not include more than $30 billion each year for classified activities not carried out by the service.
DoD = Department of Defense; FYDP = Future Years Defense Program.
According to the Army’s plans, annual costs for combat and support vehicles and for missiles and munitions would increase by roughly 25 percent. Costs for combat and support vehicles would rise from $5.2 billion in 2024 to $6.4 billion in 2028 as purchases of Armored Multi-Purpose Vehicles and M10 Booker combat vehicles increased and as upgrades to Abrams tanks accelerated. Procurement costs for missiles and munitions would climb from $7.9 billion to $9.7 billion as a result of increased purchases of missile defense systems and several new long-range offensive systems. Missile and munition procurement would average 36 percent of total Army procurement over the FYDP period, significantly higher than its average of 25 percent over the previous 10 years.
Those increases would be partially offset by decreases in costs for aircraft and other equipment. Costs for aircraft procurement would decline by 17 percent over the FYDP period as purchases of aircraft that are currently in production reach completion. Those decreases, however, would start to be offset by initial purchases of new Future Vertical Lift aircraft toward the end of the FYDP period. Funding for RDT&E would decrease by 22 percent through 2028 as the development of new missile and armored vehicle systems neared completion.
Acquisition costs for the Department of the Navy (including the Marine Corps) would decrease by about 5 percent over the FYDP period, from nearly $104 billion in 2024 to $98 billion in 2028. Procurement costs would fall by $1.2 billion, and RDT&E costs would fall by $4.1 billion. Within the procurement category, a 31 percent increase in costs for missiles and munitions (including modernized Trident nuclear-tipped ballistic missiles, air-launched antiship missiles, and both standard Sea Sparrow and Evolved Sea Sparrow air defense missiles) would be offset by decreases in other costs. The decrease in RDT&E costs would largely stem from completing the development of new missile systems.
For the Department of the Air Force (including the Space Force), annual acquisition costs would average $91 billion from 2024 through 2028 and would vary only slightly over that period.1 As in the other services, increased costs for procurement would be offset by decreased costs for RDT&E. Procurement costs would rise by nearly 20 percent, from $35 billion in 2024 to $42 billion in 2028. Costs for aircraft would increase by 12 percent as the services purchased more F-35As and as the new advanced trainer and the B-21 bomber entered production. Procurement costs for missiles and munitions would more than double (from $5.4 billion in 2024 to $11.8 billion in 2028) as replacements for the Minuteman III intercontinental ballistic missile entered production. And although procurement costs for space systems would be 13 percent lower in 2028 than in 2024, they would be 5 percent higher, on average, in 2025 and 2026. The Air Force’s costs for RDT&E would decrease from $55 billion to $50 billion, leaving its total acquisition costs nearly unchanged.
DoD’s budget also includes defensewide acquisition funding, which is allocated to defense agencies other than the three military departments. The agencies funded by defensewide appropriations carry out activities in conjunction with the services—for example, performing advanced research, developing missile defenses (through the Missile Defense Agency), overseeing special operations, and managing financial and information technology systems. Acquisition costs for defensewide programs remain nearly unchanged in the 2024 FYDP, averaging $44 billion per year from 2024 through 2028. Costs for the Missile Defense Agency would average 22 percent of defensewide acquisition funding over the FYDP period.
Projections of Acquisition Costs for 2029 Through 2038
In CBO’s projections, DoD’s acquisition costs rise steadily in the years beyond the FYDP period, from $307 billion in 2028 to $330 billion in 2038. The increase is fastest from 2028 through 2031, when costs rise by a total of $16 billion (or 5 percent). Over the next seven years, costs increase more slowly, climbing by a total of $7 billion (or about 2 percent—averaging 0.3 percent per year; see Figure 1-1).
Costs by Appropriation Title
Procurement costs would climb sharply in the first two years after the FYDP period, reaching $198 billion in 2030, up $22 billion (or 12 percent) from their 2028 total. Such costs would then grow more slowly, rising by a total of about 4 percent (that is, by $7 billion) from 2030 to 2032 and by an average of 0.2 percent per year over the next six years, reaching $208 billion in 2038. Procurement’s portion of acquisition funding would increase from 57 percent in 2028 to 63 percent in 2038. (Since 2001, that share has averaged 60 percent.)
The steep increases in procurement costs in the years immediately after the FYDP period indicate that DoD’s current plans would cause a procurement “bow wave” by constraining procurement during the FYDP period but requiring substantially larger acquisition budgets thereafter. Such bow waves beyond the FYDP period have often resulted from constraints on DoD’s plans, particularly during periods when flat or declining budgets have been anticipated. In the case of the 2024 FYDP, DoD officials have stated that they expect several expensive new weapons to enter service in the early 2030s.2 Meeting those expectations would require sharp funding increases in the years after 2028.
Costs for RDT&E would decrease from $131 billion in 2028 to $120 billion in 2035 but then increase to $122 billion in 2038. The variation in RDT&E costs primarily reflects the timing of major weapon development programs beyond the FYDP period. CBO’s projections of the cost of weapons for which DoD has not yet articulated specific plans incorporate the assumption that DoD would pursue modest advances in technological capabilities. Costs for RDT&E would probably be higher if DoD opted to pursue greater (and thus higher-risk) advances in technology.
Costs by Military Department
In the first two years after the FYDP period, the Army’s acquisition costs would increase by 10 percent, rising from $39 billion in 2028 to $42 billion in 2030. Costs would then increase by an annual average of 1.2 percent over the next eight years, reaching $47 billion in 2038 (see Figure 3-2). On average, procurement costs would be 25 percent higher from 2029 through 2038 than they were in the final year of the FYDP period, and costs for RDT&E would be 18 percent lower. As a share of acquisition funding, the Army’s procurement funding would average 77 percent over the 2029–2038 period—substantially higher than its expected average of 66 percent for the FYDP period.
Much of the increase in the Army’s procurement costs after the FYDP period would be attributable to purchases of Future Vertical Lift aircraft (the Future Long-Range Assault Aircraft and the Future Attack Reconnaissance Aircraft) and ground combat vehicles (including a new armored fighting vehicle that would replace today’s Bradley vehicles).3 Continued decreases in RDT&E through 2034 would slightly offset those costs. Procurement of missiles and munitions would vary slightly between 2028 and 2036 before dropping by about 15 percent over the last two years of the projection period.
For the Navy (including the Marine Corps), acquisition costs would remain fairly steady for the first three years after the FYDP period (averaging $98 billion from 2029 through 2031), CBO estimates. The Navy’s acquisition costs would jump to $106 billion in 2032 and then vary between $100 billion and $104 billion through 2038. Costs for both procurement and RDT&E would be about $2 billion higher in 2038 than in 2028, reflecting a 3 percent increase for procurement and a 10 percent increase for RDT&E.
Much of the annual variation in acquisition costs, including the 7 percent increase from 2031 to 2032, results from unevenness in costs for shipbuilding because a single ship can cost several billion dollars. Annual shipbuilding costs from 2029 through 2038 would average $27 billion as the Navy continued to expand its fleet and to replace two of its most expensive classes of ships: aircraft carriers and ballistic missile submarines.4 Although average annual shipbuilding costs in those years would be 14 percent lower than the average over the FYDP period, they would be 26 percent higher than the average since 2001.
The Navy’s annual costs for missiles and munitions would continue to increase after the FYDP period, rising by 2.5 percent per year through 2033 and then remaining fairly steady through 2038. Increases in costs for some weapons (such as for Trident D5 modernization) would be partially offset by the completed purchases of other weapons (such as Conventional Prompt Strike missiles).
The Navy’s annual aircraft procurement costs would average $20 billion from 2029 through 2038, 15 percent more than during the FYDP period, CBO estimates. Costs resulting from the introduction of new aircraft (such as replacements for the E-6B Mercury nuclear communications aircraft, the F/A-18E/F Super Hornet fighter, the T-45C Goshawk trainer, and the MH-60R/S Seahawk helicopter) would be offset by the completion of current programs to acquire new aircraft (such as the F-35 Joint Strike Fighter and the Marine Corps’ CH-53K King Stallion helicopter).
Acquisition costs for the Air Force (including the Space Force) would rise from $92 billion in 2028 to $96 billion in 2031 and would vary between $92 billion and $96 billion over the next seven years.5 That growth in costs would result from programs to modernize many aircraft and other weapon systems, including fighters (the F-35A and the Next-Generation Air Dominance system), bombers (the B-21), trainers (the T-7A Red Hawk), and nuclear-tipped missiles (the Long-Range Standoff Weapon cruise missile and the Sentinel intercontinental ballistic missile).6 Costs for procuring space systems would jump from an annual average of $5 billion over the FYDP period to $9 billion over the following decade as the Space Force fielded new generations of satellite constellations.
In CBO’s projections for 2029 through 2038, defensewide acquisition costs remain fairly constant in real terms, averaging $45 billion per year. Missile defense costs average $10 billion annually, about the same as in the FYDP period. Other costs, such as those for other defense agencies, increase very slowly—by roughly 0.4 percent annually in real terms.
Uncertainty in Projections of Acquisition Costs
Like the projections of O&S costs, the projections of DoD’s acquisition costs are subject to considerable uncertainty. Much of that uncertainty stems from the possibility that DoD’s plans and their associated costs could change, as well as the possibility that the future weapon systems that CBO anticipates, consistent with those plans, might evolve differently. In addition, the military has often underestimated the cost to acquire weapon systems, as discussed below.
Changes in acquisition plans can result from various factors. In earlier FYDPs, for example, funding constraints imposed by the Budget Control Act of 2011 (Public Law 112-25) led DoD to curtail its planned acquisition spending. Adjustments in the military capability of perceived adversaries can also spur changes in DoD’s acquisition plans. For instance, DoD had no plans to purchase thousands of mine-resistant vehicles until they became necessary to counter roadside bombs in Iraq; similarly, DoD did not have programs focused on contending with hypersonic weapons (missiles and projectiles that travel much faster than the speed of sound) until Russia and China began testing such weapons several years ago.
The military services’ plans for future space systems and for new command and control systems are particularly uncertain. For example, the Space Force has outlined plans for several satellite constellations that would provide an array of capabilities, including communications, missile defense, surveillance and reconnaissance, and tracking of ground targets. If pursued, those plans are likely to be costly. They might enable DoD to lower costs in other areas, though—by allowing the Air Force to retire some of its reconnaissance aircraft, for instance.
CBO’s Estimates of Acquisition Costs Under Alternative Assumptions About Cost Growth
Growth in the costs of weapons programs could cause acquisition costs to differ from DoD’s and CBO’s projections. According to analyses by the RAND Corporation and the Institute for Defense Analyses (IDA), DoD has tended to underestimate the costs of its major weapons programs.7 Actual costs could be higher than early estimates for many reasons, including these:
- Underestimates of costs in DoD’s initial plans;
- Changes in economic factors, such as the costs of labor and raw materials;
- Changes in performance requirements, which can necessitate costly design modifications during development;
- Lower-than-anticipated annual funding, which can increase total costs by disrupting established plans and schedules and by extending programs (and their associated overhead costs) over longer periods; and
- Unanticipated technological challenges posed by new systems, including their integration with established systems.
CBO’s projections of long-term acquisition costs are based on DoD’s estimates and on the quantities of items that would be purchased each year and in total (as specified in DoD’s long-range plans). But CBO also prepared alternative estimates based on historical patterns of growth in DoD’s acquisition costs. To do so, CBO applied cost-growth factors derived from RAND’s and IDA’s research to the portfolio of large weapons programs, excluding those for Navy ships, in the 2024 FYDP.8 (For Navy ships, CBO used detailed estimates that it prepared for its annual analysis of the Navy’s shipbuilding plans.)
Using the resulting cost estimates instead of DoD’s cost estimates raises total projected acquisition costs by 4 percent over the FYDP period and by 10 percent over the 2029–2038 period. Those increases equate to an additional $11 billion per year, on average, over the 2024–2028 period and an additional $27 billion per year, on average, from 2029 through 2038 (see Table S-1). The potential increases are proportionally larger for the years beyond the FYDP period because there is greater uncertainty about the composition and cost of DoD’s acquisition portfolio.
1. Those costs do not include costs for classified activities performed outside of the Air Force that are funded through the service’s procurement and RDT&E accounts. Those costs, which totaled $37 billion in the 2024 budget request, are included when CBO refers to total acquisition costs for DoD. CBO estimated that those costs would increase slightly (in real terms) over the FYDP period.
2. For example, see John A. Tirpak, “Kendall Reveals New Details on Air Force Plans: 1,000 CCAs, 200 NGAD Fighters,” Air & Space Forces Magazine (March 7, 2023), https://tinyurl.com/wj3a42xf; Sam LaGrone, “CNO Gilday: Next-Generation Air Dominance Will Come Ahead of DDG(X) Destroyer,” USNI News (January 18, 2023), https://tinyurl.com/yz5c6dkt; and Jen Judson, “US Army Faces Key Decisions to Advance Future Vertical Lift Aircraft Programs,” Defense News (March 31, 2022), https://tinyurl.com/54dd8zn8.
3. For a detailed discussion of the Army’s ground combat vehicle and aircraft fleets, see Congressional Budget Office, Projected Acquisition Costs for the Army’s Ground Combat Vehicles (April 2021), www.cbo.gov/publication/57085, and The Cost of Replacing Today’s Army Aviation Fleet (May 2019), www.cbo.gov/publication/55180. Projections of costs and replacement schedules have changed since the publication of those reports.
4. See Congressional Budget Office, An Analysis of the Navy’s 2024 Shipbuilding Plan (forthcoming), and How CBO Estimates the Cost of New Ships (April 2018), www.cbo.gov/publication/53785.
5. Those amounts do not include the classified activities that are funded through the Air Force’s acquisition budget but not carried out by the service. CBO projects that those “pass-through” amounts would grow slowly after 2028, averaging $41 billion per year through 2038.
6. For details about DoD’s aircraft fleets, see Congressional Budget Office, The Cost of Replacing the Department of Defense’s Current Aviation Fleet (January 2020), www.cbo.gov/publication/55950. (Projections of costs and replacement schedules have changed since the publication of that report.) For details about the modernization of nuclear weapon systems, see Congressional Budget Office, Projected Costs of U.S. Nuclear Forces, 2023 to 2032 (July 2023), www.cbo.gov/publication/59054.
7. David L. McNicol and Linda Wu, Evidence on the Effect of DoD Acquisition Policy and Process on Cost Growth of Major Defense Acquisition Programs, IDA Paper P-5126 (Institute for Defense Analyses, September 2014), https://tinyurl.com/3kd94ft4 (PDF); Obaid Younossi and others, Is Weapon System Cost Growth Increasing? A Quantitative Assessment of Completed and Ongoing Programs, MG-588-AF (RAND Corporation, 2007), www.rand.org/pubs/monographs/MG588.html; and Mark V. Arena and others, Historical Cost Growth of Completed Weapon System Programs, TR-343-AF (RAND Corporation, 2006), www.rand.org/pubs/technical_reports/TR343.html.
8. For details about how CBO applies those cost-growth factors, see Congressional Budget Office, An Analysis of the Obama Administration’s Final Future Years Defense Program (April 2017), pp. 47–50, www.cbo.gov/publication/52450.
Chapter 4Projected Costs of Infrastructure
Infrastructure funding accounts for about 2 percent of the Department of Defense’s funding request for 2024. The budget for infrastructure comprises appropriations for military construction and family housing, which provide funds to build and renovate DoD’s facilities. Appropriations for military construction cover facilities such as buildings, runways, and piers used by the military. Appropriations for family housing are used to manage, maintain, and sustain the housing on military bases.1
Infrastructure Costs in the 2024 FYDP
DoD requested a total of $17 billion for infrastructure in 2024. That amount is about one-third more, in real terms, than the department requested for 2023 but 15 percent less than the Congress appropriated for that year. Requested funding for infrastructure includes $15 billion for military construction and $2 billion for family housing.
In the 2024 Future Years Defense Program, annual infrastructure costs increase to nearly $18 billion in 2025 and then fall back to $14 billion by 2028. Military construction costs increase by 8 percent from 2024 to 2025, rising from $15 billion to $16 billion, and then decrease to $12 billion per year by 2028. Appropriations for family housing are, on average, about 10 percent lower (in real terms) from 2025 through 2028 than they were in 2024, averaging $1.7 billion per year.
Projections of Infrastructure Costs for 2029 Through 2038
In the Congressional Budget Office’s projections, infrastructure costs in DoD’s budget increase by an average of 1.2 percent per year after the FYDP period, reaching $15 billion in 2038. Those increases are based on CBO’s projections of real growth in the costs of construction projects in the general economy.
Uncertainty in Projections of Infrastructure Costs
The primary source of uncertainty in the current projections of infrastructure costs is whether the Congress will authorize a new round of Base Realignment and Closure (BRAC)—a process in which DoD closes and consolidates military bases to streamline its allocation of resources and cut costs. The last round of BRAC began in 2005, but the Congress has not approved a new round since then.2 Infrastructure costs would change if a new round of BRAC was authorized, but the size and timing of those changes cannot be estimated with confidence.
1. Since lawmakers enacted the Military Housing Privatization Initiative in 1996, costs to operate and maintain most military housing have been transferred to private companies. In DoD’s budget, costs for that privatized housing have been shifted to housing allowances in the military personnel appropriation.
2. The Congress prohibited spending on an additional round of BRAC in the National Defense Authorization Act for Fiscal Year 2020 (Public Law 116–92), which was enacted in December 2019.
About This Document
This report was prepared at the request of the Senate Committee on the Budget. In keeping with the Congressional Budget Office’s mandate to provide objective, impartial analysis, the report makes no recommendations.
David Arthur and F. Matthew Woodward prepared the report with guidance from David Mosher and Edward G. Keating. Elizabeth Bass, Michael Bennett, Eric J. Labs, and Adam Talaber contributed to the analysis. Eric J. Labs fact-checked the report.
Jeffrey Kling and Robert Sunshine reviewed the report, Christine Browne edited it, and Jorge Salazar created the graphics and prepared the text for publication. The report is available at www.cbo.gov/publication/59511.
CBO seeks feedback to make its work as useful as possible. Please send comments to communications@cbo.gov.

Phillip L. Swagel
Director
October 2023
Correction
The Congressional Budget Office has corrected this report since its original publication. Both the PDF and online versions were corrected, but for ease of reference, the location of the correction in the PDF is indicated below.
The following change was made on January 12, 2024:
Page 16, Figure 3-1: “Billions of 2024 dollars” was changed to “Percent” in the unit of measure.