CBO’s 2016 Long-Term Projections for Social Security: Additional Information
Under current law, CBO projects, Social Security’s trust funds, considered together, will be exhausted in 2029. In that case, benefits in 2030 would need to be reduced by 29 percent from the scheduled amounts.
Summary
Social Security, which was established in 1935, is the largest single program in the federal budget. About 73 percent of the roughly 61 million people who currently receive Social Security benefits are retired workers or their spouses and children, and another 10 percent are survivors of deceased workers; all of those beneficiaries receive payments through Old-Age and Survivors Insurance (OASI). The remaining 17 percent of beneficiaries are disabled workers or their spouses and children; they receive Disability Insurance (DI) benefits.
In fiscal year 2016, spending for Social Security benefits totaled $905 billion, or almost one-quarter of federal spending. OASI payments accounted for about 84 percent of those outlays, and DI payments made up about 16 percent.
Each year CBO prepares long-term projections of the federal government’s revenues and outlays, including those for the Social Security program. The most recent set of projections—which cover the period from 2016 through 2046 for the federal budget as a whole and 2016 through 2090 for Social Security—was published in July 2016. Those projections incorporate the assumption that current law generally remains the same but that spending for Medicare and Social Security will continue as specified in law even if their trust funds are exhausted. That assumption is in accordance with the statutory requirement governing the construction of CBO’s 10-year baseline. Through 2046, CBO’s projections incorporate the macroeconomic effects of fiscal policy; after 2046, the projections do not account for such effects.
This report presents additional information about CBO’s long-term projections for Social Security in the form of 12 exhibits that illustrate the program’s finances and the distribution of benefits paid to and payroll taxes collected from various groups of people. In addition to presenting projections of scheduled, or full, Social Security benefits, which are calculated under the Social Security Act without regard to the trust funds’ balances, this report provides projections of payable benefits, which would be less than the scheduled amounts once the trust funds were exhausted because annual outlays would be limited to annual revenues credited to the program. The appendix presents information about CBO’s demographic projections, and a list of definitions of common terms appears at the end of the publication.
How Is Social Security Financed?
Social Security is funded by dedicated tax revenues from two sources: payroll taxes and income taxes on benefits. Today, 96 percent of those revenues come from the payroll tax—generally, 12.4 percent of people’s earnings that are subject to the Social Security tax. Workers and their employers each pay half; self-employed people pay the entire amount. Earnings up to a maximum annual amount—$118,500 in 2016—are subject to the payroll tax. The remaining share of tax revenues for the program—about 4 percent—is collected from income taxes on Social Security benefits. The tax revenues that funded the program totaled $859 billion in fiscal year 2016.
Social Security retirement and disability benefits and the program’s administrative costs are paid from two trust funds—one for the OASI program and one for the DI program. In addition to tax revenues, the funds also receive intragovernmental interest payments on the Treasury securities they hold. In a given year, the receipts credited to a fund, including the interest credited on its balances, minus spending for benefits and administrative costs, constitute the trust fund’s surplus or deficit. Although the two trust funds are legally separate, in this report, CBO generally follows the common analytical convention of considering them as combined.
What Is the Outlook for Social Security Spending and Revenues?
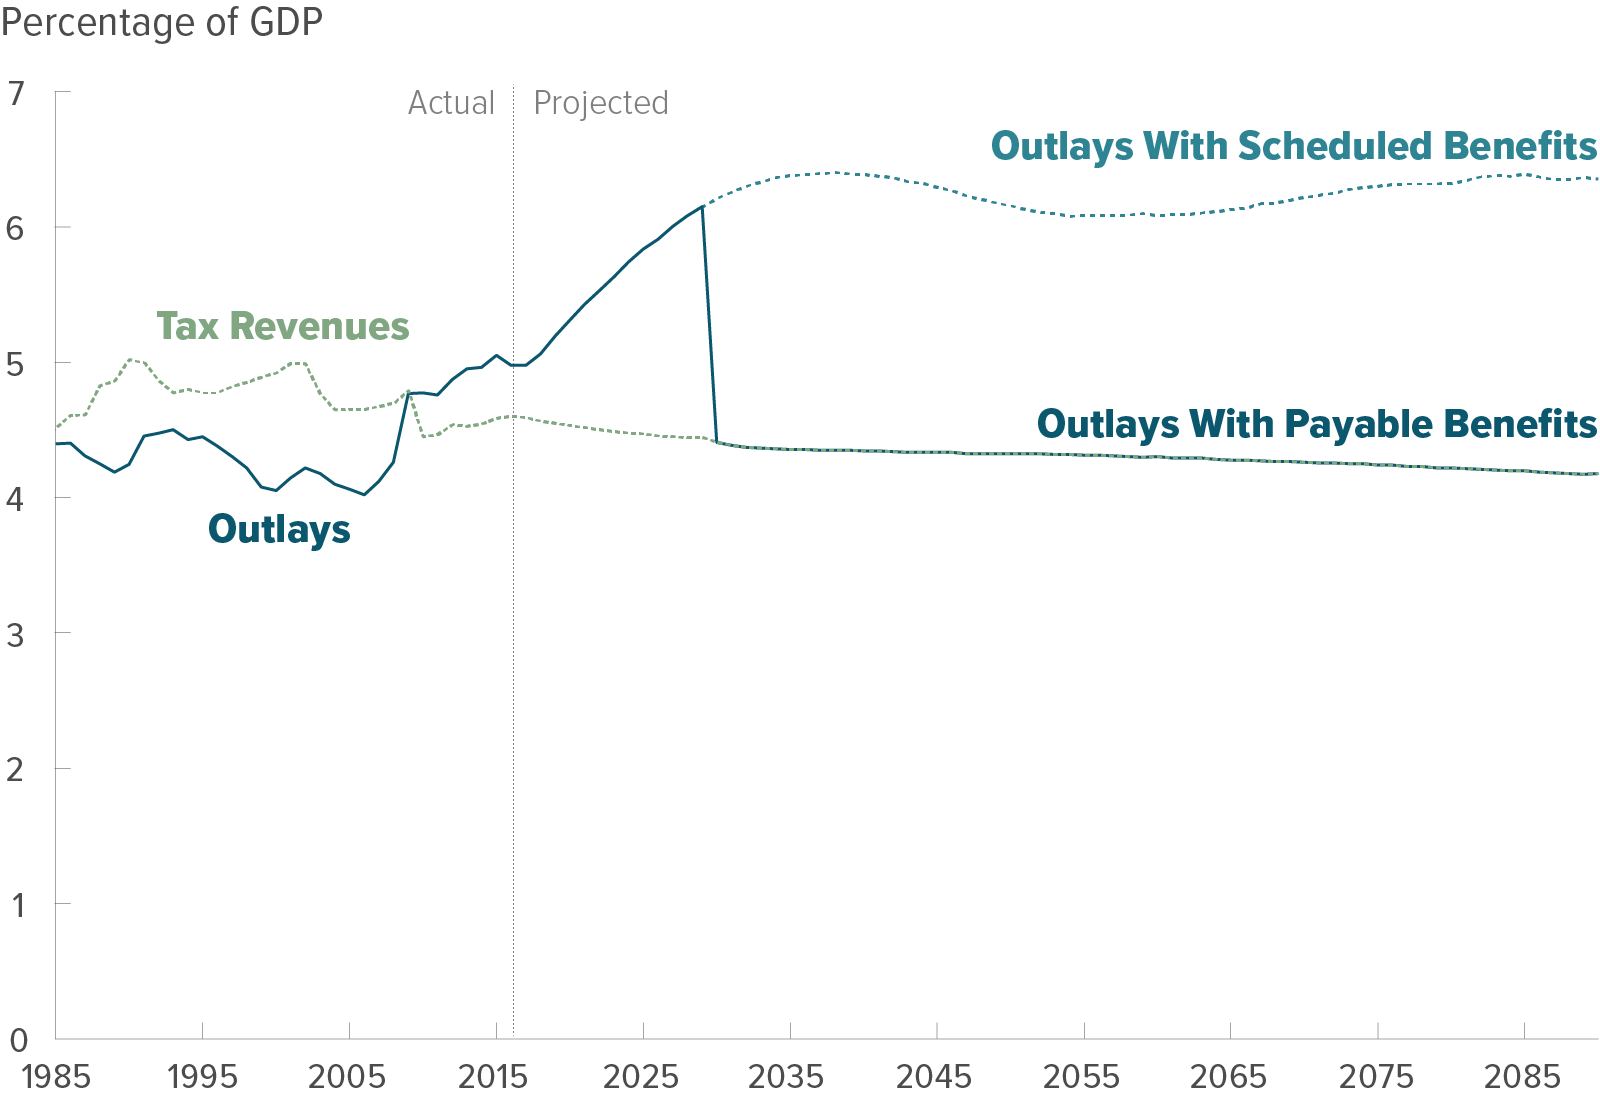
In 2010, for the first time since the enactment of the Social Security Amendments of 1983, annual outlays for the program exceeded annual revenues (excluding interest) credited to the combined OASDI trust funds. A gap between those amounts has persisted since then, and in fiscal year 2016, total outlays exceeded noninterest income by about 7 percent. As more people in the baby-boom generation retire over the next few decades and as longer life spans lead to longer retirements, that gap will widen, CBO projects. If current laws governing taxes and spending stayed the same and if benefits were paid as scheduled, outlays for the Social Security program would rise from 5.0 percent of gross domestic product (GDP) in 2016 to 5.9 percent in 2026 and to 6.3 percent in 2046; they would exceed tax revenues by 33 percent in 2026 and by 42 percent in 2046.
According to CBO’s projections, without changes in the programs, the balance of the DI trust fund will be exhausted in fiscal year 2022, the balance of the OASI trust fund will be exhausted in calendar year 2030, and the combined balances of the OASDI trust funds will be exhausted in calendar year 2029. If a trust fund’s balance declined to zero and current revenues were insufficient to cover benefits specified in law, the Social Security Administration would no longer be permitted to pay full benefits when they were due. In the years after a trust fund was exhausted, annual outlays would be limited to annual revenues: All receipts to the trust fund would be used, and the trust fund’s balance would remain essentially at zero.
The amount of Social Security taxes paid by various groups of people differs, as do the benefits that different groups receive. For example, people with higher earnings pay more in Social Security payroll taxes than do participants with lower earnings, and they also receive larger benefits. All told, Social Security’s benefit formula is progressive because replacement rates—annual benefits as a percentage of past earnings—are lower, on average, for workers who have had higher earnings. As another example, CBO projects that people who were born in more recent decades will pay more in taxes and receive more in benefits (even after an adjustment for inflation) than earlier generations because they typically will earn more over their lifetime and live longer.