
At a Glance
The federal government subsidizes health insurance for most Americans through various programs and tax provisions. The Congressional Budget Office and the staff of the Joint Committee on Taxation (JCT) regularly prepare baseline projections of the federal costs associated with each kind of subsidy and of the number of people with health insurance coverage through different sources. Those projections reflect the assumption that current laws governing taxes and spending generally remain unchanged. This report presents the latest of those projections, which, for the first time, reflect the entire population instead of only the civilian noninstitutionalized population younger than 65.
Federal Subsidies. In 2023, federal subsidies for health insurance minus certain related payments made to the federal government are estimated to be $1.8 trillion, or 7.0 percent of gross domestic product (GDP). In CBO and JCT’s projections, those net subsidies grow substantially, reaching $3.3 trillion, or 8.3 percent of GDP, in 2033. Over the 2024–2033 period, the 10 years spanned by CBO’s current baseline projections, those subsidies total $25.0 trillion, distributed as follows:
- Medicare—$11.7 trillion (47 percent),
- Medicaid and the Children’s Health Insurance Program—$6.3 trillion (25 percent),
- Employment-based coverage—$5.3 trillion (21 percent),
- Coverage obtained through the marketplaces established by the Affordable Care Act or through the Basic Health Program—$1.1 trillion (4 percent), and
- Other federal subsidies—$0.6 trillion (2 percent).
Health Insurance Coverage. Over the 2024–2033 period, an average of 315.5 million people (91.5 percent of the population) are projected to have health insurance in any given month. Employment-based coverage is the predominant source of health insurance coverage, followed by Medicaid and Medicare. In 2023, 24.3 million people (7.2 percent of the population) are estimated to be uninsured—a record low; roughly 60 percent of those people—15.2 million—are estimated to be eligible for subsidized coverage. In CBO’s projections, in 2033, the number of uninsured people rises to 29.6 million (8.4 percent of the population)—about 60 percent of whom (17.7 million) are eligible for subsidized coverage.
Notes
The estimates presented in this report underlie the Congressional Budget Office’s May 2023 baseline projections. They incorporate the effects of legislation enacted through March 30, 2023, and are based on CBO’s February 2023 economic projections, which reflect economic developments through December 6, 2022.
The population referred to in this report is the Social Security area population, which includes all residents of the 50 states and of the District of Columbia, as well as civilian residents of U.S. territories. It also includes federal civilian employees and members of the U.S. armed forces living abroad and their dependents, U.S. citizens living abroad, and noncitizens living abroad who are eligible for Social Security benefits.
Estimates of health insurance coverage reflect average monthly enrollment during a calendar year and include spouses and dependents covered under family policies. Estimates for each source of health insurance exclude people with supplemental or partial coverage that, on its own, would not provide financial protection against major medical expenses.
Federal subsidies for health insurance include both outlays (also referred to as spending in this report) and reductions in revenues incurred by the federal government to offset the costs of health insurance. Estimates do not include discretionary outlays (such as spending on veterans’ health programs) or outlays made by the federal government in its capacity as an employer (such as spending on the Federal Employees Health Benefits program and the military’s TRICARE health program).
Unless this report indicates otherwise, all years referred to in describing estimates of federal spending and revenues are federal fiscal years, which run from October 1 to September 30 and are designated by the calendar year in which they end.
Numbers may not add up to totals because of rounding.
In most states, the federal poverty guidelines (commonly known as the federal poverty level) in 2023 begin at $14,580 of income for a single person and increase by $5,140 for each additional person in a household. Those guidelines apply to modified adjusted gross income for the calendar year, which equals gross income plus untaxed Social Security benefits, foreign earned income that is excluded from adjusted gross income, tax-exempt interest, and the income of dependent filers.
The data source of all figures related to enrollment, spending on Medicaid and the Children’s Health Insurance Program, and spending on Medicare may be cited as follows: Congressional Budget Office. For all other figures, the data sources may be cited this way: Congressional Budget Office; staff of the Joint Committee on Taxation.
Most Americans’ health insurance is subsidized by the federal government, either through a program, such as Medicare or Medicaid, or through tax provisions. In this report, the latest in a regular series, the Congressional Budget Office and the staff of the Joint Committee on Taxation (JCT) present projections of what health insurance coverage and the costs to the federal government of that coverage would look like over the next 10 years if current laws governing taxes and spending generally remain unchanged. Those projections, which reflect CBO’s economic and demographic projections as well as data on health insurance enrollment and premiums, underlie CBO’s baseline budget projections.
Net federal subsidies for health insurance (that is, subsidies minus certain payments, such as Medicare premiums, amounts paid to providers and later recovered, and penalty payments) are projected to total $1.8 trillion in 2023 and $3.3 trillion in 2033. Measured as a share of gross domestic product (GDP), those subsidies are estimated to amount to 7.0 percent and 8.3 percent, respectively.
For the first time in a report in this series, CBO and JCT present projections that account for the entire population; in the agencies’ previous reports, the projections reflected only the civilian noninstitutionalized population under age 65 residing in the 50 states or the District of Columbia. CBO has expanded the scope of the series in response to questions from Members of Congress and their staff.
Overview of Federal Subsidies for Health Insurance
The federal government subsidizes health insurance coverage in four main ways (listed in descending order by the number of people affected):
- By offering tax benefits for employment-based coverage to employers and employees—namely, by excluding amounts paid for health insurance premiums from income and payroll taxes;
- By providing about two-thirds of all funding for Medicaid and the Children’s Health Insurance Program (CHIP), programs aimed at insuring people with low income and people with disabilities;
- By paying for most of the cost of coverage through the Medicare program, which insures people 65 or older and people younger than 65 who have certain disabilities or end-stage renal disease; and
- By offering tax credits to eligible people who purchase nongroup coverage through the health insurance marketplaces established under the Affordable Care Act (ACA), as well as by covering much of the cost of coverage through a Basic Health Program, which states can establish under that law.
Total Federal Subsidies for Health Insurance, 2023 and 2033

Total federal subsidies for employment-based coverage and for Medicare nearly double from 2023 to 2033 in CBO and JCT’s projections.
Measured as a percentage of GDP, federal subsidies for employment-based coverage and for Medicare are projected to rise over the next decade, while those for Medicaid and CHIP and for nongroup coverage and the Basic Health Program are projected to decrease.
Distribution of Total Federal Subsidies for Health Insurance Over the 2024–2033 Period
Trillions of Dollars
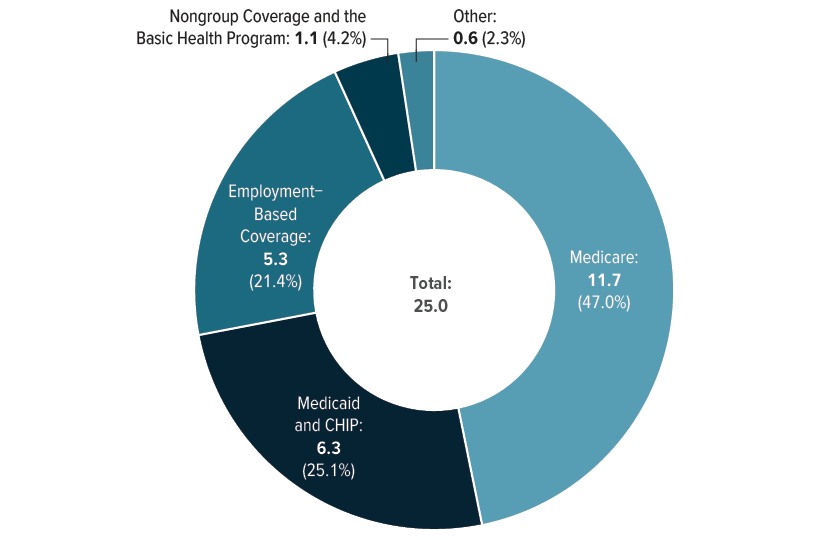
CBO and JCT project that federal subsidies for health insurance will total $25 trillion over the 2024–2033 period, the 10 years spanned by CBO’s current baseline projections. Although employment-based coverage affects the most people, Medicare accounts for nearly half of total federal subsidies for health insurance over that period. (For details of CBO and JCT’s projections of federal subsidies for health insurance, see Appendix A.)
Sources of Health Insurance
People in the United States have health insurance coverage through the following sources:
- Employment-Based Coverage. Most full-time workers and their dependents are enrolled in employment-based coverage; such workers are considerably more likely than part-time and seasonal workers to have an offer of employment-based coverage. Workers employed by large employers and workers with higher income are also more likely to have an offer of employment-based coverage.
- Medicaid and CHIP. Eligibility for Medicaid varies by state, but generally, the program covers low-income people and those with disabilities. Eligibility for CHIP also varies by state. The program covers children younger than 19 in families whose income exceeds their state’s Medicaid eligibility threshold but is still less than an upper limit, determined by the state, that is generally between 200 percent and 400 percent of the federal poverty guidelines (commonly known as the federal poverty level, or FPL). States may choose to operate their CHIP program as an expansion of Medicaid, a separate program, or a combination of those two approaches.
- Medicare. People typically become eligible for and enroll in Medicare at age 65. A small portion of Medicare enrollees are people younger than 65 who receive benefits from the Social Security Disability Insurance program or who have been diagnosed with end-stage renal disease.
- Nongroup Coverage and the Basic Health Program. People can purchase nongroup health insurance coverage in the marketplaces established under the ACA; some enrollees qualify for subsidies toward the purchase of that coverage. In addition, under the ACA, states have the option to establish a Basic Health Program intended primarily for people with income between 138 percent and 200 percent of the FPL; the federal government provides the state with funding equal to 95 percent of the marketplace subsidy for which an enrollee in the program would otherwise have been eligible. Only Minnesota and New York currently operate such a program.
- Other. Other sources of coverage include student health plans, correctional facilities, the Indian Health Service, and foreign sources of coverage.
Projected Health Insurance Coverage
To estimate the net federal cost of subsidies for health insurance, CBO projects the number of people with coverage through the different sources. Over the 2024–2033 period, an average of 315.5 million people, or 91.5 percent of the population, will have health insurance in any given month, CBO estimates. (For details of CBO’s latest projections of health insurance coverage, see Appendix A.)
CBO’s estimates for each source exclude people with supplemental or partial coverage that, on its own, would not provide financial protection against major medical expenses. In addition, to better align estimates with underlying data about coverage, the agency does not assign people reporting multiple sources of coverage to a primary source. As a result, the sum of enrollment in each source and the number of uninsured people exceeds the total population. The percentage of people 65 or older who are enrolled in coverage through multiple sources is greater than the percentage of people younger than 65 with multiple sources of coverage. For example, nearly all people age 65 or older who are enrolled in Medicaid are also enrolled in Medicare.
Health Insurance Coverage, by Age Group, 2023 and 2033
Millions of People

The size of the population younger than 65 is expected to remain roughly the same from 2023 to 2033. In CBO’s projections, enrollment in Medicaid and nongroup coverage among that population declines, and the number of people without insurance increases, as temporary policies related to the coronavirus pandemic expire under current law.
The population age 65 or older increases from 59 million people in 2023 to 73 million in 2033 in CBO’s projections. Enrollment in Medicare among that population increases by a similar amount, and the number of uninsured people remains small. Those changes reflect that age group’s high rate of enrollment in Medicare.
How Coverage for People Under Age 65 Varies Among Income Groups
The source of health insurance coverage for people younger than 65 is highly correlated with their income. Those with lower income are more likely to be uninsured than those with higher income, and when they have insurance, it is often through Medicaid or CHIP. Those with higher income are predominantly insured through employment-based coverage. To focus on how people’s source of health insurance coverage varies by income, this figure excludes people age 65 or older (nearly all of whom are covered by Medicare).
In the underlying data, some Medicaid and CHIP enrollees appear to have annual income that exceeds the programs’ upper limits. That can occur in any year when, for example, people’s income and enrollment status changed during the year and their income exceeded the eligibility thresholds when they were not enrolled in one of those programs. Further, in 2023, the number of Medicaid and CHIP enrollees with higher income is greater than normal because the provisions requiring continuous eligibility for Medicaid and CHIP enacted in the Families First Coronavirus Response Act (Public Law 116-127) kept people enrolled in those programs regardless of changes in their eligibility, including changes in income.
Health Insurance Coverage for People Under Age 65, by Income, 2023
Millions of People
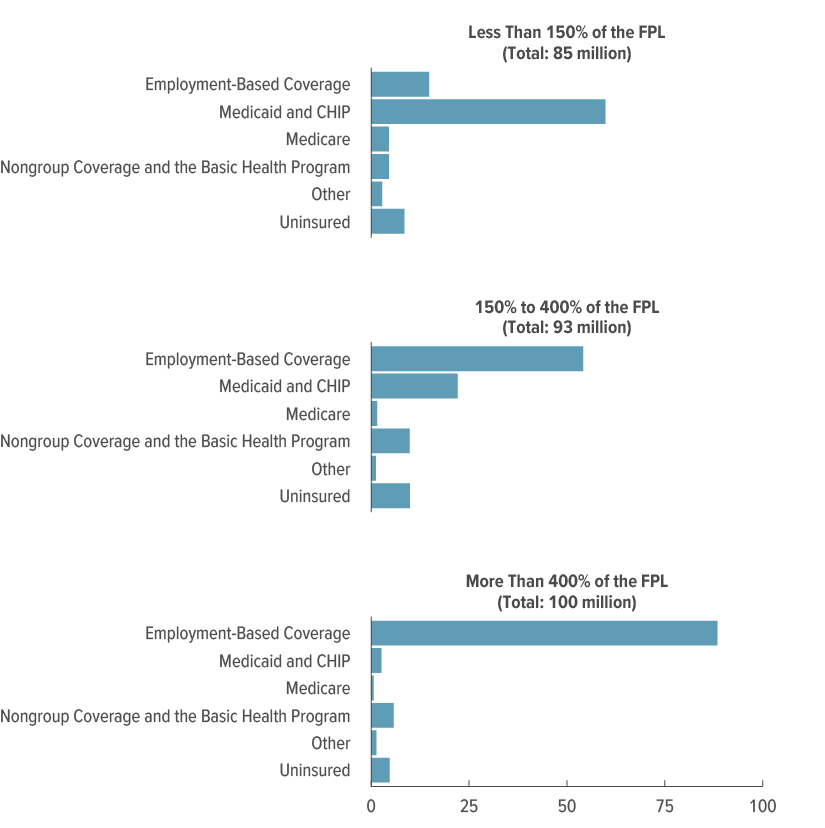
Of the 85 million people younger than 65 with income below 150 percent of the federal poverty level in 2023, an estimated 60 million are enrolled in Medicaid or CHIP.
Coverage for the 93 million people with income between 150 percent and 400 percent of the FPL is more varied because the thresholds for eligibility for Medicaid, CHIP, and subsidized nongroup coverage fall within that income range. Of that total, more than half have employment-based coverage, 22 million people are enrolled in Medicaid or CHIP, and 10 million have nongroup coverage or coverage through the Basic Health Program, CBO estimates.
Nearly all people with income above 400 percent of the FPL are enrolled in employment-based coverage.
How Coverage Varies Among Racial and Ethnic Groups
Many factors drive variation in coverage among racial and ethnic groups; employment, income, and immigration status are especially important. For example, people who are employed full time or in certain industries, such as professional services, are more likely to have access to employment-based coverage, whereas eligibility for Medicaid, CHIP, and premium tax credits is determined, in part, by income. In general, people without legal status are not eligible for subsidized health insurance and are more likely to be uninsured.
Distributions of coverage among broad racial and ethnic groups may mask considerable variation in coverage within the groups. The Asian population, for example, comprises several subgroups, such as people who identify as Asian Indian and people who identify as Korean, and those subgroups’ distributions of coverage may differ significantly from one another. (For additional details about CBO’s modeling of health insurance coverage by race and ethnicity, see Appendix B.)
Health Insurance Coverage, by Race and Ethnicity, 2023
Percent

The White and Asian populations exhibit similar employment patterns, which helps explain their high rates of employment-based coverage. Larger percentages of the other groups—Black, Hispanic, and some other race or multiracial—have coverage through Medicaid or CHIP, consistent with their lower average income. CBO estimates that about 15 percent of Hispanic people are uninsured—the largest share among the groups—in part because foreign-born people without legal status make up a larger share of that group than any other.
Average Federal Subsidies for Health Insurance
Average federal subsidies for health insurance per subsidized enrollee vary among the sources of health insurance and within the group of people enrolled in coverage through a given source. Among the sources of coverage, federal subsidies vary because of differences in the portion of the cost of coverage borne by the federal government and in the prices paid to providers. Within the group of people who share a particular source of coverage, differences in age, health status, income, and disability status may cause the average federal subsidy to differ among subgroups. For example, the average subsidy per Medicare enrollee in 2023 is $13,150 for people age 65 or older and $18,320 for people younger than 65 (who are disabled or have been diagnosed with certain medical conditions).
Average Federal Subsidy per Subsidized Enrollee, by Source of Coverage, 2023 and 2033
Dollars

From 2023 to 2033, the average federal subsidy is projected to grow for all sources of coverage. The largest subsidies are for Medicare because it covers populations that, on average, use more health care services than people with other sources of coverage and because the federal government pays for a larger portion of the costs of that coverage than it does of coverage provided through other sources.
Growth in Health Insurance Subsidies and Enrollment
Total federal subsidies for health insurance depend on the number of people enrolled in subsidized coverage and the average federal subsidy per enrollee. Differences in growth in subsidized enrollment among sources of coverage reflect differences among the groups of people who share each source of coverage. In CBO’s projections, the number of people 65 or older—nearly all of whom are covered by Medicare—grows significantly faster than the number of people younger than 65. The average subsidies for the sources of coverage grow at different rates, in part, because prices paid to providers by commercial plans tend to rise faster than those paid by public programs such as Medicare and Medicaid, whose prices are generally administratively determined.
In addition to those underlying factors, two temporary pandemic-related policies are set to expire under current law, reducing subsidized enrollment in Medicaid and CHIP and in nongroup coverage and the Basic Health Program, and slowing growth in the subsidies for insurance from those sources.
The Families First Coronavirus Response Act, enacted in March 2020, increased the federal medical assistance percentage (FMAP), the formula that determines the federal matching rates for Medicaid and CHIP, by 6.2 percentage points and 4.3 percentage points, respectively, for most enrollees in those programs for the duration of the public health emergency brought on by the pandemic. To receive the enhanced funding, states were required to provide continuous eligibility to enrollees in Medicaid and to children enrolled in CHIP through a program that is operated as an expansion of Medicaid, thereby allowing people to remain enrolled during the public health emergency regardless of changes in their eligibility. The Consolidated Appropriations Act, 2023 (P.L. 117-328), enacted in December 2022, ended the continuous eligibility provisions as of April 1, 2023, and phased down the enhanced FMAP through December 2023.
The American Rescue Plan Act of 2021 (P.L. 117-2) increased the size of marketplace subsidies for those previously eligible for them and extended eligibility to people with income of more than 400 percent of the FPL in 2021 and 2022. Those enhancements were extended through 2025 by the 2022 reconciliation act (P.L. 117-169).
Average Annual Change in Health Insurance Subsidies and Enrollment, 2023 to 2033
Percent
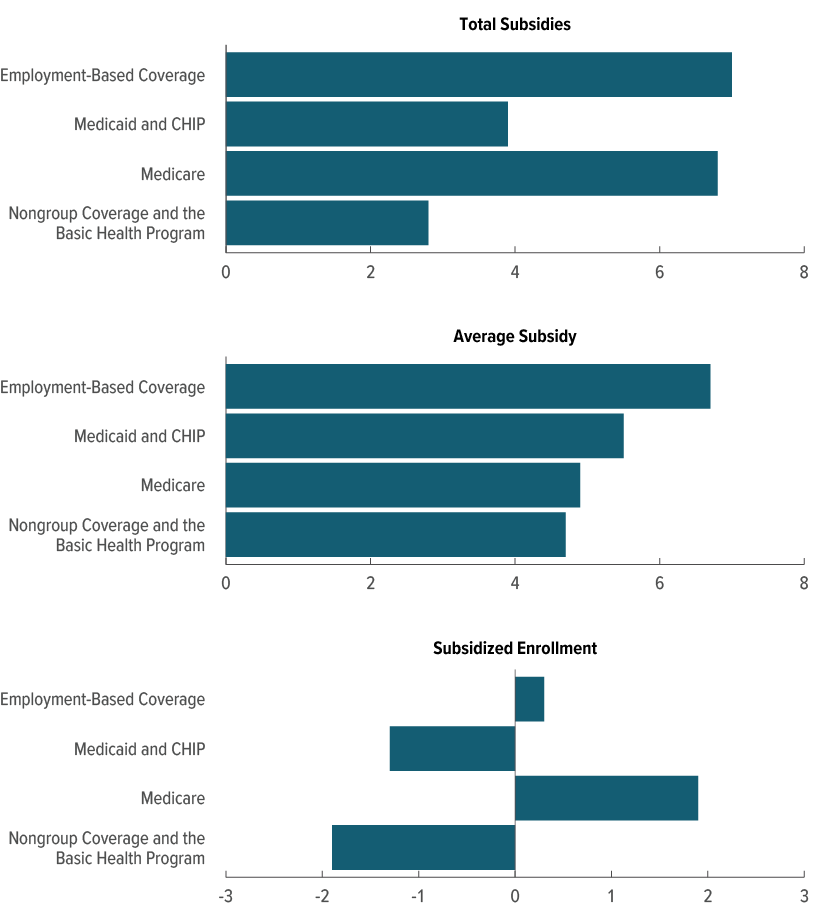
In CBO and JCT’s projections, total subsidies for employment-based coverage and for Medicare grow by an average of 7 percent per year over the 2023–2033 period. Growth in total subsidies for employment-based coverage is driven primarily by increases in the average subsidy per person that result from premium growth and scheduled increases in tax rates. Growth in total Medicare subsidies reflects average annual growth of 5 percent in the average subsidy and of 2 percent in enrollment.
Total subsidies for Medicaid and CHIP and for nongroup coverage and the Basic Health Program grow much more slowly than those for other types of coverage because enrollment in those sources declines following the expiration, in 2023, of the provisions requiring continuous eligibility in Medicaid and the scheduled expiration of the enhanced marketplace subsidies at the end of 2025.
Private Health Insurance Premiums
Total federal subsidies for employment-based and nongroup coverage depend on the total amount of premiums in those markets. Premiums for employment-based coverage are typically paid by both the employer and the employee. The employer’s portion is exempt from federal income and payroll taxes, and in most cases, the employee’s portion is as well. In general, people with higher income, and thus higher marginal tax rates, receive a larger federal subsidy for employment-based coverage.
For nongroup coverage, federal subsidies come in the form of the premium tax credit—a tax credit that eligible people can use to lower the out-of-pocket cost of their monthly premiums for health insurance coverage purchased through the ACA marketplaces. The amount of the credit is the difference between the benchmark premium in the enrollee’s geographic area and the enrollee’s maximum contribution, which is equal to a specified percentage of that person’s income.
CBO projects private health insurers’ spending on health care and administrative costs on the basis of trends in premium growth and of projected growth in personal income, which affects people’s ability to buy health insurance. From 2023 to 2033, spending per enrollee in private health insurance—the measure that private insurers use to set premiums for employment-based and nongroup coverage—is projected to grow by an average of 5 percent per year.
Annual Change in the Average Benchmark Premium and in Private Health Insuers’ Spending, 2023 to 2033
Percent
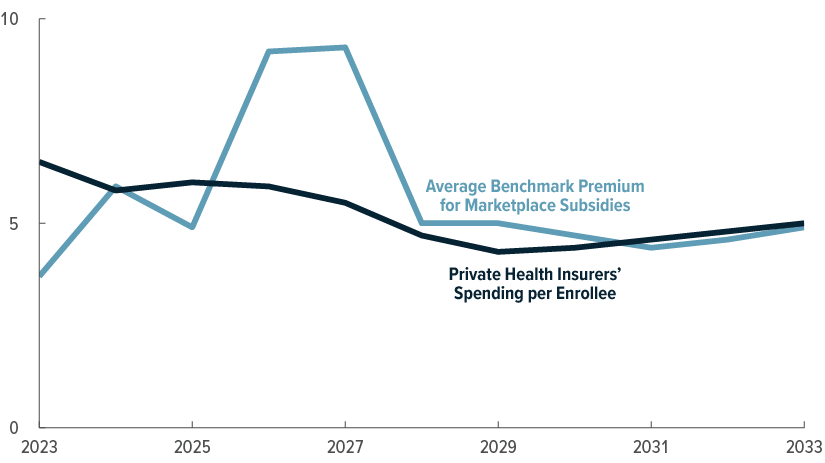
After 2025, healthier enrollees who enrolled in nongroup coverage because of the enhanced marketplace subsidies are expected to exit the market, and insurers are expected to respond by increasing premiums at a faster-than-average rate in 2026 and 2027. Thereafter, the growth of the average benchmark premium is projected to roughly follow the path of average spending per enrollee in private health insurance.
Enrollment in and Spending for Medicaid and CHIP
Both Medicaid and CHIP are jointly financed by state governments and the federal government. Before the enactment of the Affordable Care Act, which allowed states to expand Medicaid eligibility to all nondisabled adults with income less than or equal to 138 percent of the FPL, nondisabled adults could generally qualify for Medicaid only if their income was low and they had dependent children. The federal share of the cost of medical services for most Medicaid enrollees—those who would be eligible without the ACA—is specified by the FMAP. That share varies widely by state: It is larger for states with lower per-person income.
On average, the federal government pays about 60 percent of the cost of Medicaid services for Medicaid enrollees who are eligible under the pre-expansion guidelines. By contrast, the federal government’s share of costs is 90 percent for enrollees who became eligible for Medicaid under the ACA. For CHIP, the federal government pays for an average of roughly 70 percent of the cost of covered services, though, as with Medicaid, that share varies among states.
Enrollment in and Spending for Medicaid and CHIP, by Eligibility Category, 2023
Percent
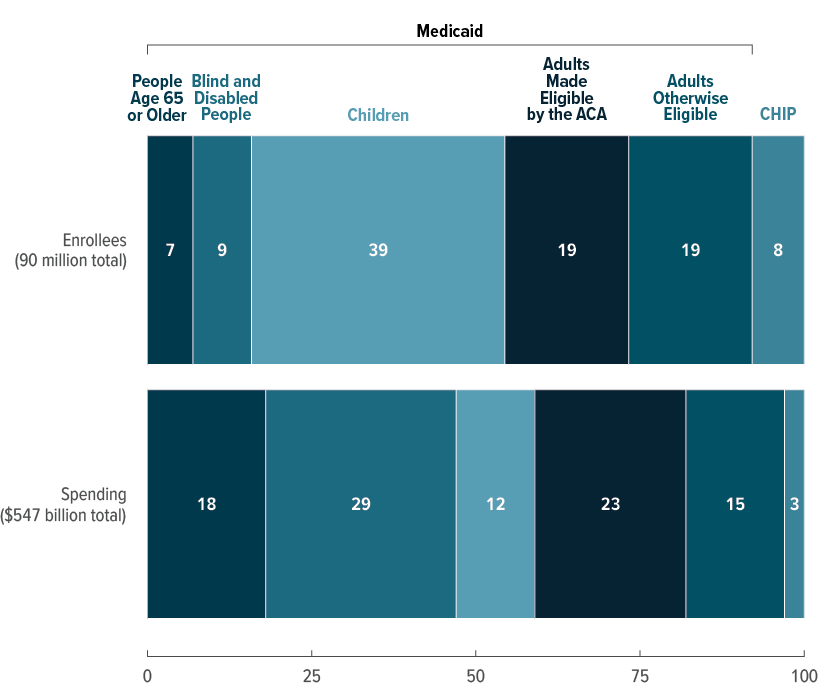
For some categories of Medicaid and CHIP enrollees, the share of enrollment differs significantly from the share of spending. For example, in CBO’s estimates, people age 65 or older and people with disabilities—whose average health care spending is higher—together account for 15 percent of enrollment and 47 percent of spending in 2023. Children—whose average health care spending is lower—account for 39 percent of Medicaid enrollment but only 12 percent of spending. The share of spending attributable to nondisabled adults younger than 65 is about the same as that group’s share of total enrollment.
Medicare Enrollment and Spending
Medicare is the federal health insurance program that provides coverage primarily for people who are 65 or older, though it also covers certain people under 65 with disabilities or end-stage renal disease. The program has three principal components: Part A (Hospital Insurance), Part B (Medical Insurance, which covers doctors’ services, outpatient care, and other medical services), and Part D (which covers outpatient prescription drugs). More than 90 percent of Medicare enrollees participate in both Part A and Part B. The remaining enrollees typically opt to receive only Part A coverage and often have an alternative source of primary coverage, such as an employment-based plan. Enrollment and spending estimates presented in this section include people enrolled in Medicare Part A, Part B, or both, whereas elsewhere in the report, estimates include only people who are enrolled in both Medicare Part A and Part B.
Medicare Advantage (sometimes referred to as Part C) allows Medicare beneficiaries to enroll in private plans for their Medicare coverage instead of the traditional Medicare fee-for-service program. Medicare Advantage plans provide the benefits covered under Parts A and B; many plans also provide Part D benefits and offer supplemental benefits to their enrollees. Those supplemental benefits may have contributed to the rapid increase in the percentage of Medicare enrollees participating in Medicare Advantage in recent years. That share has risen by roughly 2 percentage points per year since 2016, when 30 percent of Medicare enrollees were enrolled in a Medicare Advantage plan. Meanwhile, per-enrollee federal spending on supplemental benefits has grown by about 14 percent per year since 2016.
Enrollment in Medicare Advantage and the Fee-for-Service Program, 2016 to 2033
Millions of People
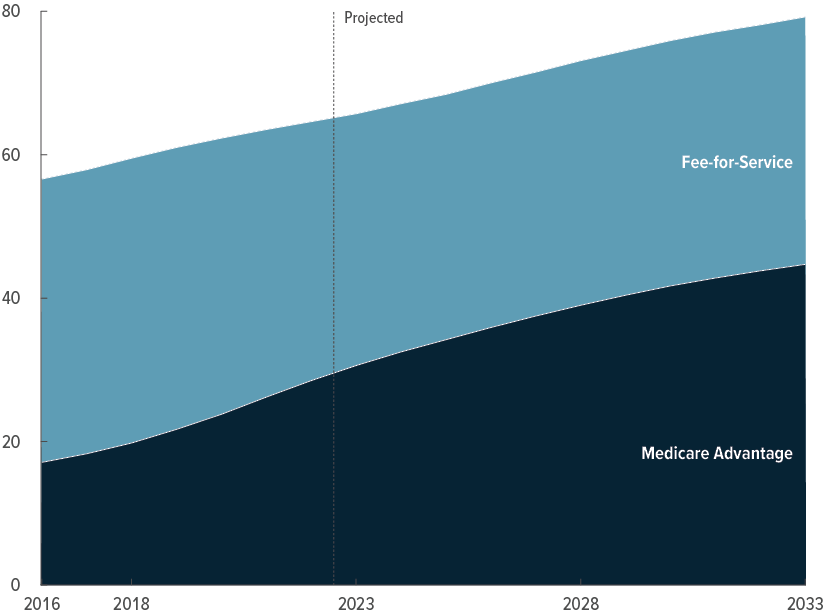
In CBO’s projections, the percentage of Medicare enrollees who opt for Medicare Advantage continues to increase over the next decade, though at a slower pace—1 percentage point per year. That share rises from 47 percent in 2023 to 56 percent in 2033. At the end of 2025, half of all Medicare enrollees are projected to be enrolled in a Medicare Advantage plan. The share of people enrolled in both Part A and Part B who participate in Medicare Advantage is projected to exceed the 50 percent mark even sooner—at the end of 2023.
Spending on Medicare Part A and Part B Services Through Medicare Advantage and the Fee-for-Service Program, 2016 to 2033
Trillions of Dollars
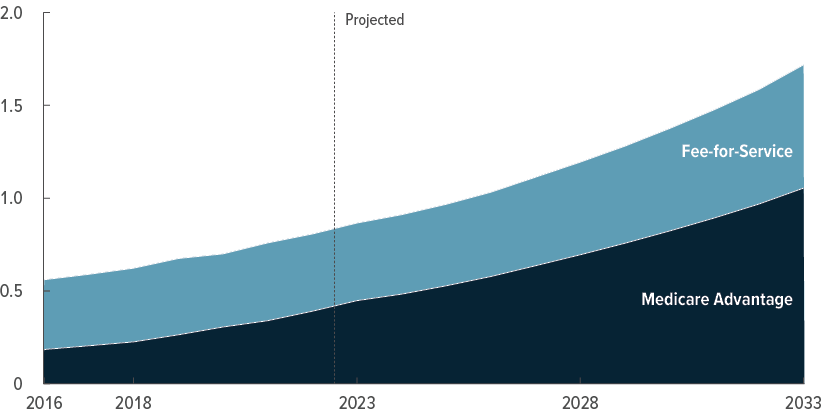
From 2023 to 2033, Medicare Advantage enrollees’ share of all Medicare spending on Part A and Part B services increases from 52 percent to 61 percent in CBO’s projections.
The Uninsured Population
CBO considers people uninsured if they are not covered by an insurance plan or enrolled in a government program that provides financial protection against major medical expenses.
Many uninsured people receive some health care and often are not required to pay the full cost of that care, but they have substantially less access to care and financial protection than do insured people. Uninsured people who are eligible for Medicaid have more financial protection than others because they can enroll throughout the year—in some cases, as they are seeking care in hospitals or other settings—and may receive coverage retroactively. In addition, CBO considers people who are enrolled only in Medicare Part A or Part B to be uninsured, but those people have some financial protection because they receive coverage for inpatient hospital services (if enrolled only in Part A) or nonhospital services, such as physician services (if enrolled only in Part B).
To describe the composition of the uninsured population, CBO classified people who lack insurance into mutually exclusive groups on the basis of the most heavily subsidized option available to them or the primary reason they were ineligible for subsidized coverage. Some uninsured people may be eligible for multiple sources of coverage.
Percentage of the Total Population That Is Uninsured, 2023 to 2033
Percent
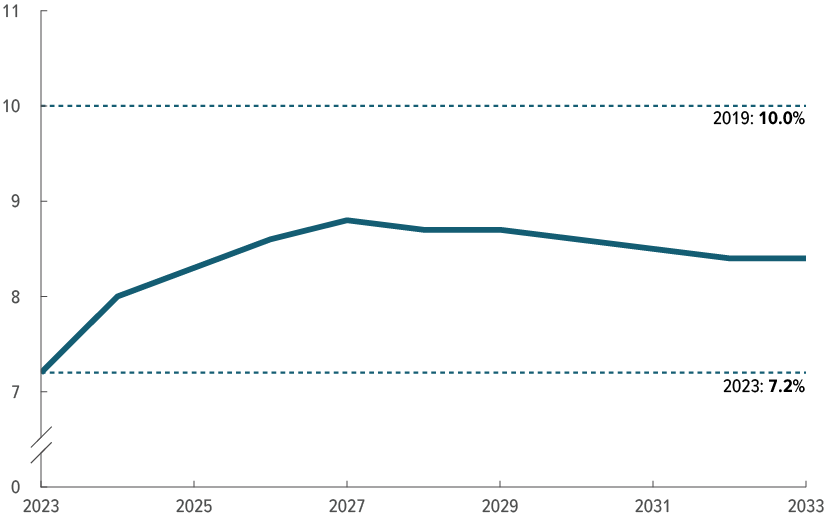
In 2023, 7.2 percent of the population is estimated to be uninsured—less than the estimated 10.0 percent in 2019, the last year before the pandemic and the federal policy changes that were enacted in response to it. Over the 2023–2027 period, the percentage of people who do not have health insurance is projected to increase as those temporary policies expire. In 2033, 8.4 percent of the population is uninsured in CBO’s projections.
Composition of the Uninsured Population, 2023 and 2033
Millions of People
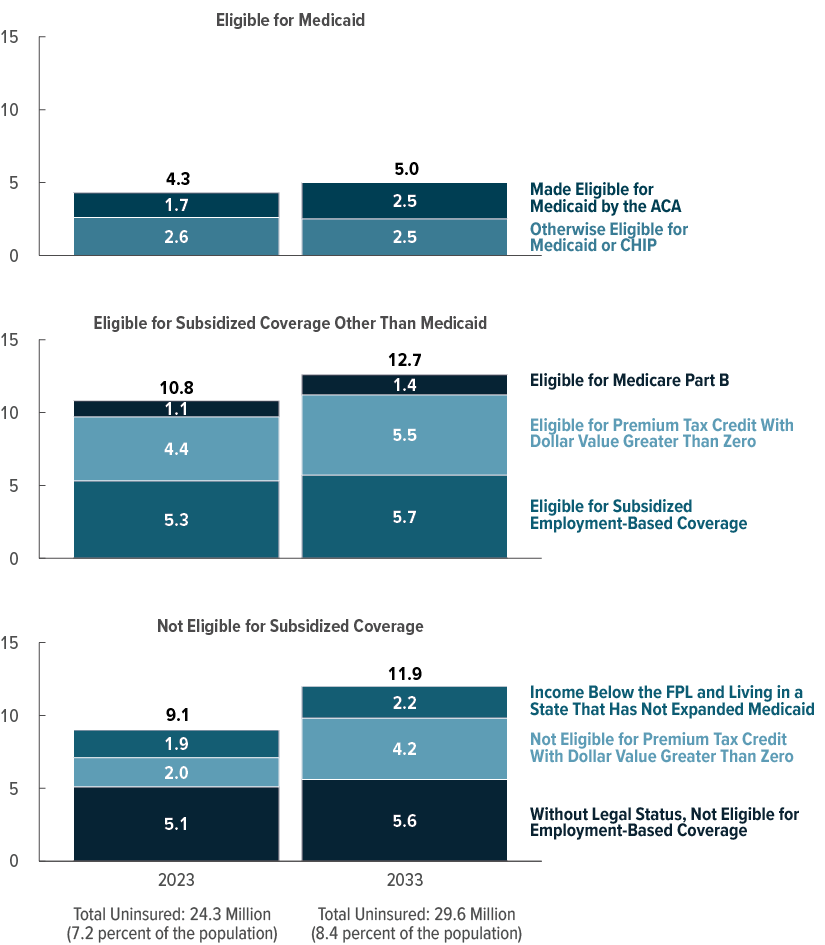
In 2023, 15.2 million of the 24.3 million people who are uninsured are eligible for subsidized coverage, CBO estimates. The source of subsidized coverage for which the largest number of those people are eligible is employment-based coverage. In CBO’s projections, the number of uninsured people eligible for subsidized coverage increases to 17.7 million in 2033, in part because of the expiration of temporary policies.
In 2023, CBO estimates, 9.1 million uninsured people are ineligible for subsidized coverage. Most of those people are without legal status and are not eligible for employment-based coverage. In 2033, the number of uninsured people ineligible for subsidized coverage increases to 11.9 million, primarily because the number of uninsured people with income too high for marketplace subsidies rises over the next decade.
Appendix ADetails of CBO and JCT’s Projections of Health Insurance Coverage and Federal Subsidies
The tables in this appendix show the Congressional Budget Office and the staff of the Joint Committee on Taxation’s current projections of health insurance coverage and of federal subsidies for health insurance for each year from 2023 to 2033. Those projections were produced in May 2023. For the projections of health insurance coverage, see Table A-1; for the projections of net federal subsidies for health insurance, see Table A-2.
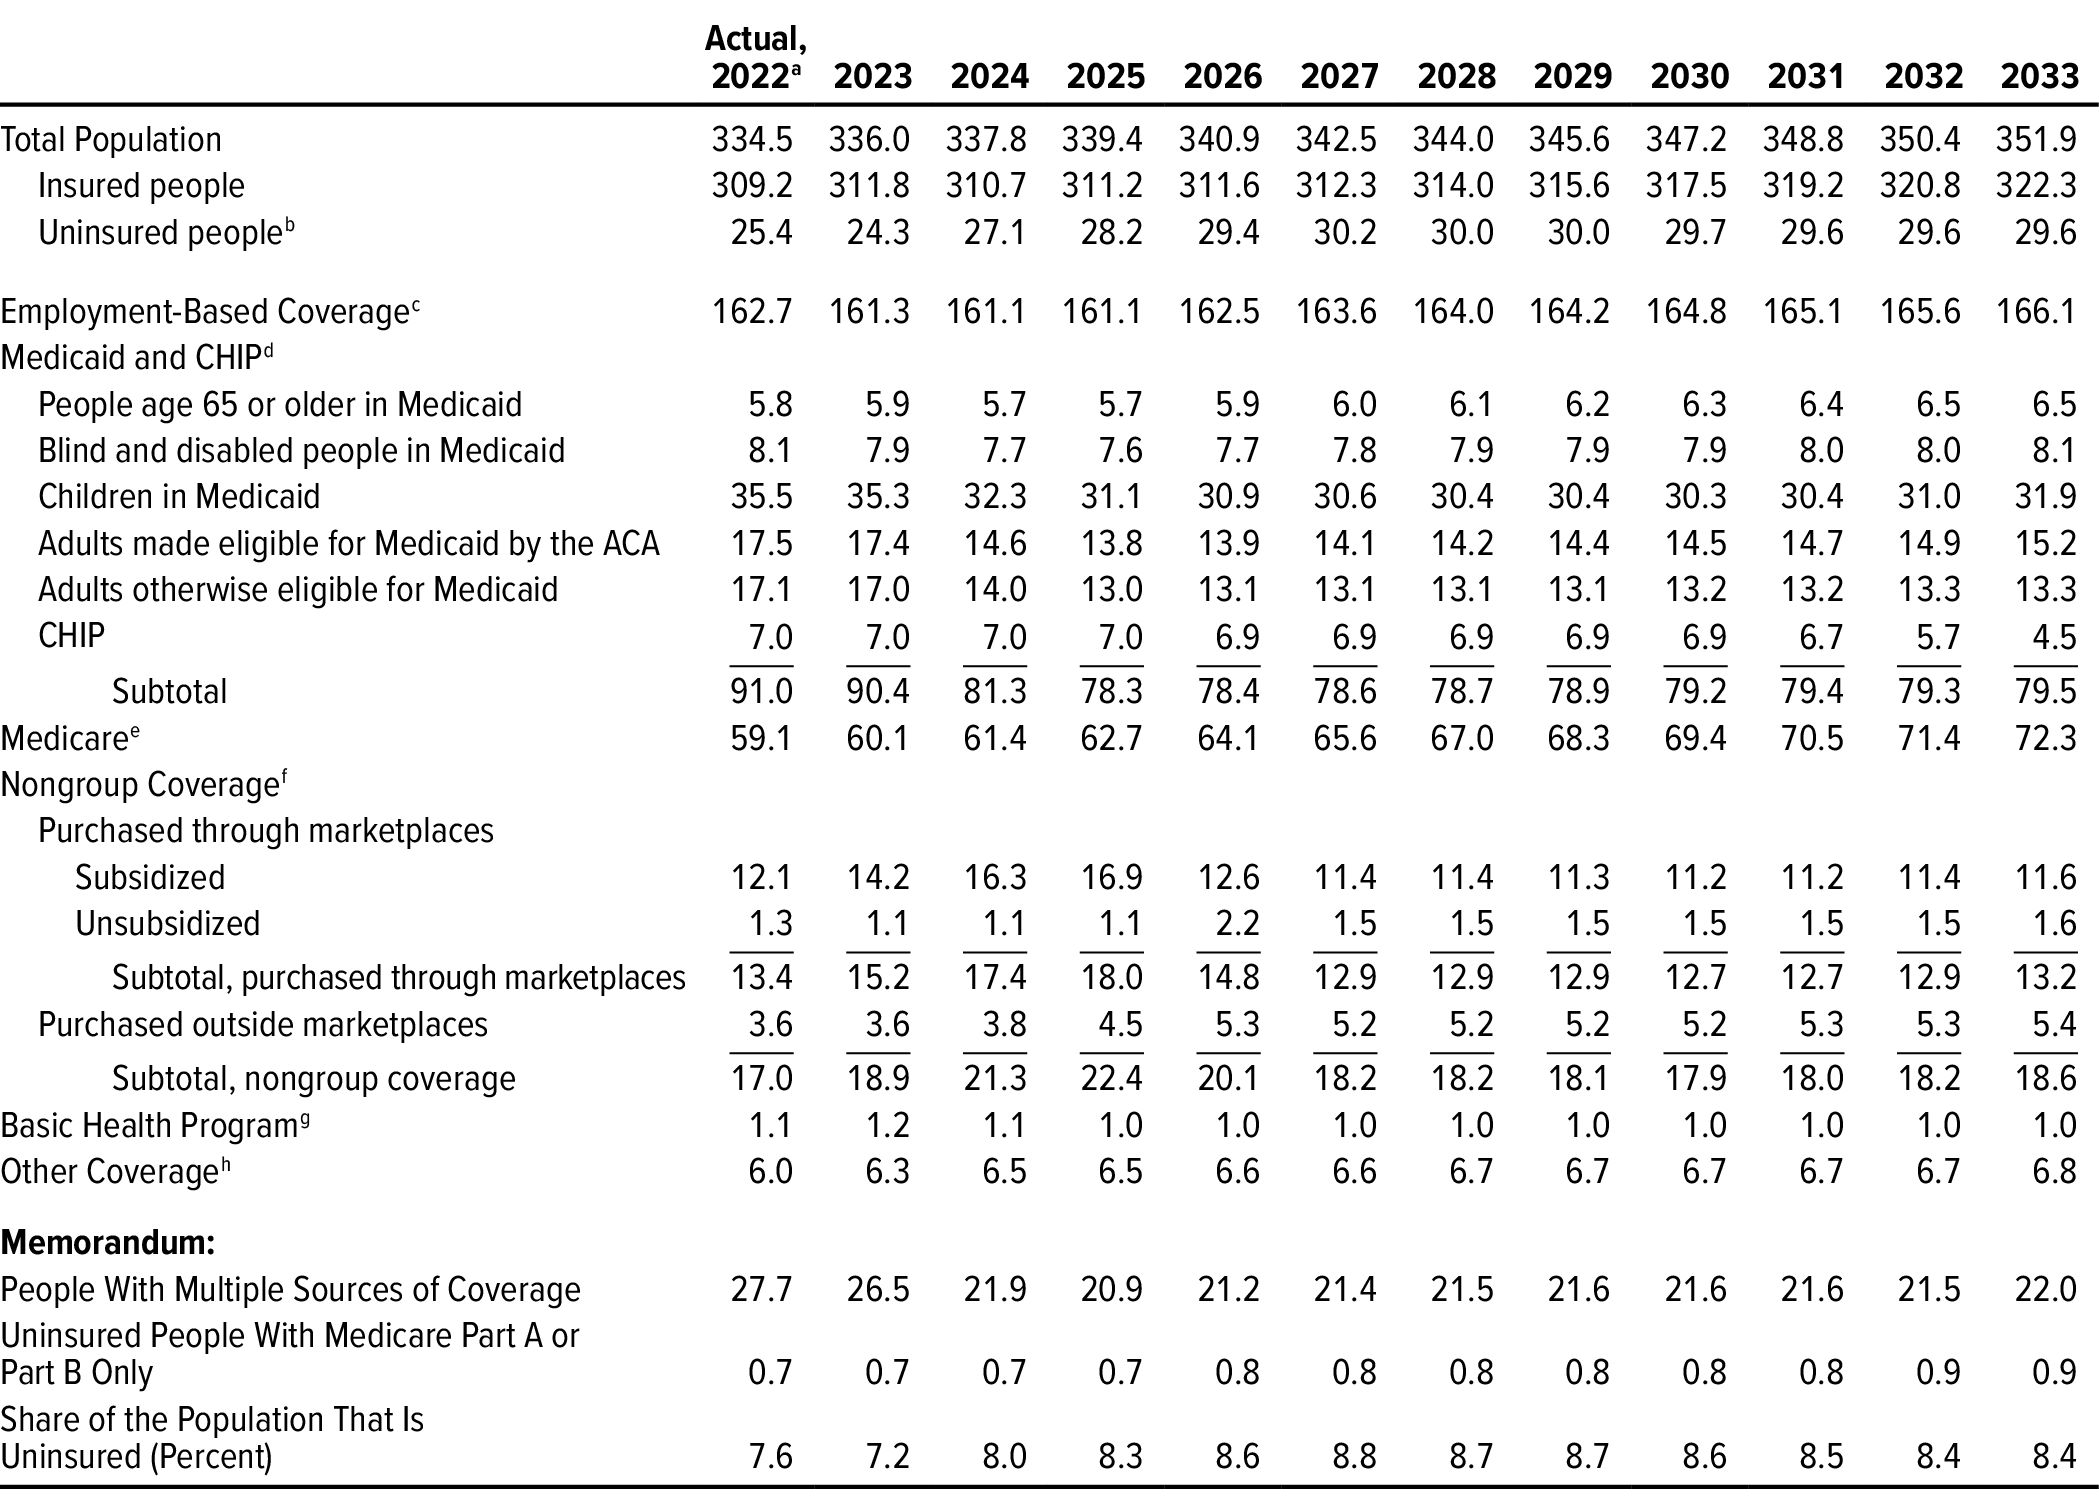
Table A-1.
CBO’s Projections of Health Insurance Coverage, by Source
Millions of People, by Calendar Year
Data source: Congressional Budget Office. See www.cbo.gov/publication/59273#data.
The table shows coverage for the Social Security area population. Estimates reflect average monthly enrollment over the course of a year and include spouses and dependents covered under family policies. Estimates for each source of health insurance exclude people with supplemental or partial coverage that, on its own, would not provide financial protection against major medical expenses and thus would not meet CBO’s definition of health insurance. For a fuller discussion, see Appendix B. The components exceed the total population because some people report multiple sources of coverage and CBO did not assign them to a primary source.
ACA = Affordable Care Act; CHIP = Children’s Health Insurance Program.
a. Actual amounts are estimated on the basis of preliminary data and are subject to revision.
b. CBO considers people uninsured if they are not covered by an insurance plan or enrolled in a government program that provides financial protection from major medical expenses. Estimates include people enrolled only in Medicare Part A or Part B, people receiving only partial Medicaid benefits, and people enrolled in some short-term plans.
c. Does not include people with Medicare wraparound coverage provided through a former employer.
d. Medicaid enrollment includes only enrollees with full program benefits. Estimates have been adjusted to account for people enrolled in more than one state.
e. Includes only people who are enrolled in both Medicare Part A and Part B.
f. Many people can purchase subsidized health insurance coverage through the marketplaces established under the ACA, which are operated by the federal government, state governments, or partnerships between the federal and state governments. Estimates do not include enrollees in supplemental Medigap plans.
g. Created under the ACA, the Basic Health Program allows states to establish a coverage program primarily for people with income between 138 percent and 200 percent of the federal poverty guidelines. The federal government provides states with funding equal to 95 percent of the subsidies for which those people would otherwise have been eligible through a marketplace. Only Minnesota and New York currently operate such a program.
h. The other sources that cover the most people are student health plans (3 million) and correctional facilities (2 million). The Indian Health Service and foreign sources of coverage account for most of the remaining people in this category.
Table A-2.
CBO and JCT’s Projections of Net Federal Subsidies for Health Insurance
Billions of Dollars, by Fiscal Year

Data sources: Congressional Budget Office; staff of the Joint Committee on Taxation. See www.cbo.gov/publication/59273#data.
The table shows federal subsidies for the Social Security area population. Estimates do not include discretionary outlays (such as spending on veterans’ health programs) or outlays made by the federal government in its capacity as an employer (such as spending on the Federal Employees Health Benefits program).
Positive numbers indicate an increase in the deficit, and negative numbers indicate a decrease in the deficit.
ACA = Affordable Care Act; CHIP = Children’s Health Insurance Program; GDP = gross domestic product; JCT = Joint Committee on Taxation; n.a. = not available or not applicable; * = less than $500 million.
a. Actual amounts are estimated on the basis of preliminary data and are subject to revision.
b. The estimates shown, produced by JCT, reflect the tax value of the exclusion of employment-based health insurance from federal income and payroll taxes, as well as the penalty payments by employers, but not the tax value of the exclusion associated with Medicare wraparound coverage for former employees. The tax value represents the change in tax revenues that would result if the exclusion from federal income and payroll taxes was repealed and the total compensation paid by the employer (including the employer’s payroll taxes) remained constant through increases in wages. Those estimates differ from estimates of the tax expenditure for the exclusion, which represent the change in tax revenues if the amount of excluded compensation was taxed and was larger than the tax value.
c. Includes increases in outlays and reductions in revenues.
d. Excludes the associated effects on revenues of changes in taxable compensation, which are included in the estimates of the tax exclusion for employment-based insurance. If those effects were included, net revenues from penalty payments by employers would total $8 billion over the 10-year period.
e. For Medicaid, estimates reflect spending for medical services only for those enrollees who have full Medicaid benefits.
f. Spending for Medicare beneficiaries enrolled in both Part A and Part B. Estimates include Part D benefits, are calculated net of premiums and certain other payments to the government, and have been adjusted to exclude the effects of shifts that occur in the timing of monthly payments when October 1 (the first day of the fiscal year) falls on a weekend.
g. Under section 1332 of the ACA, states may apply for waivers from some of the rules governing insurance markets or programs offering health insurance established by the ACA. To obtain a waiver, a state’s proposal must be budget neutral and provide comparable levels of insurance coverage.
h. Includes federal subsidies for people with supplemental or partial coverage that, on its own, would not provide financial protection against major medical expenses and thus would not meet CBO’s definition of health insurance. Includes the tax value of the exclusion associated with Medicare wraparound coverage provided to former employees, Medicare spending on enrollees who receive only Part A or Part B benefits, and Medicaid spending on enrollees who receive partial benefits, such as beneficiaries who are also eligible for Medicare for whom Medicaid pays only Medicare premiums or cost sharing.
Appendix BData and Methods Underlying CBO’s Projections of Health Insurance Coverage
To prepare its projections of overall health insurance coverage and detailed breakdowns of such coverage by race and ethnicity and by income, the Congressional Budget Office uses administrative and survey data from many sources as inputs to several models that it has developed. This appendix describes those data and the methods that CBO uses to produce its projections.
Projections of Overall Health Insurance Coverage
This report is the first publication by CBO and the Joint Committee on Taxation (JCT) that presents projections of health insurance coverage and federal subsidies for the entire population. The estimates are for the Social Security area population, which is the population used to project Social Security payroll taxes and benefits.1 This analysis expands on previously published reports by including people 65 or older, residents of the U.S. territories, members of the armed forces on active duty, people who reside in an institution (such as a correctional institution or a residential nursing or mental health care facility), federal civilian employees and other U.S. citizens living overseas, and noncitizens living abroad who are eligible for Social Security benefits.2
CBO’s projections for each source of health insurance exclude people with supplemental or partial coverage that, on its own, would not provide financial protection against major medical expenses.3 Specifically, the projections of Medicare enrollment do not include people enrolled in only Medicare Part A or only Medicare Part B, the projections of nongroup enrollment exclude enrollees in supplemental Medigap plans, the projections of enrollment in employment-based coverage do not include people with Medicare wraparound coverage provided through a former employer, and the projections of Medicaid enrollment exclude people who receive partial Medicaid benefits (such as beneficiaries who are also eligible for Medicare, for whom Medicaid pays only Medicare premiums or cost sharing).
CBO combines output from multiple models to produce projections of health insurance coverage for the Social Security area population. Those models are updated at least annually to incorporate the most recent survey and administrative data on enrollment, premiums, and spending; the effects of recently enacted legislation, judicial decisions, and regulatory changes; and CBO’s most recent macroeconomic and demographic forecasts.4 Projections of health insurance coverage for the Social Security area population comprise projections for three smaller populations: the civilian noninstitutionalized population younger than 65, the rest of the population younger than 65, and people age 65 or older.
The Civilian Noninstitutionalized Population Younger Than 65
Over the 2023–2033 period, an average of 271 million civilian noninstitutionalized people younger than 65 will reside in the 50 states and Washington, D.C., CBO estimates. To project that population’s health insurance coverage, the agency primarily relies on its health insurance simulation model, known as HISIM2.5 The agency augments estimates from HISIM2 with estimates from other models, such as JCT’s tax models and its own Medicaid and Medicare models.6
The Rest of the Population Younger Than 65
CBO estimates that over the 2023–2033 period, an average of between 6 million and 7 million people younger than 65 will live in U.S. territories, serve on active duty in the armed forces, reside in correctional facilities or other institutions, be federal civilian employees or other U.S. citizens living overseas, or be noncitizens living overseas who are eligible for Social Security benefits. To produce that estimate, CBO subtracted its projections of the civilian noninstitutionalized population from its projections of the Social Security area population younger than 65.
The agency then used data from the Census Bureau, the Centers for Disease Control and Prevention, the Department of Defense, and the Social Security Administration to estimate the relative size of each subpopulation. In some cases, CBO assigned one health insurance coverage source to an entire subpopulation. Specifically, employment-based coverage was assigned to members of the armed forces on active duty and to federal civilian employees and their dependents living overseas, and “other” coverage was assigned to other people living overseas and to people residing in correctional facilities.7 CBO used a combination of data from the American Community Survey, the Centers for Medicare & Medicaid Services’ Transformed Medicaid Statistical Information System, the Medicare Current Beneficiary Survey, the Medicare Beneficiary Summary File, and the Health Coverage PortalTM by Mark Farrah Associates to estimate the distribution of health insurance coverage for the remaining subpopulations.
People Age 65 or Older
Over the 2023–2033 period, CBO estimates, the Social Security area population will include an average of 66 million people who are age 65 or older. Most people in that age group will be enrolled in Medicare, including nearly all of those who are enrolled in Medicaid. CBO’s projections of Medicare and Medicaid enrollment are based on administrative data. To project the number of people age 65 or older who have employment-based coverage, the agency uses HISIM2 and makes minor adjustments to the model’s output to account for populations that the model does not simulate. The number of people with nongroup coverage is projected using the Health Coverage Portal, the number of people with other coverage is projected using HISIM2 and data from the Census Bureau and Social Security Administration, and the uninsured population is projected using data from the National Health Interview Survey conducted by the National Center for Health Statistics, which is a part of the Centers for Disease Control and Prevention.
The sum of the projections of enrollment in coverage through each source and the projections of the number of uninsured people exceeds the projections of the total population. That overcount occurs because CBO does not assign people with multiple sources of coverage to a primary source. The agency’s approach better aligns the projections with administrative and survey data and with the federal budgetary effects reported in administrative data than would assigning such people to a single category.
Detailed Projections of Health Insurance Coverage by Race and Ethnicity and by Income
CBO has recently developed the capacity to project health insurance coverage for different racial and ethnic groups with HISIM2. To do so, the agency uses data about the civilian noninstitutionalized population younger than 65 from the Annual Social and Economic Supplement of the Current Population Survey; those data include race and ethnicity as reported by survey respondents. CBO groups people into categories on the basis of how they self-identify in that survey. People who report Hispanic ethnicity are categorized as Hispanic, and people who identify solely as Asian, Black, or White are grouped into those categories. People who identify as some other race—American Indian, Alaska Native, or Hawaiian/Pacific Islander, for example—or as multiracial are grouped together in a single category.
CBO compares the coverage statistics for racial and ethnic groups that HISIM2 generates with the best available estimates from survey and administrative data (including the American Community Survey and Medicaid claims data), investigates any significant discrepancies, and then modifies the model’s output to bring its coverage estimates for racial and ethnic groups closer to the estimates from those other sources. HISIM2’s estimates are further augmented in two significant ways: Estimates of the racial and ethnic composition of the population age 65 or older are derived largely from the Medicare Current Beneficiary Survey, and corresponding estimates for the population in correctional facilities (a group that falls outside the scope of HISIM2) are derived from data from the Bureau of Justice Statistics.
Projections of health insurance coverage for different income groups in the population under 65 are, like those for different racial and ethnic groups, calculated largely by using the projected income distribution from HISIM2. That distribution is based on income reported by respondents to the Current Population Survey, with adjustments to better match tax data. It is extended over the projection period in a way that is consistent with CBO’s macroeconomic forecast. For subpopulations not covered by HISIM2, CBO considered whether the income distributions of people with different sources of coverage within those subpopulations would be distinct from HISIM2’s estimates of the distribution for the noninstitutionalized civilian population under age 65. For example, for people younger than 65 in correctional facilities, CBO relied on research from the Brookings Institution and the Prison Policy Initiative.8
1. CBO also uses the Social Security area population for its demographic projections. For more information about those projections, see Congressional Budget Office, The Demographic Outlook: 2023 to 2053 (January 2023), www.cbo.gov/publication/58612.
2. Previous projections were limited to the civilian noninstitutionalized population younger than 65 residing in the 50 states or Washington, D.C. For those past projections, see Congressional Budget Office, “Details About Baseline Projections for Selected Programs: Federal Subsidies for Health Insurance,” www.cbo.gov/publication/51298.
3. For more information about how CBO defines health insurance coverage, see Congressional Budget Office, Health Insurance Coverage for People Under Age 65: Definitions and Estimates for 2015 to 2018 (April 2019), www.cbo.gov/publication/55094.
4. For CBO’s latest macroeconomic and demographic forecasts, see Congressional Budget Office, The Budget and Economic Outlook: 2023 to 2033 (February 2023), www.cbo.gov/publication/58848, and The Demographic Outlook: 2023 to 2053 (January 2023), www.cbo.gov/publication/58612.
5. For details about HISIM2, see Caroline Hanson and others, “Health Insurance for People Younger Than Age 65: Expiration of Temporary Policies Projected to Reshuffle Coverage, 2023–33,” Health Affairs, vol. 42, no. 6 (May 2023), Appendix, www.healthaffairs.org/doi/suppl/10.1377/hlthaff.2023.00325.
6. For more information, see Congressional Budget Office, How CBO and JCT Analyze Major Proposals That Would Affect Health Insurance Coverage (February 2018), www.cbo.gov/publication/53571; and Joint Committee on Taxation, Estimating Changes in the Federal Individual Income Tax: Description of the Individual Tax Model, JCX-75-15 (April 23, 2015), www.jct.gov/publications/2015/jcx-75-15/.
7. Consistent with its definition of health insurance coverage, CBO determined how to classify the coverage of people residing in correctional facilities by first considering the extent to which they bear health care costs. In its analysis, CBO found that most of the cost of care is paid by state or local governments, contracted vendors, or a combination of the two, so incarcerated people appear to be largely protected from the full cost of the care they receive. Thus, CBO classified them as having “other” coverage rather than as being uninsured. For more information about the coverage of people in correctional facilities, see Kil Huh and others, State Prisons and the Delivery of Hospital Care: How States Set Up and Finance Off-Site Care for Incarcerated Individuals (Pew Charitable Trusts, July 2018), https://tinyurl.com/ac3ffnvd.
8. See Adam Looney and Nicholas Turner, Work and Opportunity Before and After Incarceration (Brookings Institution, 2018), https://tinyurl.com/4tp8mttz; and Bernadette Rabuy and Daniel Kopf, Detaining the Poor: How Money Bail Perpetuates an Endless Cycle of Poverty and Jail Time (Prison Policy Initiative, May 2016), www.prisonpolicy.org/reports/incomejails.html.
Appendix CRelated Publications
For details about the methods underlying the Congressional Budget Office’s projections of health insurance coverage, see Congressional Budget Office, “HISIM2: The Health Insurance Simulation Model Used in Preparing CBO’s July 2021 Baseline Budget Projections” (July 2021), www.cbo.gov/publication/57205; and Jessica Banthin and others, Sources and Preparation of Data Used in HISIM2—CBO’s Health Insurance Simulation Model, Working Paper 2019-04 (Congressional Budget Office, April 2019), www.cbo.gov/publication/55087.
For details about the coverage of the civilian noninstitutionalized population under age 65, see Caroline Hanson and others, “Health Insurance for People Younger Than Age 65: Expiration of Temporary Policies Projected to Reshuffle Coverage, 2023–33,” Health Affairs, vol. 42, no. 6 (May 2023), pp. 742–752, https://doi.org/10.1377/hlthaff.2023.00325.
For CBO and the staff of the Joint Committee on Taxation’s (JCT’s) projections of federal subsidies for health insurance for the civilian noninstitutionalized population under age 65, see Congressional Budget Office, “Details About Baseline Projections for Selected Programs: Federal Subsidies for Health Insurance” (May 2023), www.cbo.gov/publication/51298.
For CBO’s estimates of federal spending on Medicare, see Congressional Budget Office, “Details About Baseline Projections for Selected Programs: Medicare” (May 2023), www.cbo.gov/publication/51302.
For CBO’s estimates of federal spending on Medicaid, see Congressional Budget Office, “Details About Baseline Projections for Selected Programs: Medicaid” (May 2023), www.cbo.gov/publication/51301.
For a discussion of how prices under private health insurance plans compare with those under Medicare, see Congressional Budget Office, The Prices That Commercial Health Insurers and Medicare Pay for Hospitals’ and Physicians’ Services (January 2022), www.cbo.gov/publication/57422.
For a discussion of how CBO and JCT project health insurance premiums, see Congressional Budget Office, Private Health Insurance Premiums and Federal Policy (February 2016), pp. 9–11, www.cbo.gov/publication/51130.
For a discussion of how CBO defines health insurance coverage and the uninsured population, see Congressional Budget Office, Health Insurance Coverage for People Under Age 65: Definitions and Estimates for 2015 to 2018 (April 2019), www.cbo.gov/publication/55094.
For details about the uninsured population in 2019, see Congressional Budget Office, Who Went Without Health Insurance in 2019, and Why? (September 2020), www.cbo.gov/publication/56504.
About This Document
Each year, the Congressional Budget Office issues a series of publications describing its projections of the federal budget. This report provides background information that helps explain some of the projections in the most recent of those publications and also provides updated estimates. In keeping with CBO’s mandate to provide objective, impartial analysis, the report makes no recommendations.
Jessica Hale and Emily Vreeland prepared the report with guidance from Sarah Masi. Daniel Crown, Noelia Duchovny, Stuart Hammond (formerly of CBO), Caroline Hanson, Christian Henry (formerly of CBO), Nianyi Hong, Ben Hopkins, Claire Hou, Brian Klein-Qiu (formerly of CBO), Robert Lindsay, Sean Lyons, Eamon Molloy, Romain Parsad, Allison Percy, Asha Saavoss, Sarah Sajewski, Robert Stewart, Carolyn Ugolino, Joshua Varcie, Katie Zhang, Chris Zogby, Noah Zwiefel, and the staff of the Joint Committee on Taxation contributed to the analysis. Christina Hawley Anthony, Chad Chirico, Carrie H. Colla (formerly of CBO), Sean Dunbar, Tamara Hayford, Paul Masi (formerly of CBO), John McClelland, Alexandra Minicozzi, Shannon Mok, Emily Stern, Julie Topoleski, and Chapin White offered comments. Robert Lindsay, Julianna Mack, and Katie Zhang fact-checked the report.
Jeffrey Kling and Robert Sunshine reviewed the report. Bo Peery edited it, and Casey Labrack and R. L. Rebach created the graphics. R. L. Rebach also designed the cover and prepared the text for publication. The report is available at www.cbo.gov/publication/59273.
This report is dedicated to the memory of Kate Fritzsche-Peterson, a beloved former colleague.
CBO seeks feedback to make its work as useful as possible. Please send comments to communications@cbo.gov.

Phillip L. Swagel
Director
September 2023