
Projections at a Glance
The Federal Budget
The deficit increases significantly in relation to gross domestic product (GDP) over the next 30 years, reaching 8.5 percent of GDP in 2054. That growth results from rising interest costs and large and sustained primary deficits, which exclude net outlays for interest. Primary deficits are especially large given the forecast of low unemployment rates; those deficits average 0.6 percentage points of GDP more over the next 30 years than they did over the past 50 years.
Debt held by the public, boosted by the large deficits, reaches its highest level ever in 2029 (measured as a percentage of GDP) and then continues to grow, reaching 166 percent of GDP in 2054 and remaining on track to increase thereafter. That mounting debt would slow economic growth, push up interest payments to foreign holders of U.S. debt, and pose significant risks to the fiscal and economic outlook; it could also cause lawmakers to feel more constrained in their policy choices.
Outlays are large by historical standards, and they generally rise over the 2024–2054 period, reaching 27.3 percent of GDP in 2054. Rising interest costs and spending for the major health care programs, particularly Medicare, drive that growth.
Revenues, measured as a percentage of GDP, fluctuate over the next decade and rise thereafter, reaching 18.8 percent of GDP in 2054, as growth in income boosts receipts from the individual income tax.
Changes in CBO’s Budget Projections Since June 2023
Measured as a percentage of GDP, the deficit is now projected to be 1.6 percentage points smaller in 2053 than it was in last year’s report, and federal debt is now projected to be 17 percentage points smaller.
A key factor contributing to smaller projected deficits is a reduction in discretionary spending stemming from the annual funding limits under the Fiscal Responsibility Act of 2023 and from the Further Continuing Appropriations and Other Extensions Act, 2024.
The U.S. Economy
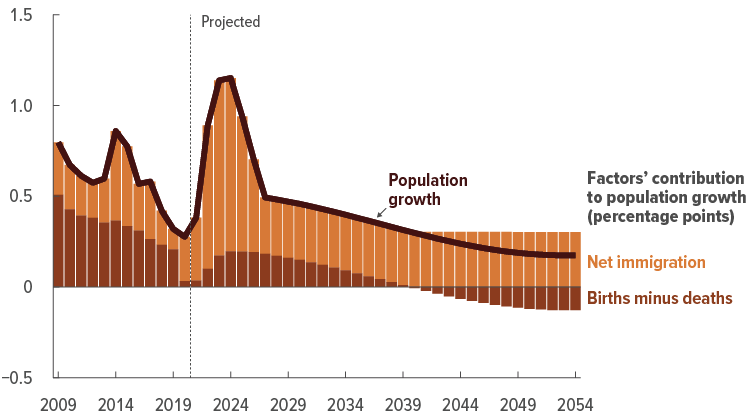
Population growth, which has a significant effect on the economy, is slower over the next 30 years than it was over the past 30 years. Without immigration, the population would begin to shrink in 2040.
Economic growth is also slower over the next three decades than it was over the previous three decades. The decline in output growth is the result of slower growth of the labor force and slower accumulation of capital resulting from increased federal borrowing.
Inflation slows through 2026 to a rate that is consistent with the Federal Reserve’s long-term goal of 2 percent and then remains at rates that are consistent with that goal from 2026 to 2054.
Interest rates generally rise over the next three decades, largely as a result of projected increases in federal borrowing and in capital income as a share of total income.
Changes in CBO’s Economic Projections Since June 2023
On average, the economy is now expected to grow more rapidly over the next 30 years than the agency projected in June 2023. That increase stems from stronger growth of the potential labor force over the next 10 years, largely driven by increased net immigration, and faster capital accumulation over the next 30 years.
CBO’s baseline budget and economic projections reflect the assumption that current laws governing taxes and spending will generally remain unchanged. The agency’s long-term budget projections follow its 10-year baseline budget projections and extend most of their underlying concepts for an additional 20 years.
By the Numbers
The Long-Term Budget Outlook, by Fiscal Year
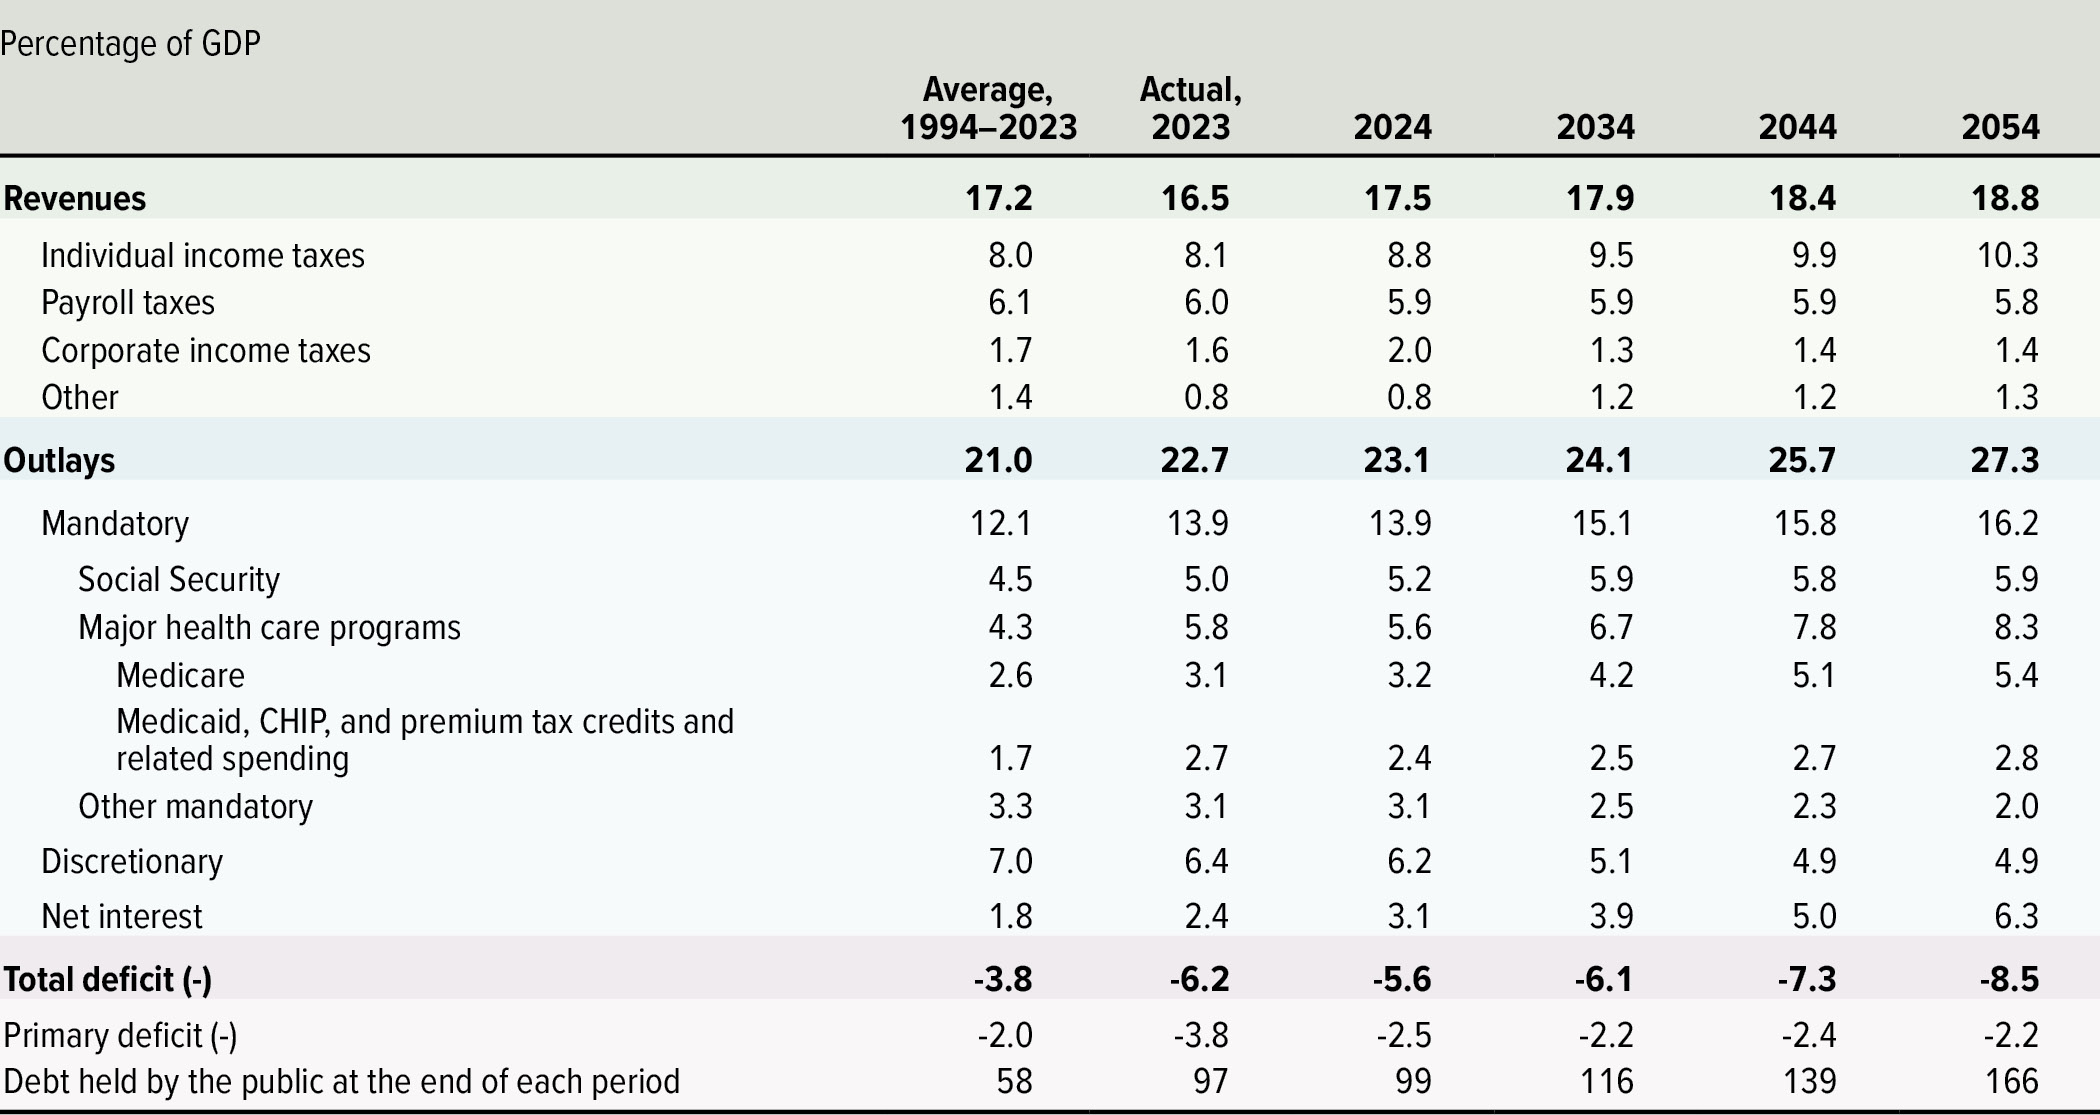
See Chapter 1 and Chapter 2. Deficits and outlays have been adjusted to exclude the effects of shifts in the timing of certain payments when October 1, the first day of the fiscal year, falls on a weekend.
The Long-Term Economic Outlook, by Calendar Year
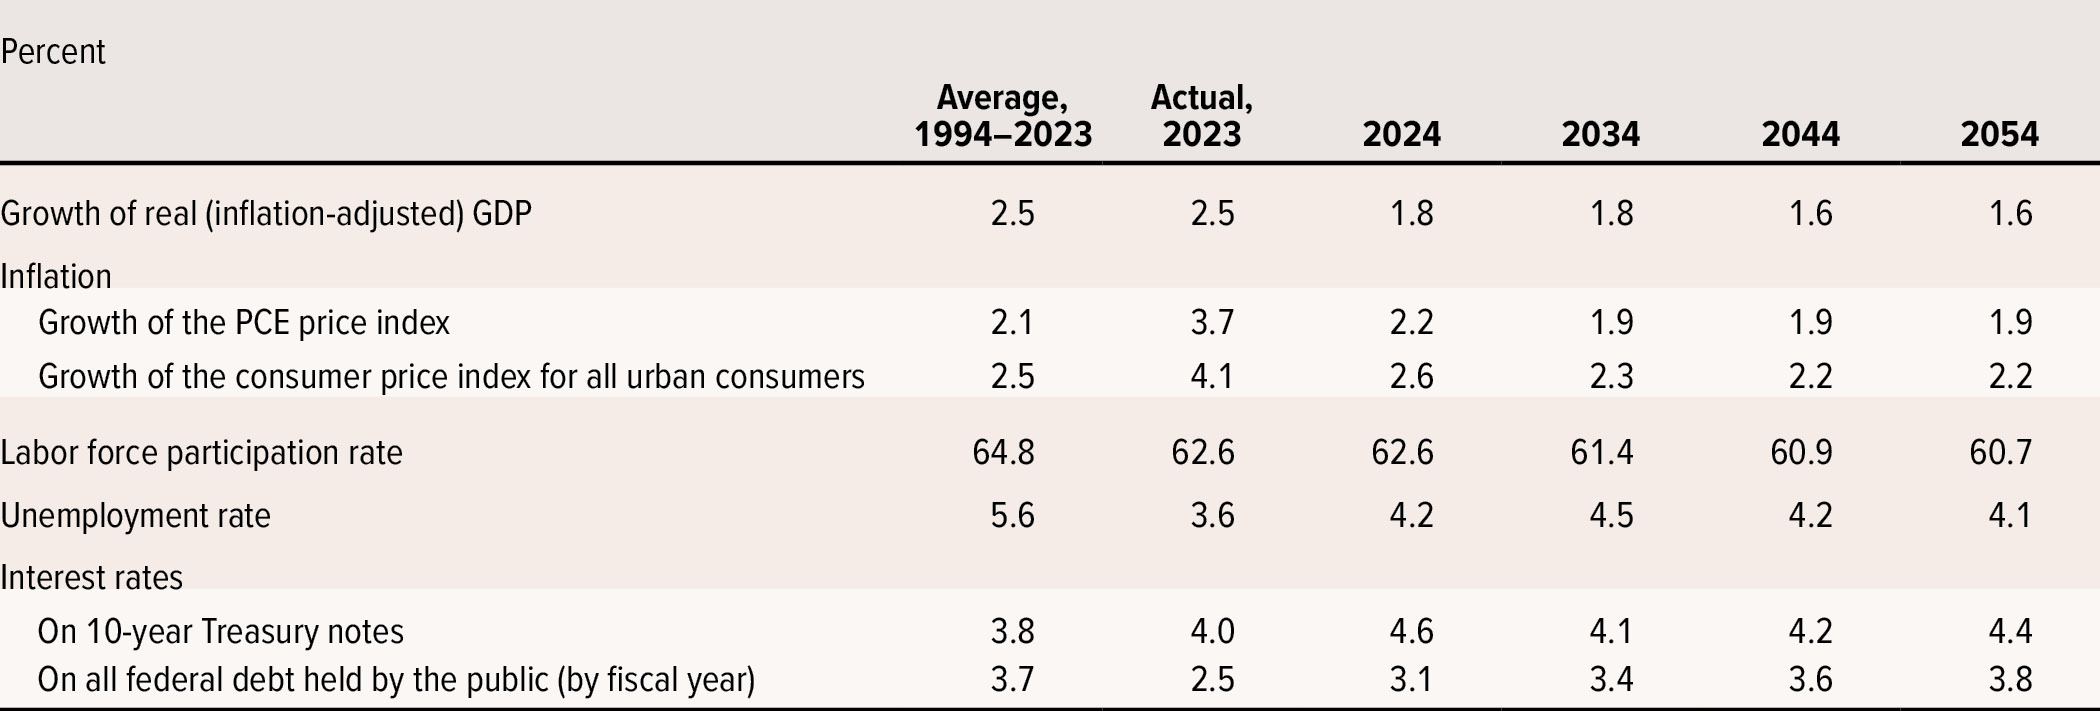
See Chapter 3 and Appendix C.
Notes About This Report
The Congressional Budget Office’s long-term budget projections, referred to as the extended baseline, follow the agency’s 10-year baseline budget projections and then extend most of the concepts underlying those projections for an additional 20 years.
The long-term budget projections in this report are based on CBO’s February 2024 baseline budget and economic projections and the agency’s January 2024 demographic projections. The budget projections incorporate the effects of legislation enacted as of January 3, 2024. The economic projections reflect economic developments and information as of December 5, 2023. The demographic projections reflect developments through November 21, 2023.
In accordance with statutory requirements, CBO’s projections reflect the assumptions that current laws generally remain unchanged, that some mandatory programs are extended after their authorizations lapse, and that spending on Medicare and Social Security continues as scheduled even if their trust funds are exhausted.
Unless this report indicates otherwise, all years referred to in describing budget projections are federal fiscal years, which run from October 1 to September 30 and are designated by the calendar year in which they end. Years referred to in describing economic projections are calendar years.
When October 1 (the first day of the fiscal year) falls on a weekend, certain payments that ordinarily would have been made on that day are instead made at the end of September and thus are shifted into the previous fiscal year. In this report, budget projections have been adjusted to treat the payments as if they were not subject to the shifts.
Unless this report notes otherwise, Medicare outlays are presented net of premiums paid by beneficiaries and other offsetting receipts, which reduce outlays for the program.
Numbers in the text, tables, and figures may not add up to totals because of rounding.
Supplemental information files—the data underlying the tables and figures in this report, supplemental budget projections, and the economic variables underlying those projections—are posted on CBO’s website at www.cbo.gov/publication/59711#data. Previous editions of this report are available at http://tinyurl.com/2t6r8nn2.
Executive Summary
Each year, the Congressional Budget Office publishes a report presenting its projections of what the federal budget and the economy would look like over the next 30 years if current laws generally remained unchanged. This report is the latest in that series.
Projections for 2054
Budget deficit: 8.5% of GDP
Debt held by the public: 166% of GDP
Outlays: 27.3% of GDP
Revenues: 18.8% of GDP
The Long-Term Budget Outlook
Deficits
In CBO’s projections, the total federal budget deficit increases significantly in relation to gross domestic product (GDP) over the next 30 years, reaching 8.5 percent of GDP in 2054. Since the Great Depression, that level has been exceeded only during and shortly after World War II and during the 2007–2009 financial crisis and the coronavirus pandemic. That growth results from rising interest costs and large and sustained primary deficits, which exclude net outlays for interest. Those deficits average 2.2 percent of GDP over the 30-year period; over the past 50 years, they averaged 1.6 percent of GDP. Projected primary deficits are especially large given the forecast of low unemployment rates.
Debt
Federal debt held by the public, measured as a percentage of GDP, increases in every year of the 2024–2054 period. By 2029, that debt climbs to 107 percent of GDP, exceeding the historical peak it reached immediately after World War II. In 2054, it reaches 166 percent of GDP and remains on track to increase thereafter. Such large and growing debt would slow economic growth, push up interest payments to foreign holders of U.S. debt, and pose significant risks to the fiscal and economic outlook; it could also cause lawmakers to feel more constrained in their policy choices.
Outlays and Revenues
Measured as a percentage of GDP, federal outlays are large by historical standards and, beginning in 2028, increase in each year, reaching 27.3 percent of GDP in 2054. Growth in net interest costs and in spending for federal health care programs, particularly Medicare, drives those increases. Revenues, also measured as a percentage of GDP, fluctuate over the next decade and increase thereafter, reaching 18.8 percent of GDP in 2054. That later growth in revenues occurs mainly because growth in income boosts receipts from the individual income tax.
Changes in CBO’s Budget Projections
Measured as a percentage of GDP, federal debt in 2053 is now projected to be 17 percentage points smaller, and the total deficit in 2053 is now projected to be 1.6 percentage points smaller, than in last year’s report. A key factor contributing to smaller projected deficits is a reduction in discretionary spending stemming from the annual funding limits under the Fiscal Responsibility Act of 2023 and from the Further Continuing Appropriations and Other Extensions Act, 2024. Overall, CBO’s projections of debt have generally increased through 2031 and decreased in later years.
The Budget Outlook in Five Figures
Outlook for 2024–2054
Deficits average 6.7% of GDP over the 30-year period, which is 3.0 percentage points more than they averaged over the past 50 years.
Debt held by the public reaches 107% of GDP in 2029, exceeding the historical peak reached just after World War II, and its growth continues to accelerate through 2054.
Total Deficits, Primary Deficits, and Net Interest Outlays
In CBO’s projections, large and sustained primary deficits (which exclude net interest costs) combine with rising interest rates and the growing debt to cause net outlays for interest to more than double in relation to GDP by 2054. Those factors push the total deficit up to 8.5 percent of GDP in that year.
Percentage of GDP
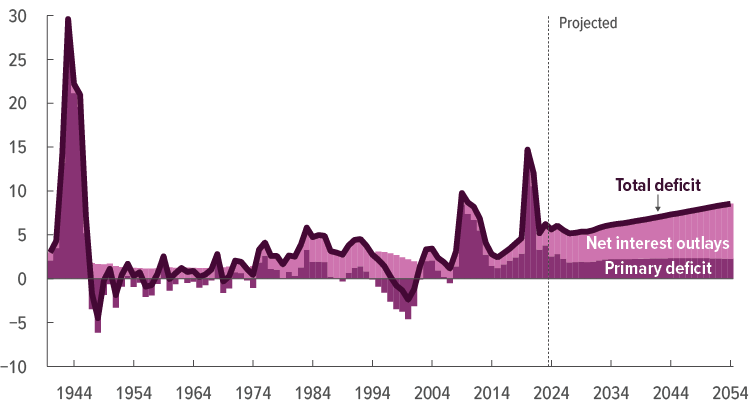
See Figure 1-1.
Federal Debt Held by the Public
Debt increases in relation to GDP, exceeding any previously recorded level in 2029 and continuing to soar through 2054. It is on track to increase even more thereafter.
Percentage of GDP
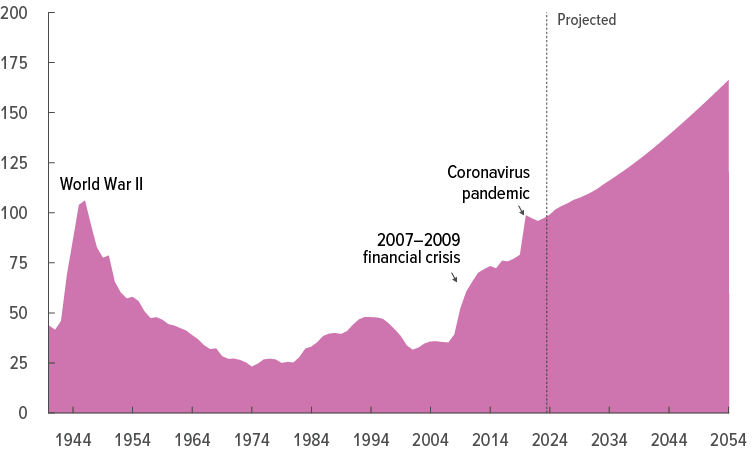
See Figure 1-1.
Outlook for 2024–2054
Net outlays for interest more than double, reaching 6.3% of GDP in 2054.
Outlays for the major health care programs climb to 8.3% of GDP in 2054.
Total Outlays and Revenues
From 2024 to 2054, federal spending is larger and rising faster, on average, than revenues are. Spending and revenues each represent a larger percentage of GDP over that period than they did, on average, over the past 50 years.
Percentage of GDP

See Figure 2-1.
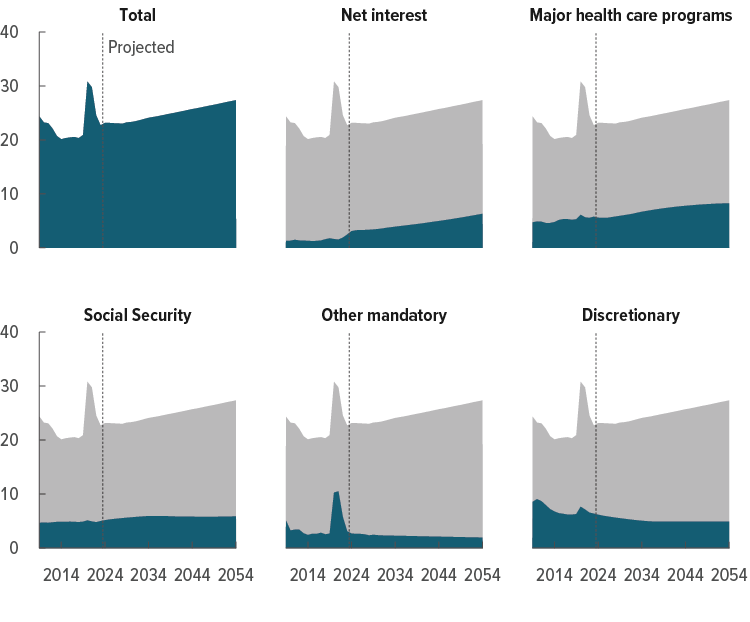
Outlays, by Category
Increases in net interest costs and in spending for major health care programs largely drive the increase in spending over the 2024–2054 period. Driven by rising interest rates and mounting debt, net outlays for interest more than double, relative to GDP, during the period, reaching 6.3 percent of GDP in 2054.
As the population ages and health care costs grow, outlays for the major health care programs also rise over the next three decades, reaching 8.3 percent of GDP in 2054. In that year, for people age 65 or older, outlays for Social Security, Medicare, and Medicaid amount to more than 50 percent of all noninterest spending.
Percentage of GDP
See Figure 2-2.
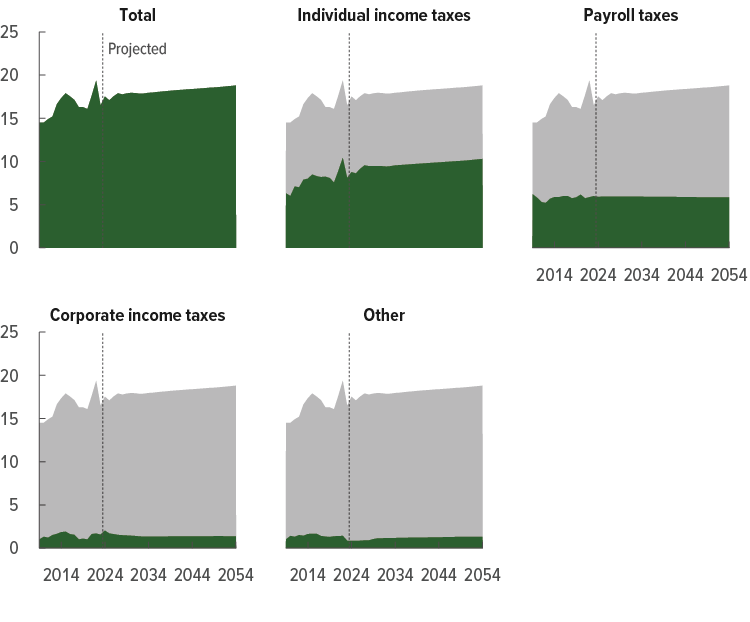
Revenues, by Source
Total revenues, measured as a percentage of GDP, grow by 1.3 percentage points from 2024 to 2054. Receipts from individual income taxes account for nearly all of that growth because increases in real income mean that a larger share of income becomes subject to higher tax rates. Receipts from other sources remain largely unchanged, on net.
Percentage of GDP
See Figure 2-6.
The Long-Term Budget Outlook, by Fiscal Year
See Chapter 1 and Chapter 2. When October 1 (the first day of the fiscal year) falls on a weekend, certain payments that would have ordinarily been made on that day are instead made at the end of September and thus are shifted into the previous fiscal year. Outlays and deficits have been adjusted to remove the effects of those timing shifts.
Outlook for 2024–2054
The growth of real (inflation-adjusted) GDP averaged 2.5% per year over the past 30 years. Over the next 30 years, real GDP growth averages 1.7% per year.
The Long-Term Demographic and Economic Outlook
Population Growth
Demographic trends are a key determinant of the long-term budget and economic outlook. In CBO’s projections, the population grows more slowly over the next 30 years than it did over the past 30 years. Without immigration, the population would begin to shrink in 2040, in part because fertility rates remain below the rate that would be required for a generation to replace itself.
Economic Growth
In CBO’s projections, real (inflation-adjusted) GDP grows at an average rate of 1.7 percent per year from 2024 to 2054, slightly slower than the growth of real potential GDP—the maximum sustainable output of the economy—over that period. Real potential GDP is projected to increase at an average rate of 1.8 percent per year over the next 30 years, slower than such growth over the past 30 years, when it averaged 2.4 percent. That decline is attributable to slowing growth in the potential labor force (an estimate of what the size of the labor force would be if economic output and other key variables were at their maximum sustainable amounts) and in potential labor force productivity (the ratio of real potential GDP to the potential labor force) over the 2024–2054 period.
Potential Labor Force
The potential labor force grows at an average rate of 0.4 percent over the next 30 years—much more slowly than the average growth rate of 0.8 percent over the past 30 years. Slowing population growth and the aging of the population account for most of that slowdown in growth.
Potential Labor Force Productivity
The growth of potential labor force productivity slows over the next 30 years because of two key factors: the slower accumulation of capital (mainly attributable to increased federal borrowing) and slower growth in total factor productivity (that is, the average real output per unit of combined labor and capital services) in the nonfarm business sector.
Inflation and Interest Rates
Inflation slows through 2026 to a rate that is consistent with the Federal Reserve’s long-term goal of 2 percent, and interest rates rise over the next three decades. The rise in interest rates largely stems from projected increases in federal borrowing and in capital income as a share of total income.
Changes in CBO’s Economic Projections
In CBO’s current projections, the average annual growth of real GDP is faster over the 2024–2053 period than it was in the long-term projections that the agency published in June 2023. In CBO’s current projections, real potential GDP grows faster, the labor force is larger, and interest rates are generally higher than in last year’s projections. Faster growth in real potential GDP is driven, in part, by faster growth in the potential labor force. The potential labor force grows faster over the next 10 years primarily because of significant upward revisions to the agency’s projections of net immigration.
Outlook for 2024–2054
Without immigration, the population would begin to shrink in 2040.
Growth in real potential GDP is slower over the next 30 years than over the past 30 years.
The Demographic and Economic Outlook in Four Figures
Population Growth and the Factors That Contribute to It
In CBO’s projections, deaths exceed births beginning in 2040. As a result, without immigration the population would shrink thereafter.
Percent
See Figure 3-1.
Average Annual Growth of Real Potential GDP and Its Components
Real potential GDP grows more slowly from 2024 to 2054 than it has, on average, over the past 30 years. That decline is explained by slower growth in the potential labor force and in potential labor force productivity.
Percent
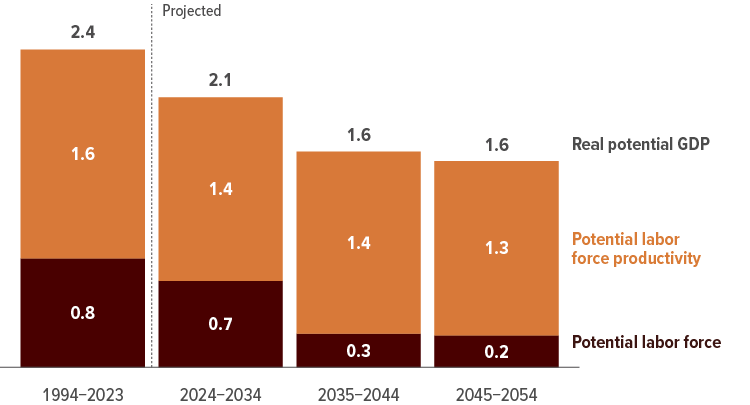
See Figure 3-3.
Average Interest Rates on Federal Debt and on 10-Year Treasury Notes
In CBO’s projections for the 2024–2054 period, interest rates on government securities, such as 10-year Treasury notes, are higher than they were, on average, over the past 30 years. The rise in interest rates mainly stems from an increasing amount of federal debt and the growth of capital income as a share of total income.
Percent
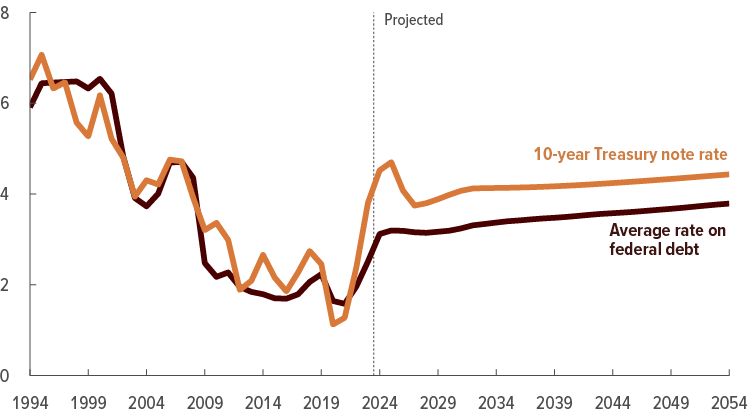
See Figure 3-4.
CBO’s 2023 and 2024 Projections of the Labor Force
In CBO’s current projections, the labor force is about 3 percent larger in 2053 than it was in last year’s projections. That change results from the agency’s increased projections of population growth, which mainly stem from upward revisions to its estimates of net immigration.
Millions of people

See Figure B-2.
The Long-Term Economic Outlook, by Calendar Year
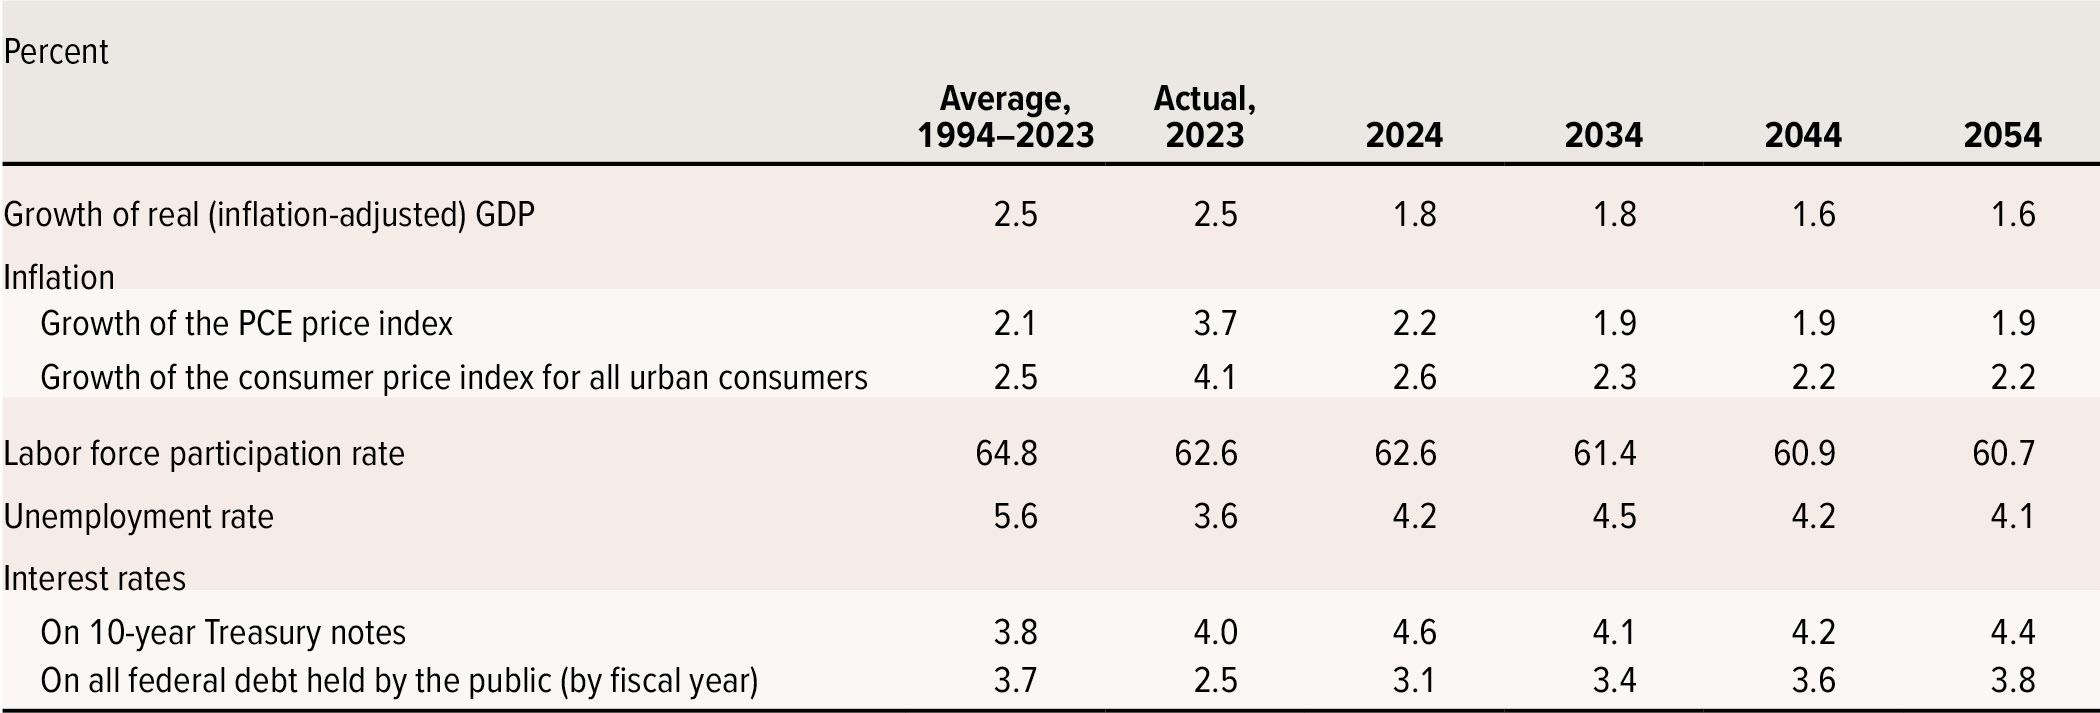
See Chapter 3 and Appendix C.
Chapter 1: Deficits and Debt
Overview
If current laws governing taxes and spending generally remained unchanged, the federal budget deficit would increase significantly in relation to gross domestic product (GDP) over the next 30 years, the Congressional Budget Office projects. That increase would stem from high and rising interest costs and from large primary deficits (that is, deficits excluding net outlays for interest). From 2024 to 2054, growing deficits would push federal debt held by the public far beyond any previously recorded level (see Figure 1-1).
Figure 1-1.
Deficits and Debt
Percentage of GDP

In CBO’s projections, the total deficit increases significantly over the next 30 years, reaching 8.5 percent of GDP in 2054. Net interest outlays more than double in relation to GDP, reaching 6.3 percent of GDP in 2054. Those outlays are boosted by rising interest rates and large and sustained primary deficits.
Growing deficits cause federal debt held by the public, which is already large, to grow further throughout the 30-year period. Such debt soars to 166 percent of GDP in 2054—and would continue to increase thereafter.
Data source: Congressional Budget Office. See www.cbo.gov/publication/59711#data.
Primary deficits exclude net outlays for interest. In this figure, deficits were calculated by subtracting revenues from outlays; thus, positive values indicate deficits, and negative values indicate surpluses, which occur when revenues exceed outlays.
GDP = gross domestic product.
Such large and growing debt would have significant economic and financial consequences. Among its other effects, it would slow economic growth, drive up interest payments to foreign holders of U.S. debt, heighten the risk of a fiscal crisis, increase the likelihood of other adverse outcomes, and make the nation’s fiscal position more vulnerable to an increase in interest rates.
Even if federal laws remained unchanged, CBO’s budget projections would be subject to considerable uncertainty. If developments in the economy, demographics, or other factors that affect revenues and outlays diverged from the agency’s projections, budgetary outcomes would diverge as well. That uncertainty grows over time because changes in factors that affect the budget become increasingly difficult to anticipate over longer time horizons.
Deficits and Debt Through 2054
In CBO’s projections, deficits are historically large. From 2024 to 2054, they average 6.7 percent of GDP—almost double their average over the past half-century—and reach 8.5 percent of GDP in 2054 (see Table 1-1).1 That growth in deficits occurs for two reasons:
- Interest costs more than double in relation to GDP between 2024 and 2054, driven by rising interest rates and growing debt. Those costs reach 6.3 percent of GDP in 2054 and are larger in every year than their average of 2.1 percent of GDP over the past 50 years. Higher interest rates account for about two-thirds of the projected rise in net interest costs over the 2024–2054 period; primary deficits account for the rest.
- The primary deficit is also large by historical standards throughout the 30-year period, averaging 2.2 percent of GDP. That is larger than its average of 1.6 percent of GDP over the past 50 years. In 2054, the primary deficit equals 2.2 percent of GDP.2
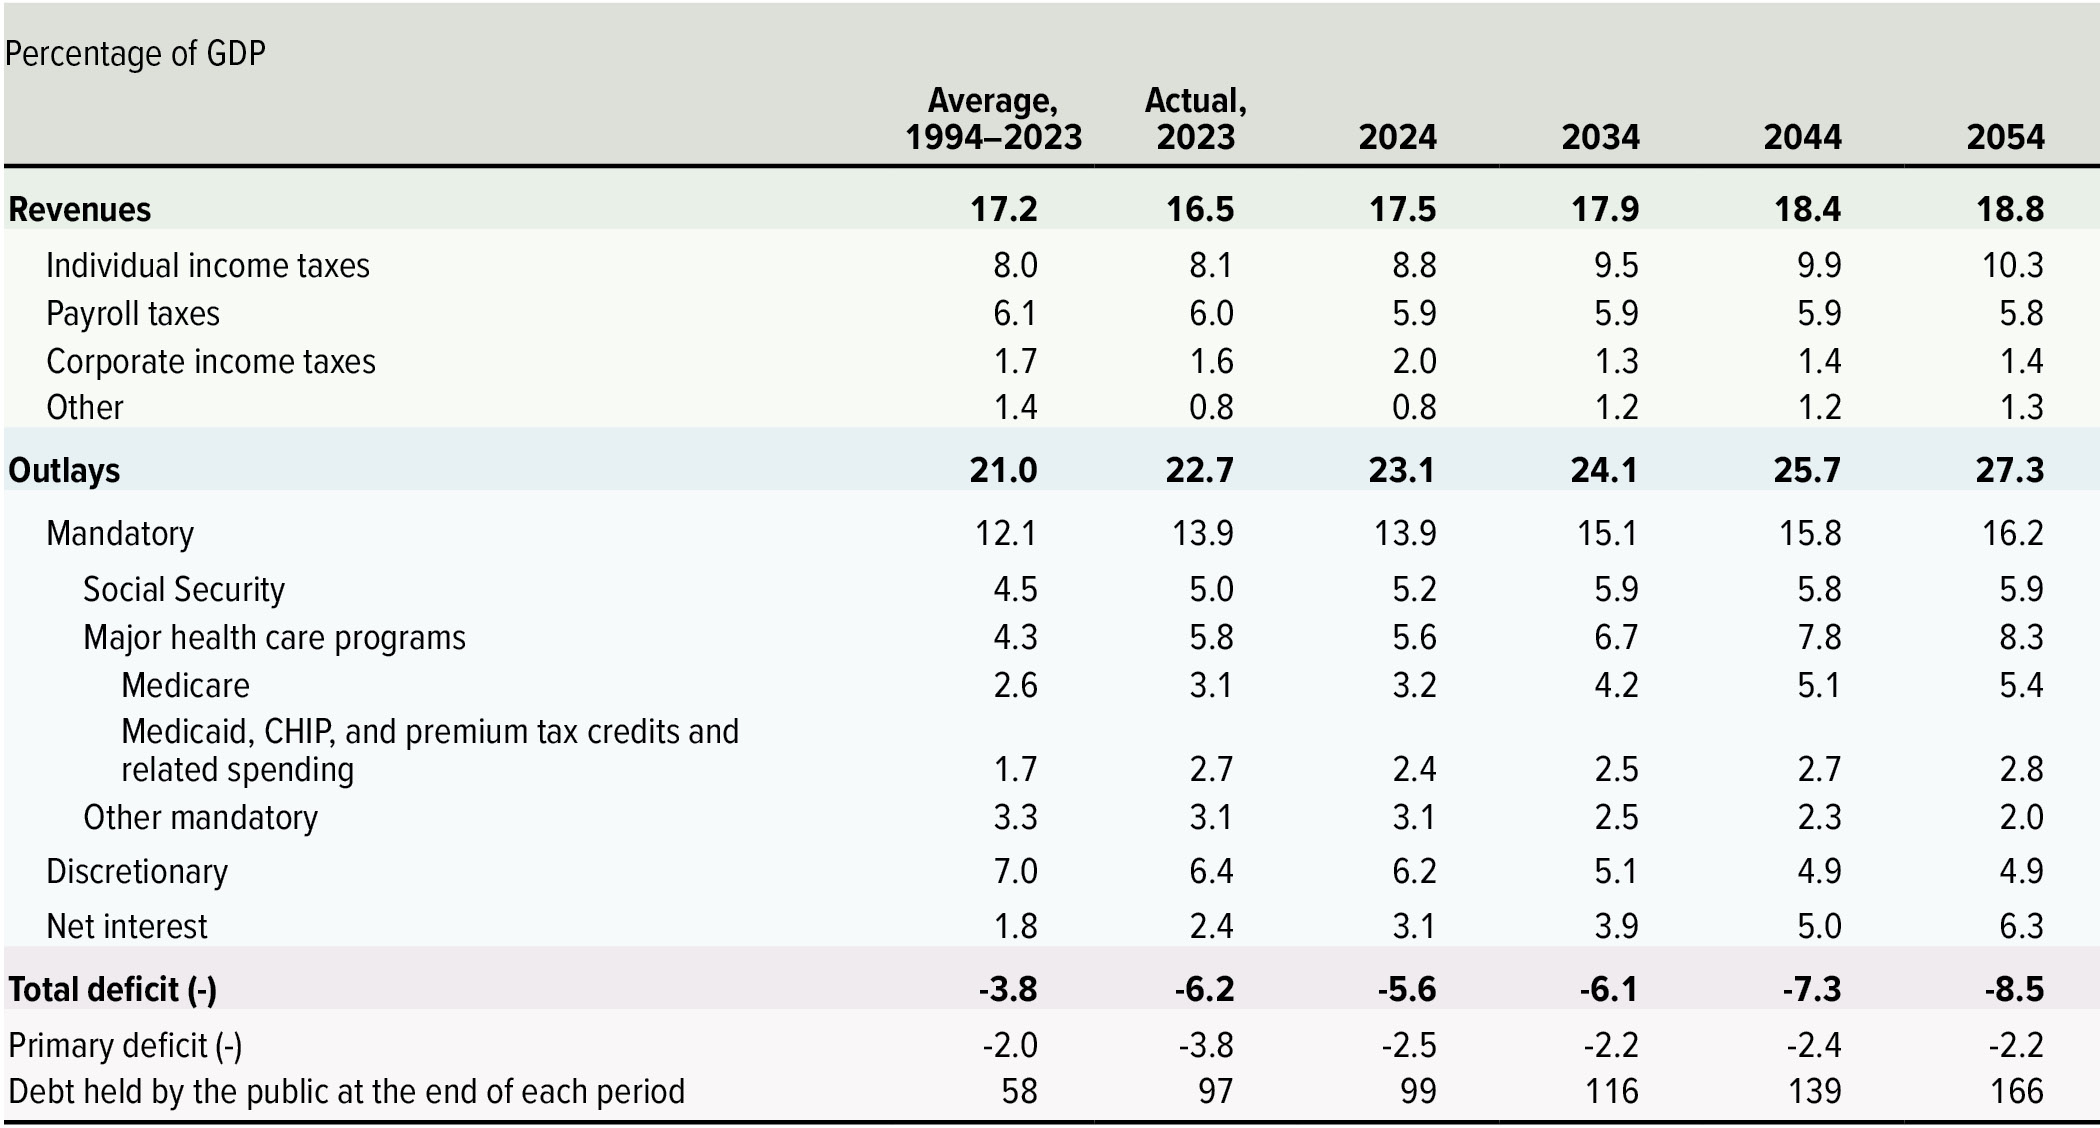
Table 1-1.
Key Projections for Selected Years
Percentage of GDP
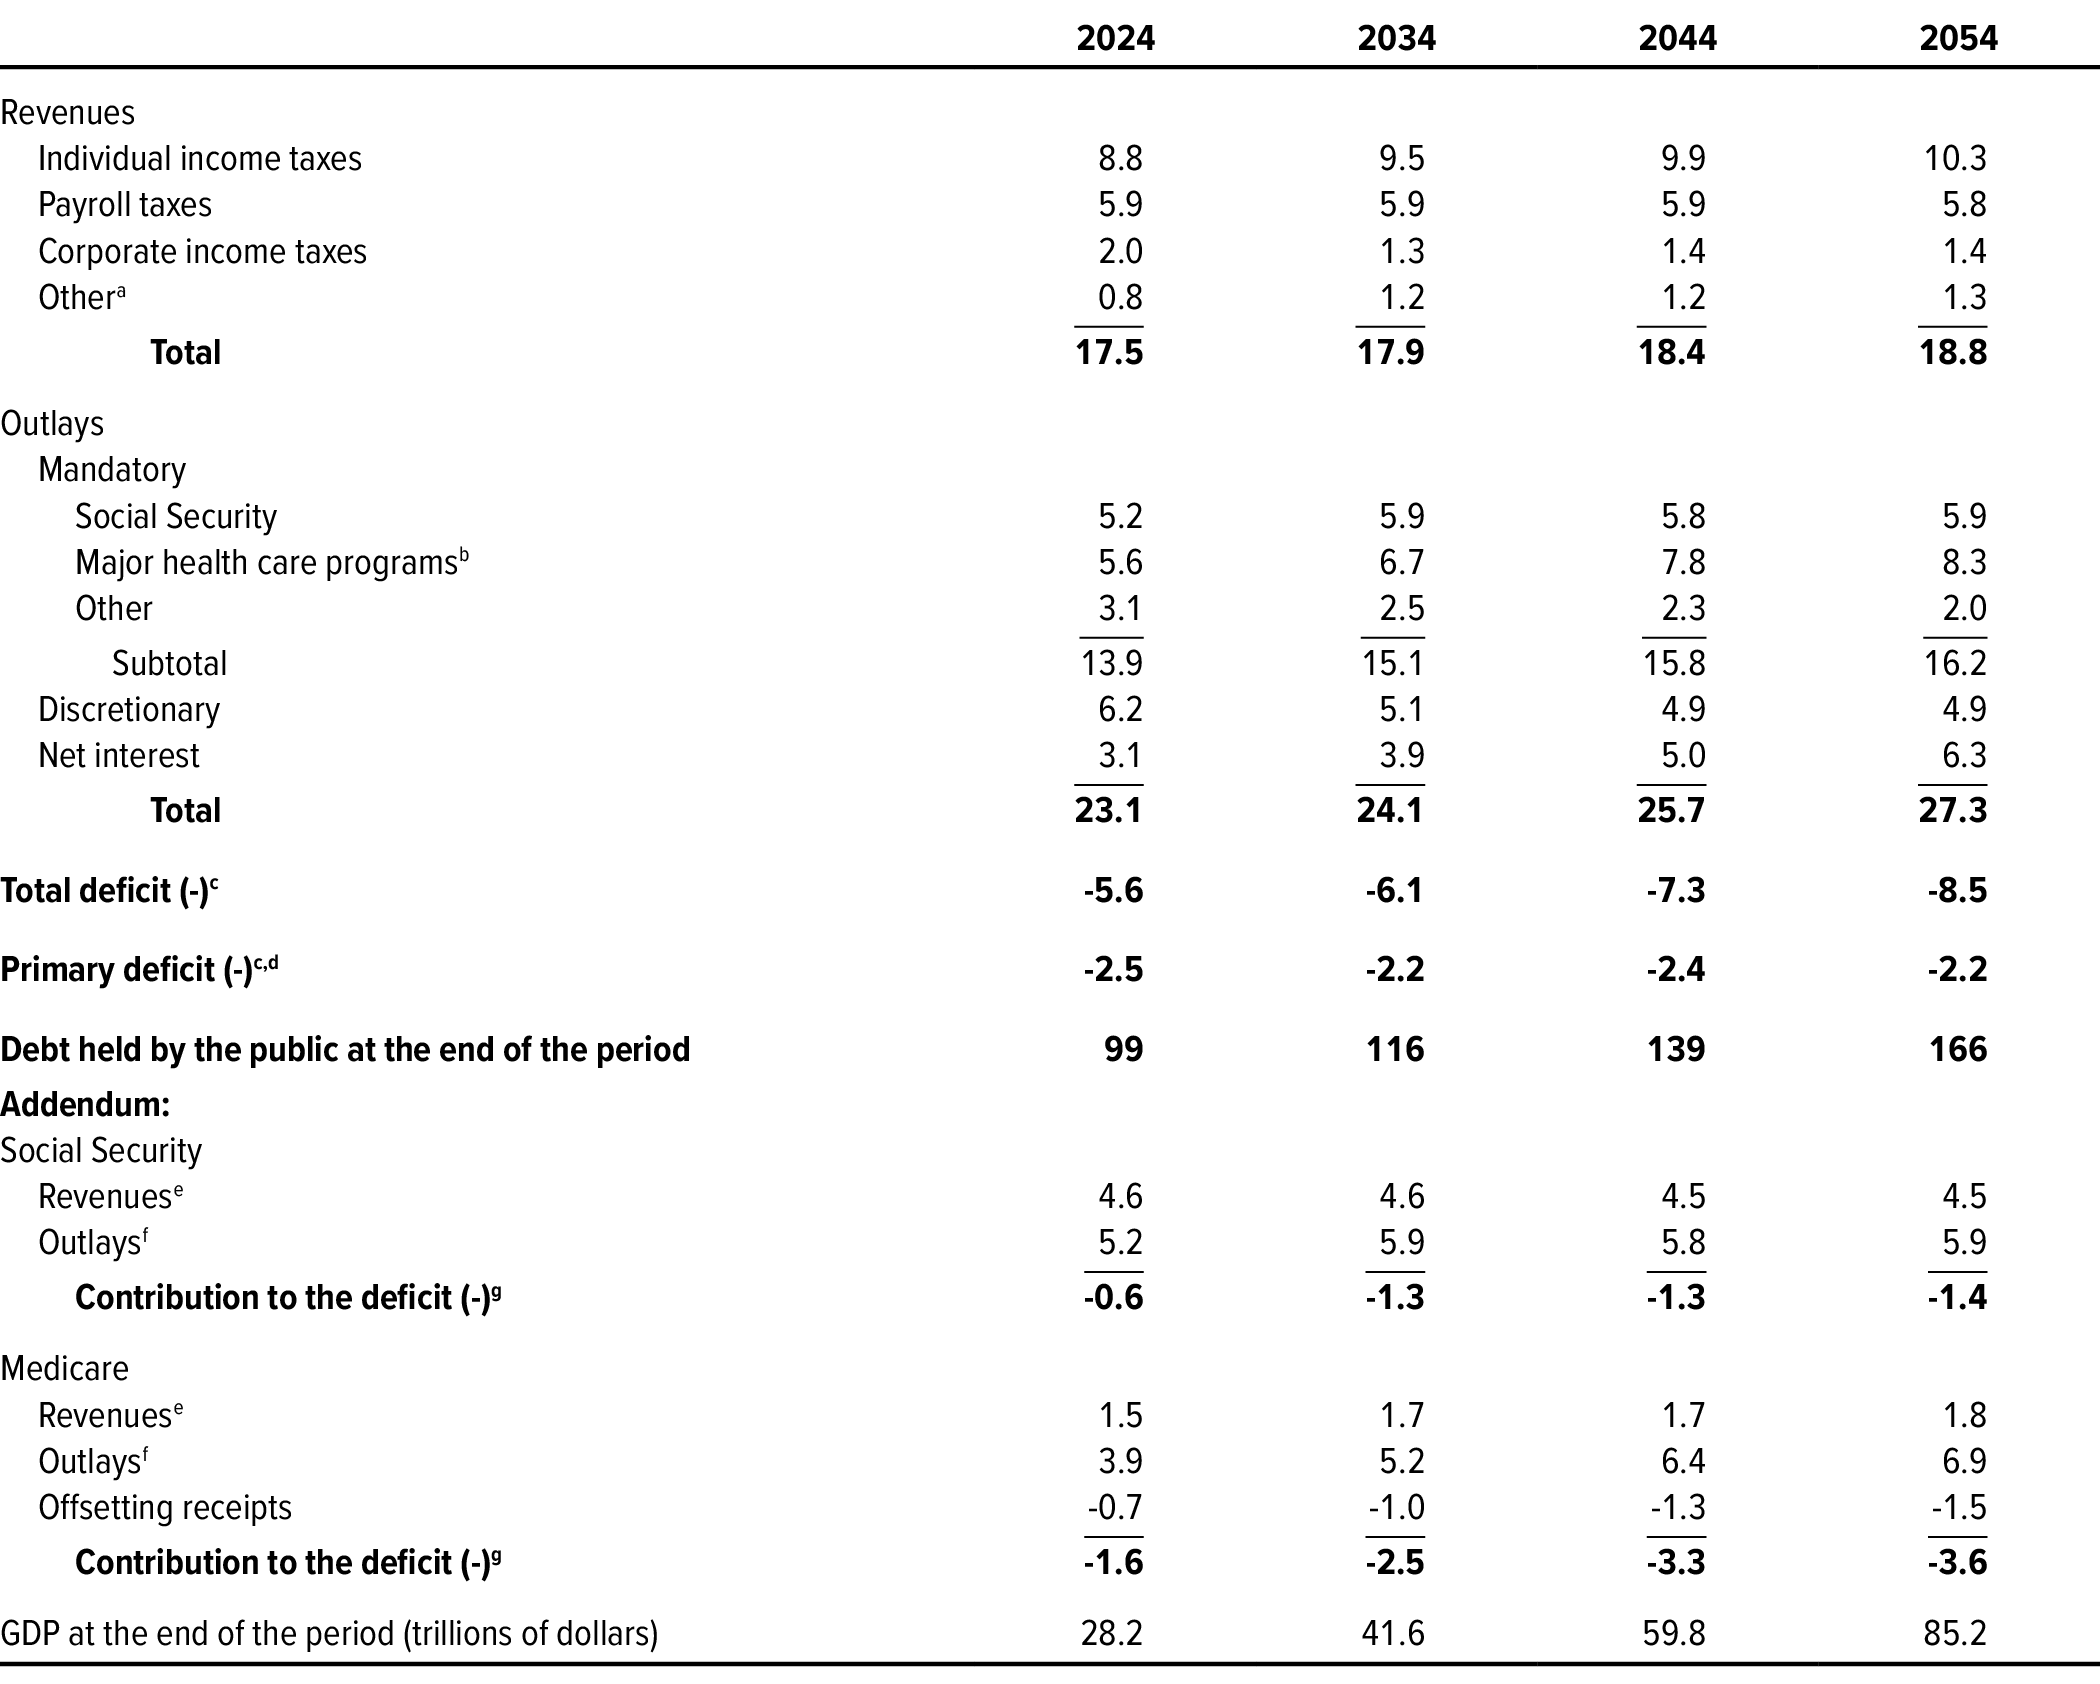
Data source: Congressional Budget Office. See www.cbo.gov/publication/59711#data.
This table provides information specified in section 3111 of S. Con. Res. 11, the Concurrent Resolution on the Budget for Fiscal Year 2016.
CBO’s long-term budget projections, referred to as the extended baseline, follow the agency’s 10-year baseline budget projections (which conform to a set of assumptions specified in law) and then extend most of the concepts underlying those projections for an additional 20 years.
When October 1 (the first day of the fiscal year) falls on a weekend, certain payments that ordinarily would have been made on that day are instead made at the end of September and thus are shifted into the previous fiscal year. All projections have been adjusted to exclude the effects of those timing shifts.
GDP = gross domestic product.
a. Consists of excise taxes, remittances to the Treasury from the Federal Reserve System, customs duties, estate and gift taxes, and miscellaneous fees and fines.
b. Consists of outlays for Medicare (net of premiums and other offsetting receipts), Medicaid, and the Children’s Health Insurance Program, as well as premium tax credits for health insurance purchased through the marketplaces established under the Affordable Care Act and related spending. The premium tax credits subsidize the purchase of health insurance. Related spending is spending to subsidize health insurance provided through the Basic Health Program and to stabilize premiums for health insurance purchased by individuals and small employers.
c. When outlays exceed revenues, the result is a deficit. Values in this row were calculated by subtracting outlays from revenues; thus, negative values indicate deficits.
d. Primary deficits exclude net outlays for interest.
e. Includes payroll taxes other than the employer’s share of payroll taxes that federal agencies pay; those payments are intragovernmental transactions. Also includes income taxes paid on Social Security benefits, which are credited to the Social Security and Medicare trust funds.
f. For Social Security, outlays do not include those related to the administration of the program, which are discretionary. For Medicare, outlays include those related to the administration of the program. Outlays for those two programs do not include intragovernmental offsetting receipts stemming from the employer’s share of payroll taxes that federal agencies pay.
g. The net increase in the deficit shown here differs from the change in the trust fund balance for the program. It does not include intragovernmental transactions, interest earned on balances, or outlays related to the administration of the program.
Primary deficits are especially large given the low unemployment rates that the agency is forecasting.3 For instance, in CBO’s projections, the unemployment rate is 4.1 percent in 2054. By way of historical contrast, from 1974 to 2023, the unemployment rate was at or below 4.5 percent in eight years. During those eight years, the primary deficit was equal to 0.3 percent of GDP, on average—1.9 percent of GDP less than the deficit projected for 2054.
Boosted by persistently large deficits, federal debt held by the public rises in every year of the 2024–2054 period and surpasses its highest level in history in 2029.4 That year, debt climbs to 107 percent of GDP, exceeding the peak of 106 percent reached in 1946, immediately following World War II. In 2054, such debt reaches 166 percent of GDP and is on course to grow larger still.
Consequences of Large and Growing Federal Debt
If federal debt continued to increase in relation to GDP at the pace that CBO projects it would under current law, it would have far-reaching implications for the nation’s fiscal and economic outlook.5 That large and growing debt would have many consequences, including the following:
- Borrowing costs throughout the economy would rise, reducing private investment and slowing the growth of economic output.
- Rising interest costs associated with that debt would drive up interest payments to foreign holders of U.S. debt and thus decrease national income.
- The risk of a fiscal crisis—that is, a situation in which investors lose confidence in the value of the U.S. government’s debt—would increase. Such a crisis would cause interest rates to rise abruptly and other disruptions to occur.
- The likelihood of other adverse outcomes would also increase. For example, expectations of higher inflation could erode confidence in the U.S. dollar as the dominant international reserve currency.
- The United States’ fiscal position would be more vulnerable to an increase in interest rates, because the larger debt is, the more an increase in interest rates raises debt-service costs.
- Lawmakers might feel constrained from using fiscal policy to respond to unforeseen events or for other purposes, such as to promote economic activity or strengthen national defense.
When policymakers consider legislative action that would lead to an increase in debt, they face a trade-off between the potential consequences of large and growing debt and the effects of increased federal spending or reduced taxes on people, businesses, and the economy as a whole.6 For example, federal investment—including investment financed by deficits—boosts productivity, including that in the private sector, as well as output. That increased output would generally lead to increased revenues; however, those additional revenues would probably only partially offset the budgetary costs of the increased investment and any borrowing needed to finance it.7
Slower Economic Growth
Large and growing federal debt would, over time, push up the cost of borrowing, reduce private investment, and slow the growth of GDP, all else being equal.
The increased federal borrowing associated with larger amounts of debt reduces the resources available for private investment. It also tends to increase borrowing costs in both the public sector and the private sector by driving up interest rates. As a result, investment in capital used for the production of goods and services, such as housing and commercial structures, decreases. That reduction in private investment would slow economic growth. Specifically, as investment in capital declined, workers would, on average, have fewer resources to do their jobs than they would if debt was smaller and capital investment was greater. Consequently, they would be less productive, their compensation would be lower, and they would therefore be less inclined to work. Those effects would increase over time as federal borrowing grew.
In CBO’s projections, the reduction in private investment stemming from larger amounts of debt is partially offset by three key factors. First, additional government borrowing strengthens people’s incentive to save, partly by driving up interest rates.8 Second, higher interest rates tend to attract more foreign capital to the United States, and some of those funds become available for private investment. And third, federal borrowing that supports effective federal investment typically increases private-sector productivity and, therefore, private investment.9 In CBO’s assessment, the increase in private investment stemming from those three factors would not be as large as the reduction in private investment resulting from greater debt.
Increased Interest Payments to Foreign Holders of U.S. Debt
If federal debt held by the public continued to grow, the government would spend more on interest payments—including payments to foreign investors, who currently hold roughly one-third of that debt overall (and 40 percent of such debt not held by the Federal Reserve). Increases in interest payments to foreign investors would, in turn, reduce the nation’s net international income, which is the difference between income received from and paid to foreign residents, firms, and governments. When net international income declines, national income also declines, all else being equal.10
Greater Risk of a Fiscal Crisis
The likelihood of a fiscal crisis would increase as federal debt—measured in relation to the size of the economy—continued to rise, because mounting debt could erode investors’ confidence in the U.S. government’s fiscal position. Such an erosion of confidence would lower the value of Treasury securities and further drive up interest rates on federal debt as investors demanded higher yields to purchase those securities. Concerns about the government’s fiscal position could lead to a sudden and potentially spiraling increase in people’s expectations for inflation, a large drop in the value of the dollar, or a loss of confidence in the government’s commitment to repay its debt in full, all of which would make a fiscal crisis more likely.
Moreover, a fiscal crisis could lead to a financial crisis. In a fiscal crisis, dramatic increases in Treasury rates would reduce the market value of outstanding government securities. The resulting losses incurred by institutions and businesses—including insurance companies, banks, mutual funds, and pension funds—could be large enough to cause some financial institutions to fail. Because the United States plays a central role in the international financial system, such a crisis could spread globally.
Risk Factors. The risk of a fiscal crisis depends on more than the amount of federal debt. Ultimately, it is the government’s cost of servicing the debt and its ability to refinance that debt as needed that matter. Among the factors affecting servicing costs and the ability to refinance are investors’ expectations about the outlook for the budget and the economy, and expectations about domestic and international financial conditions, including interest rates and exchange rates.
CBO cannot reliably quantify the probability of a fiscal crisis. In the agency’s assessment, no tipping point can be identified at which the debt-to-GDP ratio would become so high that it would make a crisis likely or imminent, nor is there a fixed point at which interest costs would become so high in relation to GDP that they were unsustainable.
Risk of a Crisis in the Near Term. Although the risk of a fiscal crisis cannot be reliably quantified, such risk in the near term appears to be low despite the current large amount of federal debt. The near-term risk is mitigated by certain characteristics of the U.S. financial system that tend to sustain demand for Treasury securities. For example, the Federal Reserve conducts independent monetary policy, government debt is issued in U.S. dollars, the dollar holds a central place in the global financial system, and few investments can provide returns comparable to those of Treasury securities at similarly low levels of credit risk.
In addition, concern about a fiscal crisis in the near term is not currently apparent in financial markets. However, financial markets do not always fully reflect all potential risks, and the risk of a fiscal crisis could change suddenly in the wake of unexpected events. For example, a rise in interest rates that persisted for an extended period could cause investors to become concerned about the government’s fiscal position over the long term.
Increased Likelihood of Other Adverse Effects
Even in the absence of a fiscal crisis, large and growing debt could have adverse effects on the economy beyond those incorporated in CBO’s projections. Such effects include a gradual decline in the value of Treasury securities and other domestic assets, heightened expectations of inflation, and a loss of confidence in the U.S. dollar as the dominant international reserve currency. Such developments would, among other effects, make it more difficult to finance public and private activity.
Greater Vulnerability of the Nation’s Fiscal Position to an Increase in Interest Rates
Larger amounts of debt make the United States’ fiscal position more vulnerable to an increase in interest rates. The amounts of debt in CBO’s projections increase the risk that interest costs would be substantially greater than projected—even without a fiscal crisis—if interest rates were higher than projected. Conversely, lower interest rates would result in lower-than-projected interest costs.
Increased Perception of Fiscal Constraints Among Policymakers
The size of budget deficits and debt could influence policymakers’ choices. If the amount of debt was already large, policymakers might feel constrained from using deficit-financed fiscal policy to respond to unforeseen events, promote economic activity, or further other goals. Large amounts of debt could also undermine the international geopolitical role of the United States if policymakers were reluctant to increase spending to prepare for or respond to an international crisis. In addition, as debt and the resulting interest costs got larger, boosting deficits, greater adjustments to the noninterest components of the budget would be required to improve the nation’s fiscal balance.
Uncertainty of CBO’s Long-Term Projections
CBO’s budget projections are intended to show what would happen to federal spending, revenues, deficits, and debt if current laws governing taxes and spending generally remained the same. Those outcomes depend on future legislative action, which could increase or decrease budget deficits.
Even if federal laws remained unchanged over the next three decades, actual budgetary outcomes would differ from those in CBO’s projections because of unanticipated changes in demographics, economic conditions, and other factors. Those other factors include the extent to which people claim benefits and tax preferences that they are eligible to receive and the costs of goods and services linked to government subsidies, including food and health care.
Such unanticipated changes—and the legislation that may result from them—can have significant effects on the federal budget. For instance, federal debt held by the public, measured as a percentage of GDP, increased from 39 percent of GDP in 2008 to 100 percent in 2020; much of that increase was related to the 2007–2009 financial crisis, the coronavirus pandemic, and the legislation enacted in response to each of those disruptions.
Uncertainty About the Economic Outlook
CBO’s economic projections are subject to a high degree of uncertainty. For instance, severe and protracted economic downturns are rare. Yet, if such a downturn occurred, budgetary outcomes could significantly diverge from those in CBO’s projections. Economic downturns can reduce revenues and raise outlays for unemployment insurance, nutrition assistance, or other programs that provide support to people and businesses. In addition, downturns have historically prompted policymakers to enact legislation that further reduces revenues and increases federal spending in an effort to increase people’s income, bolster the financial position of state and local governments, and stimulate economic activity and employment.
Conversely, economic growth could be stronger than the agency expects. An increase in productivity—for example, because of technological changes—or the discovery and development of natural resources could cause such a development. If that were the case, revenues would be greater than CBO projects, and outlays, including those for support programs, would be less.
The impact of climate change is also uncertain. On net, CBO expects climate change to reduce economic growth over the coming decades. The effects of climate change are expected to increase over time, but because climate change is an evolving phenomenon, the nature and extent of those changes are uncertain.11 (For a discussion of the effects of climate change on CBO’s projections of economic growth, see Appendix C.)
Another key source of uncertainty is the strength of demand for U.S. Treasury securities from both domestic and foreign investors and the implications for the average interest rate on all federal debt held by the public. Uncertainty about the path of interest rates contributes to uncertainty about the effects that larger deficits and debt would have on the economy.
Uncertainty About the Demographic Outlook
CBO’s long-term demographic projections are subject to significant uncertainty because, compounded over many years, even small changes in rates of net immigration, fertility, or mortality could greatly affect outcomes later in the projection period.12
Projections of net immigration, particularly for some groups—such as people who enter the United States illegally—are especially uncertain because information can be scarce and, when available, difficult to assess. Because many immigrants are of working age, greater-than-projected net immigration would result in a larger-than-projected labor force; less-than-projected net immigration would have the opposite effect.13
If fertility rates differed from the agency’s expectations, some effects on the budget and on the economy would occur more quickly than others. For example, a change in fertility rates would affect spending for pregnant women and infants in the Medicaid program in the near term, but those children would not enter the labor force—and thus affect the economy—for some time.
In addition, differences in mortality rates would cause outlays for the major health care programs and Social Security to diverge from CBO’s projections. If mortality rates were lower than CBO projects, that would probably result in increased outlays for Social Security and Medicare as people lived longer. If mortality rates were higher than CBO projects, such outlays would most likely be smaller than the agency projects.
1. The long-term budget projections in this report are based on CBO’s February 2024 baseline budget and economic projections and the agency’s January 2024 demographic projections. The budget projections incorporate the effects of legislation enacted as of January 3, 2024. Incorporating the budgetary effects of subsequent legislation enacted to date would not significantly change the projections presented here. See Congressional Budget Office, The Budget and Economic Outlook: 2024 to 2034 (February 2024), www.cbo.gov/publication/59710, and The Demographic Outlook: 2024 to 2054 (January 2024), www.cbo.gov/publication/59697.
2. Primary deficits reflect the difference between noninterest spending and revenues—the main mechanisms through which lawmakers can directly influence the trajectory of federal debt and interest costs.
3. The unemployment rate is the percentage of people in the labor force who are not working but who are available for work and are either seeking work or expecting to be recalled from a temporary layoff.
4. Debt held by the public is a measure that indicates the extent to which federal borrowing affects the availability of private funds for other borrowers. All else being equal, an increase in government borrowing reduces the amount of money available to other borrowers, putting upward pressure on interest rates and reducing private investment. It is the measure of debt that CBO uses most often in its reports on the budget.
5. For more details about federal debt and the consequences of its growth, see Congressional Budget Office, Federal Debt: A Primer (March 2020), www.cbo.gov/publication/56165.
6. Larger debt can also have beneficial consequences. For instance, higher interest rates on Treasury securities can help people save for retirement by increasing the return they earn on those assets.
7. See Congressional Budget Office, Effects of Physical Infrastructure Spending on the Economy and the Budget Under Two Illustrative Scenarios (August 2021), www.cbo.gov/publication/57327.
8. Some people might also expect policymakers to raise taxes or cut spending to cover the cost of the additional debt, and they might increase their saving to prepare for paying higher taxes or receiving less in benefits. See Jonathan Huntley, The Long-Run Effects of Federal Budget Deficits on National Saving and Private Domestic Investment, Working Paper 2014-02 (Congressional Budget Office, February 2014), www.cbo.gov/publication/45140.
9. See Congressional Budget Office, Effects of Physical Infrastructure Spending on the Economy and the Budget Under Two Illustrative Scenarios (August 2021), www.cbo.gov/publication/57327, and The Macroeconomic and Budgetary Effects of Federal Investment (June 2016), www.cbo.gov/publication/51628.
10. Even though growing debt could reduce national income by adding to foreign holdings of federal debt, national income in the United States would not necessarily be higher if foreign investors reduced their holdings of U.S. Treasury securities (or other U.S. assets). The net effect on national income of a reduction in purchases of federal debt by foreign investors is unclear. When foreign holdings of U.S. debt decline, interest payments to foreign investors decrease. That leads to an increase in net international income as national income rises. However, the increase in national income associated with the greater net international income is offset by decreases in national income that result from higher interest rates stemming from the reduction in demand for U.S. Treasury securities.
11. See Congressional Budget Office, Budgetary Effects of Climate Change and of Potential Legislative Responses to It (April 2021), www.cbo.gov/publication/57019.
12. For the agency’s latest demographic projections, see Congressional Budget Office, The Demographic Outlook: 2024 to 2054 (January 2024), www.cbo.gov/publication/59697.
13. The labor force consists of people age 16 or older in the civilian noninstitutionalized population who have jobs or who are unemployed (available for work and either seeking work or expecting to be recalled from a temporary layoff).
Chapter 2: Spending and Revenues
Overview
In the Congressional Budget Office’s projections, deficits measured in relation to the size of the economy grow larger over the next 30 years because, under current law, spending exceeds revenues in 2024 and then increases faster than revenues over the subsequent 30 years. Both federal spending and federal revenues equal a larger percentage of the nation’s gross domestic product (GDP) in coming years than they did, on average, over the past 50 years.
Under current law, total federal outlays would equal 23.1 percent of GDP in 2024, remain near that level through 2028, and then increase each year as a share of the economy, reaching 27.3 percent in 2054, CBO projects.1 From 1974 to 2023, outlays averaged 21 percent of GDP; over the 2024–2054 period, projected outlays average about 25 percent of GDP (see Figure 2-1). The key drivers of that increase over the next 30 years are higher net interest costs, which result from rising interest rates and growing federal debt, and growth in spending on major health care programs, particularly Medicare, which is caused by the rising cost of health care and the aging of the population.
Figure 2-1.
Total Outlays and Revenues
Percentage of GDP

In most years, growth in outlays is projected to outpace growth in revenues, resulting in widening budget deficits.
Data source: Congressional Budget Office. See www.cbo.gov/publication/59711#data.
GDP = gross domestic product.
In CBO’s projections, federal revenues measured as a percentage of GDP fluctuate over the next decade, falling from 17.5 percent of GDP in 2024 (a temporarily boosted level resulting from the collection of certain postponed 2023 tax payments) to 17.1 percent in 2025 before rising to 17.9 percent of GDP in 2027 because of scheduled changes in tax provisions. They remain near that level through 2034 and then rise steadily, reaching 18.8 percent of GDP in 2054. Over the next 30 years, projected revenues average about 18 percent of GDP, about 1 percentage point more than the average over the past 50 years. That increase is mainly driven by the fact that income is projected to grow faster than prices, which leads to an increase in individual income tax receipts.
CBO’s extended baseline projections follow the agency’s 10-year baseline budget projections (which conform to a set of assumptions specified in law) and then extend most of the concepts underlying those projections for an additional 20 years. (For a description of the specifications underlying the projections, see Appendix A.)
Spending
Federal spending in the United States, measured in relation to the size of the economy, has exceeded the 27.3 percent projected for 2054 in only two periods—for a three-year span during World War II and for two years during the coronavirus pandemic. From 1943 to 1945, when defense expenditures increased sharply, total federal spending topped 40 percent of GDP. In 2020 and 2021, pandemic-related spending boosted total outlays to roughly 30 percent of GDP.
The government’s spending falls into three broad categories: mandatory spending, discretionary spending, and net outlays for interest.2 In CBO’s projections:
- Mandatory spending, measured in relation to the size of the economy, rises steadily from 13.9 percent in 2024 to 16.2 percent of GDP in 2054, largely driven by growth in outlays for major health care programs.
- Discretionary spending amounts to 6.2 percent of GDP in 2024, declines to 4.9 percent in 2036, and then is assumed to remain roughly constant through 2054 (see Figure 2-2).
- Net outlays for interest more than double—from 3.1 percent of GDP in 2024 to 6.3 percent of GDP in 2054. If such outlays followed their projected path, they would exceed all mandatory spending other than that for major health care programs and Social Security by 2024, all discretionary outlays by 2044, and all spending on Social Security by 2051.
Figure 2-2.
Outlays, by Category
Percentage of GDP

Over the long term, net outlays for interest and spending on the major health care programs and Social Security are projected to rise in relation to GDP; other spending, in total, is projected to decline.
Data source: Congressional Budget Office. See www.cbo.gov/publication/59711#data.
GDP = gross domestic product.
a. Consists of outlays for Medicare (net of premiums and other offsetting receipts), Medicaid, and the Children’s Health Insurance Program, as well as premium tax credits for health insurance purchased through the marketplaces established under the Affordable Care Act and related spending. The premium tax credits subsidize the purchase of health insurance. Related spending is spending to subsidize health insurance provided through the Basic Health Program and to stabilize premiums for health insurance purchased by individuals and small employers.
b. Consists of all mandatory spending other than that for Social Security and the major health care programs. “Other Mandatory” includes the refundable portions of the earned income tax credit, the child tax credit, and the American Opportunity Tax Credit.
CBO projects that by 2054, growth in outlays for major health care programs and interest would reshape the spending patterns of the U.S. government (see Figure 2-3). Net interest costs would account for a much greater portion of total federal spending in 2054 than in 2024. And the share of noninterest spending accounted for by major health care programs and Social Security would increase from about half in 2024 to about two-thirds in 2054.
Figure 2-3.
Composition of Outlays, 2024 and 2054
Percent
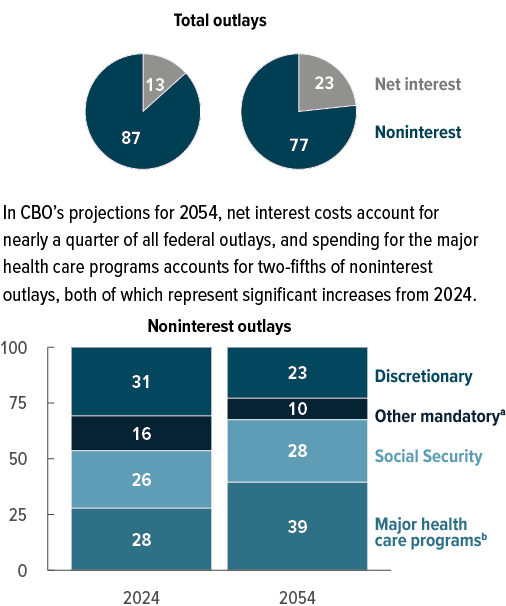
Data source: Congressional Budget Office. See www.cbo.gov/publication/59711#data.
a. Consists of all mandatory spending other than that for Social Security and the major health care programs. “Other Mandatory” includes the refundable portions of the earned income tax credit, the child tax credit, and the American Opportunity Tax Credit.
b. Consists of outlays for Medicare (net of premiums and other offsetting receipts), Medicaid, and the Children’s Health Insurance Program, as well as premium tax credits for health insurance purchased through the marketplaces established under the Affordable Care Act and related spending. The premium tax credits subsidize the purchase of health insurance. Related spending is spending to subsidize health insurance provided through the Basic Health Program and to stabilize premiums for health insurance purchased by individuals and small employers.
Mandatory Spending
In CBO’s extended baseline projections, the growth in mandatory spending is driven by increased spending on major health care programs and, especially in the first decade, on Social Security. Other mandatory spending declines in relation to GDP over the next 30 years.
Spending on major health care programs climbs largely because, in CBO’s estimation, health care costs per person will continue to rise. The aging of the population also contributes to growth in spending on health care programs and on Social Security. In 2024, for people age 65 or older, outlays for Social Security, Medicare, and Medicaid amount to 40 percent of all federal noninterest spending; in 2054, such outlays amount to more than 50 percent of all noninterest spending.
Major Health Care Programs. Spending for major health care programs consists of outlays for Medicare, Medicaid, and the Children’s Health Insurance Program (CHIP), as well as premium tax credits for health insurance purchased through the marketplaces established under the Affordable Care Act and related spending.3 Net federal spending on those programs increases from 5.6 percent of GDP in 2024 to 8.3 percent of GDP in 2054 in CBO’s projections.
The primary driver of that increase is spending on Medicare, which provides health insurance to 67 million people (86 percent of whom are at least 65 years old). Medicare spending (net of offsetting receipts, which are mostly premiums paid by enrollees) grows by 2.2 percentage points during the period, reaching 5.4 percent of GDP in 2054 (see Figure 2-4). Spending on the other major health care programs—that is, on Medicaid, CHIP, and premium tax credits and related spending—grows by 0.4 percentage points over the next three decades, reaching 2.8 percent of GDP in 2054.
Figure 2-4.
Composition of Outlays for the Major Health Care Programs
Percentage of GDP
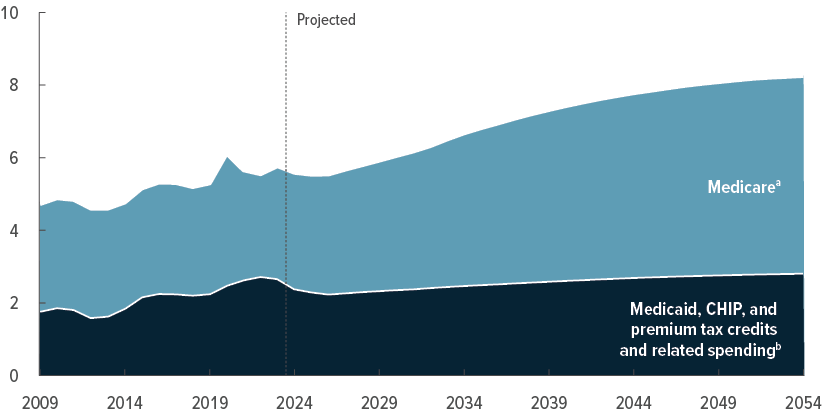
Growth in spending on Medicare is projected to account for more than two-thirds of the increase in spending on the major health care programs over the next 30 years.
Data source: Congressional Budget Office. See www.cbo.gov/publication/59711#data.
CHIP = Children’s Health Insurance Program; GDP = gross domestic product.
a. Net of premiums and other offsetting receipts.
b. Premium tax credits subsidize the purchase of health insurance through the marketplaces established under the Affordable Care Act. Related spending is spending to subsidize health insurance provided through the Basic Health Program and to stabilize premiums for health insurance purchased by individuals and small employers.
As a result, in CBO’s projections, spending on Medicare accounts for over half of all spending on the major health care programs in 2024 and over two-thirds of it in 2054. The projected growth in Medicare spending in relation to the size of the economy over the next three decades stems largely from rising health care costs per person and demographic trends (which are discussed below).
The Hospital Insurance (HI) Trust Fund is used to pay for benefits under Medicare Part A, which covers inpatient hospital services, care provided in skilled nursing facilities, home health care, and hospice care.4 The HI trust fund derives income from several sources. About 80 percent of HI trust fund income comes from the Medicare payroll tax, roughly 10 percent comes from income taxes on Social Security benefits, and the rest comes from other sources. CBO’s projections reflect the assumption—specified in law—that Medicare will continue to pay for benefits under Part A, regardless of the status of the program’s trust fund.5
One measure of the financial position of Part A is the projected timing of the HI trust fund’s exhaustion. In CBO’s projections, the fund’s balance generally increases through 2029, after which time expenditures begin to outstrip income. As a result, the HI trust fund would be exhausted in 2035. Although CBO assumes in its projections that benefits will be paid as scheduled, once the HI trust fund was exhausted, by law total payments to health plans and providers for services covered under Part A would be limited to the amount of income subsequently credited to the fund.
CBO has estimated the amounts by which spending would have to be reduced for the trust fund’s outlays to match its revenues in each year after the trust fund was exhausted. In relation to CBO’s baseline projections, benefits would need to be reduced by 13 percent in 2036, a reduction that would climb to 33 percent in 2054. It is unclear what changes the Centers for Medicare & Medicaid Services could make to operate the Part A program under those circumstances.
Another measure of the financial position of the HI trust fund is its actuarial balance, which summarizes the fund’s current balance and annual future streams of revenues and outlays as a single number.6 (A negative actuarial balance is called an actuarial deficit.) In CBO’s projections, the HI trust fund’s 25-year actuarial deficit amounts to 0.6 percent of taxable payroll (or 0.3 percent of GDP).7 In other words, the government could pay for the services prescribed by current law and maintain the necessary trust fund balance through 2048 if the HI payroll tax rate, which is currently 2.9 percent, was raised immediately and permanently by 0.6 percentage points. Other ways to maintain the necessary trust fund balance include reducing payments, combining tax increases with payment reductions, or transferring money to the trust fund by amounts equivalent to 0.6 percent of taxable payroll.
Social Security. In CBO’s projections, spending on Social Security over the next 10 years continues the trend of the past five decades, increasing as a percentage of GDP—from 5.2 percent in 2024 to 5.9 percent in 2034. It then fluctuates around 5.9 percent of GDP through 2054.
In nominal terms, spending on Social Security increases over the next 30 years. Through 2034 it grows faster than nominal GDP; therefore, spending on Social Security as a percentage of GDP rises. After 2034, such spending grows at about the same rate as GDP, so spending on Social Security as a percentage of GDP does not change significantly.
From 2024 to 2034, the number of Social Security beneficiaries increases by about 12 million, from 68 million (or 20 percent of the population) to 80 million (or 22 percent of the population). Over the next 20 years, the number of beneficiaries continues to increase, though more slowly, increasing by 16 million during that period, to 96 million in 2054 (or 25 percent of the population). The rate of increase in the number of beneficiaries slows after 2034 in part because the youngest members of the large baby boom generation turn 70—the age by which nearly everyone claims Social Security benefits—that year.8
The Social Security program is funded by dedicated tax revenues from two sources. Currently, 96 percent of the funding comes from a payroll tax on annual earnings below a certain amount ($168,600 in 2024); the rest is collected from income taxes on Social Security benefits. Revenues from the payroll tax and the income tax on benefits are credited to the Old-Age and Survivors Insurance (OASI) Trust Fund and the Disability Insurance (DI) Trust Fund, which finance the program’s benefits. In CBO’s extended baseline projections, dedicated tax revenues for the two trust funds decline from 4.6 percent of GDP in 2024 to 4.4 percent in 2054.9 The decline occurs in part because projected earnings grow faster for high earners than for low earners, so a larger share of earnings exceeds the maximum taxable amount for Social Security and a smaller share is taxable.
A commonly used measure of Social Security’s financial position is the dates by which the trust funds would be exhausted.10 CBO projects that, under current law, the OASI trust fund would be exhausted in fiscal year 2033 and the DI trust fund would be exhausted after the 30-year projection period. If their balances were combined, the Old-Age, Survivors, and Disability Insurance (OASDI) trust funds would be exhausted in fiscal year 2034.
CBO has estimated the amounts by which annual benefits would have to be reduced for the trust funds’ outlays to match their revenues in each year after the trust funds were exhausted. If the trust fund balances were combined, OASI and DI benefits would need to be reduced (in relation to CBO’s baseline projections) by 21 percent in 2035, a reduction that would climb to 25 percent in 2054. (In CBO’s projections, spending on Social Security continues as scheduled regardless of the amounts in the program’s trust funds.)
If the two funds were treated as separate entities, as under current law, and the transfer of resources between funds was not permitted, the reductions in benefits for OASI would begin earlier. CBO estimates that OASI benefits would need to be reduced by 25 percent in 2034. In 2054, they would need to be reduced by 27 percent. DI benefits would not face reductions in the projection period.
Other Mandatory Programs. Other mandatory spending (that is, mandatory spending excluding outlays for the major health care programs and Social Security) includes outlays for the Supplemental Nutrition Assistance Program (SNAP), unemployment compensation, retirement programs for federal civilian and military employees, certain programs for veterans, Supplemental Security Income, and certain refundable tax credits.11 Except for during the pandemic, such spending has generally remained between 2 percent and 4 percent of GDP since the mid-1960s. (It was 3.1 percent of GDP in 2023, for example.)12
In CBO’s projections, spending on other mandatory programs totals 3.1 percent of GDP in 2024. It then declines as a share of the economy, falling to 2.5 percent of GDP in 2034 and 2.0 percent in 2054.13 (Spending on other mandatory programs averaged 2.4 percent of GDP over the past 50 years.)
The projected decline through 2034 occurs in part because the benefit amounts for many of the programs are adjusted for inflation each year—and in CBO’s economic forecast, inflation is less than the rate of growth in nominal GDP (that is, GDP measured in current-year dollars). After 2034, spending on other mandatory programs, excluding that on refundable tax credits, is projected to decline as a percentage of GDP at roughly the same annual rate at which it is projected to decline between 2031 and 2034.
Outlays for refundable tax credits are estimated through 2054 as part of the revenue projections. Those decline because of the expiration of energy- and coronavirus- related refundable tax credits and because of projected growth in income, which pushes more taxpayers above the range of income in which they would be eligible for some refundable credits.
Causes of Growth in Mandatory Spending. Rising health care costs per person and the aging of the population are the two main reasons for the sharp increase in projected spending on the major health care programs over the next 30 years. The aging of the population also leads to an increase in spending on Social Security. All told, if the population was not aging (that is, if the age distribution of the population remained as it is in 2024), spending in 2054 on the major health care programs and Social Security would be 0.7 percent of GDP less than CBO projects.
CBO assessed the combined effects of those two factors by projecting what would occur over the 2024–2054 period if health care costs per person (adjusted to remove the effects of demographic changes, such as the aging of the population) grew at the rate of potential GDP per person—which would mean that costs grew more slowly than the agency currently projects—and the average age of the population was not increasing.14 Under those conditions, spending on the major health care programs would be 6.0 percent of GDP in 2054, or 0.3 percentage points lower than the agency currently projects for 2024. And if the effects of the aging of the population alone were excluded, then spending on Social Security would be 4.7 percent of GDP in 2054, 0.4 percentage points lower than the agency projects for 2024 (see Figure 2-5).
Figure 2-5.
Composition of Growth in Outlays for the Major Health Care Programs and Social Security, 2024 to 2054
Percentage of GDP
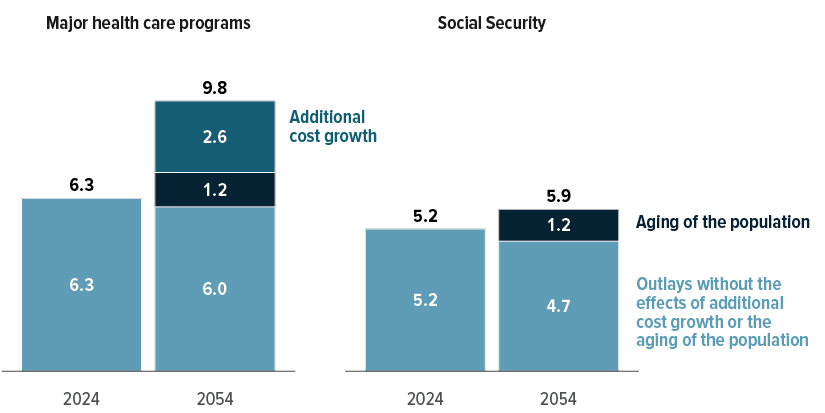
Growth in spending on the major health care programs is largely driven by cost growth above and beyond that accounted for by demographic changes and the growth of potential GDP per person. Spending on those programs, as well as spending on Social Security benefits, is also boosted by the aging of the population.
Data source: Congressional Budget Office. See www.cbo.gov/publication/59711#data.
The spending on the major health care programs examined here consists of gross spending on Medicare (which does not account for premiums or other offsetting receipts), Medicaid, and the Children’s Health Insurance Program, as well as premium tax credits for health insurance purchased through the marketplaces established under the Affordable Care Act and related spending. The premium tax credits subsidize the purchase of health insurance. Related spending is spending to subsidize health insurance provided through the Basic Health Program and to stabilize premiums for health insurance purchased by individuals and small employers.
Additional cost growth is the extent to which the growth rate of nominal health care spending per person (adjusted to remove the effects of demographic changes) exceeds the growth rate of potential GDP per person. Potential GDP is the maximum sustainable output of the economy.
GDP = gross domestic product.
Rising Health Care Costs per Person. In CBO’s projections for the second and third decades of the projection period, the average growth rate of federal health care spending per beneficiary (adjusted to remove the effects of demographic changes) increases faster than the 3.4 percent growth rate of potential GDP per person—1.0 percent faster for Medicare and 0.8 percent faster for Medicaid, on average.15 That growth in health care costs per person accounts for over two-thirds of the increase in spending, measured as a percentage of GDP, on the major health care programs from 2024 to 2054.16
Aging of the Population. Over the 2024–2054 period, about one-third of the projected increase in total spending on the major health care programs, measured as a percentage of GDP, is attributable to the aging of the population. The increase primarily results from greater spending on Medicare because Medicare is the largest of those programs and most beneficiaries qualify for it at age 65. (See Figure 3-2 for CBO’s projections of the population by age group.)17 As the group of people who qualify for Medicare becomes larger and, on average, older, Medicare spending will grow, not only because of the greater number of beneficiaries but also because spending on health care tends to increase as people age.
From 2024 to 2054, all of the projected increase in spending on Social Security, measured as a percentage of GDP, is attributable to the aging of the population.18 (In fact, if the population was not aging, then outlays for Social Security over the 2024–2054 period would decrease as a percentage of GDP.) The effects of that aging, which push spending on Social Security up, are partially offset by increases in the full retirement age for Social Security, which reduce lifetime benefits for affected beneficiaries and thus push spending down.19
Discretionary Spending
In CBO’s long-term projections, discretionary outlays through 2034 follow the agency’s 10-year baseline projections.20 From 2024 to 2034, in CBO’s projections, about half of all discretionary outlays, on average, are dedicated to national defense, largely reflecting the allocation in 2024. The rest are for nondefense spending, which comprises outlays for an array of federally funded activities and programs. After 2034, discretionary spending is assumed to transition (over a five-year period) to grow at the rate of nominal GDP.
Discretionary spending generally decreases as a percentage of GDP—falling from 6.2 percent in 2024 to 4.9 percent in 2036 and remaining at about that level through 2054. Its level from 2036 to 2054 is lower than any percentage recorded since 1962, the first year for which the Office of Management and Budget reports such data.
Net Outlays for Interest
Over the past 50 years, the government’s net interest costs have ranged from 1.2 percent to 3.2 percent of GDP, averaging 2.1 percent. In CBO’s projections, those costs amount to 3.1 percent of GDP in 2024. In 2034, they increase to 3.9 percent of GDP as federal debt grows and interest rates rise. Net outlays for interest continue to increase thereafter and reach 6.3 percent of GDP in 2054. They would be greater in that year than spending on Social Security, on discretionary outlays, or on all mandatory spending other than that for the major health care programs and Social Security—and more than twice the largest percentage of GDP observed since at least 1940 (the first year for which the Office of Management and Budget reports such data).
The projected increase in net outlays for interest is the result of escalating interest rates and the rising amount of debt. In CBO’s projections, the average interest rate on federal debt held by the public is 3.1 percent in 2024 and 3.8 percent in 2054. The increase in the average interest rate accounts for about two-thirds of the rise in net interest costs over the 2024–2054 period.21
Revenues
In CBO’s projections, revenues measured as a percentage of GDP fluctuate over the next decade, temporarily increasing in 2024 as a result of the collection of certain postponed 2023 tax payments and then declining in 2025. Receipts are projected to subsequently rise as a percentage of GDP in 2026 and 2027 because of scheduled changes in tax provisions. Revenues remain stable through 2034 and then increase steadily from 2034 to 2054, mainly because growth in income boosts individual income tax receipts. Measured in relation to the size of the economy, revenues are higher in each year after 2025 than their average over the past 50 years.22
Projected Revenues
In CBO’s projections, total revenues amount to 17.5 percent of GDP in 2024, up from 16.5 percent last year. After a temporary boost to receipts in 2024 from certain tax payments that were postponed from 2023, revenues decline to 17.1 percent of GDP in 2025. Revenues rise in relation to GDP after 2025 because of changes to provisions governing the individual income tax that are scheduled to occur at the end of that calendar year.
From 2024 to 2054, total revenues measured as a percentage of GDP grow by 1.3 percentage points in CBO’s projections, reaching 18.8 percent of GDP by the end of the period. That growth is mainly driven by an increase in individual income tax receipts. Although receipts of individual income taxes initially fluctuate, they grow steadily after 2025 and amount to 10.3 percent of GDP in 2054—1.5 percentage points higher than their value in 2024 (see Figure 2-6). The growth in individual income tax receipts is partially offset by declining receipts (relative to GDP) from corporate income taxes and payroll taxes, which decrease by 0.7 percentage points and 0.1 percentage point, respectively, over the next three decades. Receipts from other sources increase by 0.5 percent of GDP, primarily because remittances to the Treasury from the Federal Reserve increase.
Figure 2-6.
Revenues, by Source
Percentage of GDP
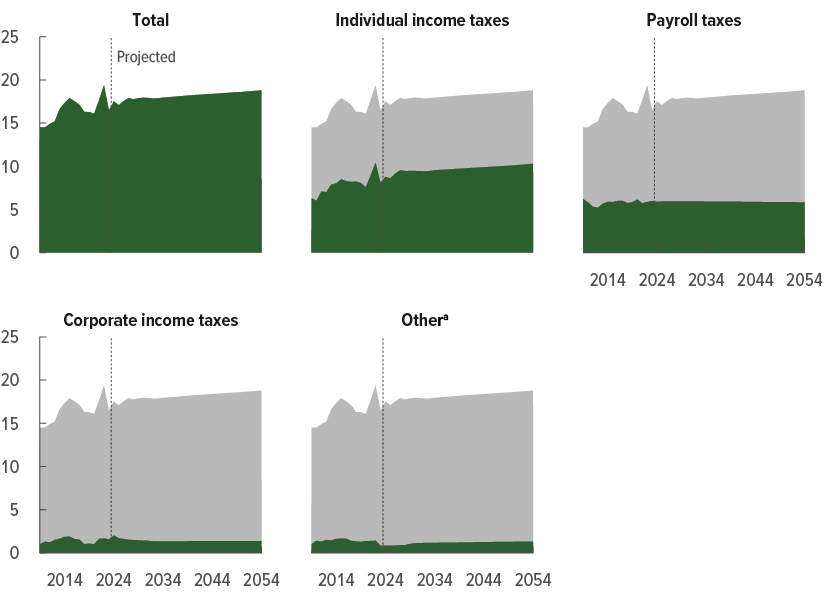
Measured as a percentage of GDP, total revenues grow by about 1 percentage point from 2024 to 2054 in CBO’s projections, driven mainly by an increase in individual income tax receipts. Receipts from payroll and corporate taxes, measured in relation to the economy, decline by a small amount over the 30-year period.
Data source: Congressional Budget Office. See www.cbo.gov/publication/59711#data.
GDP = gross domestic product.
a. Consists of excise taxes, remittances to the Treasury from the Federal Reserve System, customs duties, estate and gift taxes, and miscellaneous fees and fines.
Factors Affecting Revenues
The projected increase over the next 30 years in total revenues, measured as a percentage of GDP, stems from several factors, including real bracket creep and scheduled changes to individual tax provisions. Those factors are partially offset by other factors—including growing health care costs and the end of a temporary boost in receipts from delayed tax payments—that cause revenues to decrease, on net (see Figure 2-7).
Figure 2-7.
Key Factors Contributing to Changes in Revenues
Percentage of GDP
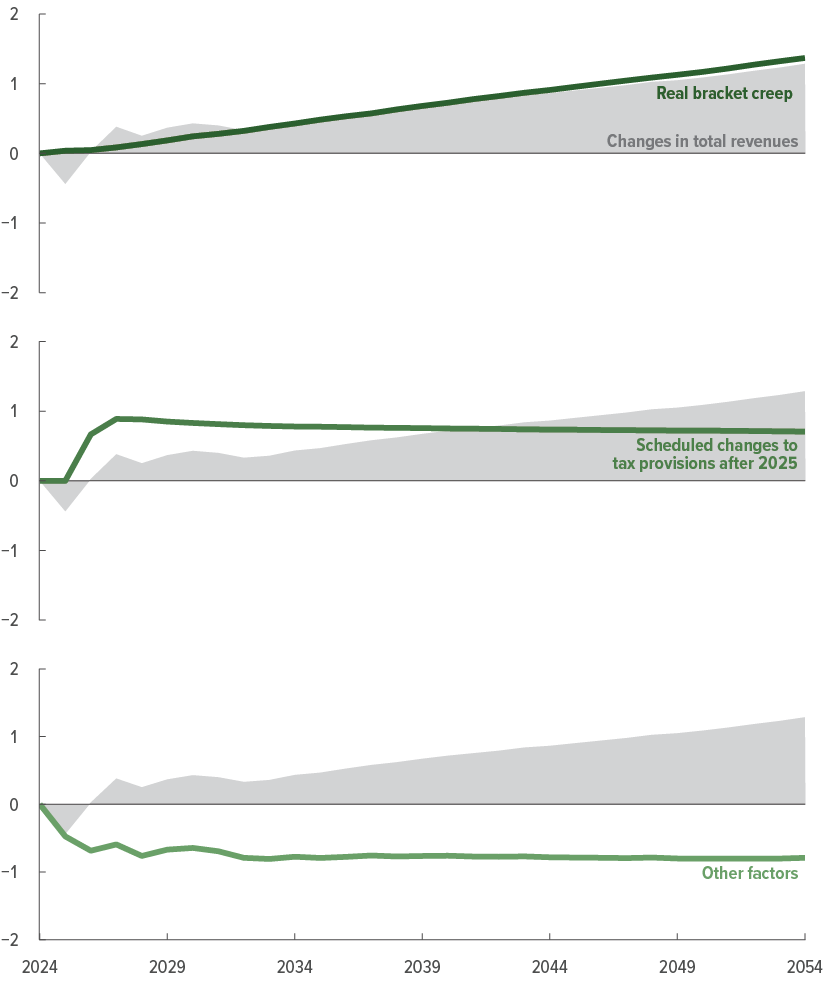
In CBO’s projections, the largest source of growth in tax revenues over the long term is real bracket creep—the process in which, as income rises faster than prices, a larger proportion of income becomes subject to higher tax rates.
In 2026 and 2027, revenues from individual income taxes grow as a result of the scheduled expiration of certain provisions of the 2017 tax act.
Several other factors cause revenues to decline, including growth in health care costs, the end of a temporary boost to receipts in 2024 from certain postponed 2023 tax payments, and a decline in corporate income tax receipts.
Data source: Congressional Budget Office. See www.cbo.gov/publication/59711#data.
GDP = gross domestic product.
Real Bracket Creep. The income thresholds for the various tax rate brackets in the individual income tax system are indexed to increase with inflation (as measured by the chained consumer price index for all urban consumers, published by the Bureau of Labor Statistics). In CBO’s projections, nominal income grows faster than prices, so more income is pushed into higher tax brackets even when the underlying distribution of income remains unchanged. Many other parameters of the tax system are also indexed for inflation, including the amounts of the standard deduction and the earned income tax credit. But certain parameters, such as the amount of the child tax credit, are fixed in nominal dollars and are not adjusted for inflation. The individual income tax system is thus not indexed for real growth (that is, growth beyond the rate of inflation). The process by which real growth pushes income into higher brackets and more taxpayers above the range of income in which they would be eligible for some credits is called real bracket creep. That phenomenon is the largest source of growth in total projected revenues over the next three decades.
If current laws generally remained unchanged, real bracket creep would continue to gradually boost taxes in relation to income through 2054, CBO projects, thereby increasing tax receipts by 1.4 percent of GDP. From 2034 to 2054, the share of income in the highest income bracket (taxed at the top rate of 39.6 percent) would rise by 2 percentage points, and the share of income excluded from taxation (mostly because of exemptions and deductions) would fall by 3 percentage points (see Figure 2-8).23
Figure 2-8.
Shares of Income Taxed at Different Rates Under the Individual Income Tax System
Percent

Most of the long-term growth in revenues in CBO’s projections is attributable to the increasing share of individual income that is pushed into higher tax brackets as income rises faster than prices. The share of income taxed at higher rates grows, and the share exempt from taxation shrinks.
Data source: Congressional Budget Office. See www.cbo.gov/publication/59711#data.
In this figure, income refers to adjusted gross income—that is, income from all sources not specifically excluded by the tax code, minus certain deductions. The income tax rate is the statutory rate specified under the individual income tax system. The lowest statutory tax rate is zero (because of deductions and exemptions).
Scheduled Changes to Individual Income Tax Provisions After 2025. Under current law, nearly all the provisions of the 2017 tax act (Public Law 115-97) affecting the individual income tax are scheduled to expire at the end of calendar year 2025. In CBO’s projections, those changes, taken together, boost tax revenues in relation to income. Once in effect, the scheduled changes would lead to higher statutory tax rates, a smaller standard deduction, the return of personal exemptions, and a reduction in the child tax credit. Those changes would cause tax liabilities (the amounts taxpayers owe) to rise beginning in calendar year 2026, pushing up receipts in fiscal year 2026 and beyond. CBO projects that by 2054, the scheduled changes would boost individual income tax revenues, measured as a percentage of GDP, by 0.7 percentage points.
Other Factors. Several other factors affect projected revenues. On net, those factors cause revenue to decline by 0.8 percent of GDP from 2023 to 2054.
One such factor is the growth in health care costs, which is projected to reduce revenues by 0.6 percent of GDP over the next three decades. The share of employees’ compensation that is paid in the form of fringe benefits, such as employment-based health insurance, is projected to increase, and those benefits are generally not taxable. Consequently, the share of employees’ compensation that is paid in the form of wages and salaries, which are subject to income and payroll taxes, is projected to decline. That shift in compensation would decrease taxable income—and thus revenues from both income and payroll taxes—in relation to GDP.
Another factor causing receipts to decline is the end of a temporary boost to tax receipts observed in 2024 caused by delayed tax payments. The IRS postponed some filing and payment deadlines for taxpayers in areas affected by natural disasters (including most of California), The IRS also granted penalty relief to corporations that did not make estimated payments for a new corporate alternative minimum tax, set to begin in 2023. Both actions led to some tax payments being made in 2024 that would otherwise have been made in 2023. The end of that temporary boost leads to a drop in revenues of 0.4 percent of GDP in 2025 that persists throughout the projection period.
A final factor causing receipts to decline is a decrease in corporate income tax receipts for reasons other than the aforementioned postponement of filing and payment deadlines. Corporate income tax receipts are projected to fall from 2.0 percent of GDP in 2024 to 1.3 percent of GDP in 2034 and then remain at roughly that level through 2054. About 0.4 percentage points of that decline is attributable to a projected decrease in profits on businesses’ domestic activity and the varying effects over time of provisions of the 2017 tax act and the 2022 reconciliation act.
Partially offsetting those effects are a few factors that cause receipts to rise. One is that the Federal Reserve is anticipated to begin once again remitting significant amounts to the Treasury. Those remittances, which are recorded as revenues, are near zero in 2024 but are expected to rise to 0.6 percent of GDP by 2054. Another factor is a change in the distribution of earnings, which are projected to continue to grow faster for higher- earning people than for other people in the long term. That trend would cause a larger share of individual earnings to be taxed at higher rates. However, the resulting increase in individual income tax revenues would be largely offset by a decrease of nearly the same amount in payroll tax receipts, CBO projects, because the share of earnings above the maximum amount subject to Social Security payroll taxes would grow.24
1. Deficits and outlays have been adjusted to exclude the effects of shifts that occur in the timing of certain payments when the fiscal year begins on a weekend. The long-term budget projections in this report are based on CBO’s February 2024 baseline budget and economic projections and the demographic projections that the agency published on January 18, 2024. For more details, see Congressional Budget Office, The Budget and Economic Outlook: 2024 to 2034 (February 2024), www.cbo.gov/publication/59710, and The Demographic Outlook: 2024 to 2054 (January 2024), www.cbo.gov/publication/59697.
2. Mandatory spending includes outlays for most federal benefit programs and for certain other payments to people, businesses, nonprofit institutions, and state and local governments. Such outlays are generally governed by statutory criteria and are not normally constrained by the annual appropriation process. Discretionary spending encompasses an array of federal activities funded through or controlled by appropriations. That category includes most defense spending and spending for many nondefense activities, such as elementary and secondary education, housing assistance, international affairs, the administration of justice, and highway programs. In the federal budget, net outlays for interest consist of the government’s interest payments on federal debt, offset by interest income that the government receives.
3. The premium tax credits subsidize the purchase of health insurance. Related spending is spending to subsidize health insurance provided through the Basic Health Program and spending to stabilize premiums for health insurance purchased by individuals and small employers.
4. Medicare’s other trust fund, the Supplementary Medical Insurance (SMI) Trust Fund, is used to pay for outpatient services (including physicians’ services) and prescription drugs under Parts B and D of the program. The SMI trust fund differs from the HI trust fund in that most of its income does not come from a specified set of revenues collected from the public. Rather, most of the SMI fund’s income is in the form of transfers from the general fund of the Treasury, which are automatically adjusted to cover the differences between the program’s spending and specified revenues. Thus, the balance in the SMI fund cannot be exhausted.
5. Provisions in section 257 of the Deficit Control Act require CBO to project spending for certain programs, including Medicare and Social Security, under the assumption that they will be fully funded, and thus able to make all scheduled payments, even if the trust funds associated with those programs do not have sufficient resources to make full payments. See sec. 257(b)(1) of the Balanced Budget and Emergency Deficit Control Act of 1985, Public Law 99-177 (codified at 2 U.S.C. §907(b)(1)).
6. The actuarial balance is the sum of the present value of projected income and the current trust fund balance minus the sum of the present value of projected outlays and a year’s worth of benefits at the end of the period. (The present value expresses a flow of current and future income or payments in terms of an equivalent lump sum received or paid today.) For the HI trust fund, that difference is presented in this report as a percentage of the present value of taxable payroll or of GDP over 25 years.
7. Taxable payroll is the total amount of earnings (wages and self-employment income) that is subject to the payroll tax.
8. The baby boom generation comprises people born between 1946 and 1964.
9. The Social Security trust funds are also credited with interest on their balances.
10. Another commonly used measure of Social Security’s financial position is the program’s actuarial balance, often measured over 75 years. CBO will release updated projections about Social Security’s financial position later this year.
11. Refundable tax credits reduce a filer’s overall income tax liability; if the credit exceeds the filer’s income tax liability, the government pays all or some portion of that excess to the taxpayer (and the payment is treated as an outlay in the budget). For more information, see Congressional Budget Office, Refundable Tax Credits (January 2013), www.cbo.gov/publication/43767.
12. That spending increased significantly in 2020 and 2021—to 10.4 percent and 10.6 percent of GDP, respectively—mainly because of policies enacted in response to the pandemic and the related economic downturn. As spending associated with those policies decreased, outlays for the category “other mandatory programs” declined.
13. Section 257(b)(2) of the Balanced Budget and Emergency Deficit Control Act of 1985, which governs CBO’s baseline projections, makes exceptions regarding current law for some programs, such as SNAP, that have expiring authorizations but that are assumed to continue as currently authorized.
14. Potential GDP is the maximum sustainable output of the economy. The analysis of the causes of the growth in spending on the major health care programs encompasses gross spending on Medicare and does not reflect receipts credited to the program from premiums and other sources.
15. The amount by which the growth rate of nominal health care spending per person (adjusted to remove the effects of demographic changes) exceeds the growth rate of potential GDP per person is referred to as additional cost growth in this report. For a discussion of how CBO projects federal spending on health care beyond the 10-year budget window, see Congressional Budget Office, The 2022 Long-Term Budget Outlook (July 2022), Appendix D, www.cbo.gov/publication/57971.
16. To assess how additional cost growth and how the aging of the population would affect spending on the major health care programs, CBO produced estimates of such spending in 2054 under four scenarios: In the first, the age distribution of the population matched that in 2024 and additional cost growth was held at zero. In the second scenario, the agency projected the effect of the aging of the population while holding additional cost growth at zero. In the third, it projected the effect of additional cost growth while holding the age distribution of the population as it was in 2024. And in the fourth scenario, it projected the effects of the aging of the population and additional cost growth. (That last scenario is the one underlying the extended baseline.)
CBO estimated how the aging of the population and additional cost growth would affect projected spending on the major health care programs in three steps. First, to estimate the effects of aging alone, the agency compared the outcome under the second scenario with that under the first scenario. Second, to estimate the effects of additional cost growth alone, the agency compared the outcome under the third scenario with that under the first scenario. Third, to estimate the interaction between those two effects, the agency compared the outcome under the fourth scenario with the sum of the effects of aging alone and of the effects of additional cost growth alone. The agency then allocated that estimate of the interaction to the aging of the population and to additional cost growth proportionally between the two.
17. In this report, population refers to the Social Security area population, which includes all residents of the 50 states and of the District of Columbia, as well as civilian residents of U.S. territories. It also includes federal civilian employees and members of the U.S. armed forces living abroad and their dependents, U.S. citizens living abroad, and noncitizens living abroad who are eligible for Social Security benefits on the basis of their earnings while in the United States.
18. To assess how the aging of the population would affect spending for Social Security, CBO produced estimates using two scenarios: In the first scenario, the age distribution of the population matched that in 2024. In the second scenario (the extended baseline), the population aged as projected. CBO then compared the outcome under the second scenario with that under the first scenario.
19. For more details about the full retirement age for Social Security, see Zhe Li, The Social Security Retirement Age, Report R44670, version 14 (Congressional Research Service, July 6, 2022), https://tinyurl.com/yndurmpa.
20. CBO’s 10-year baseline projections reflect laws that were in place as of January 3, 2024. The continuing resolution then in effect (the Further Continuing Appropriations and Other Extensions Act, 2024) provided funding through January 19 for some federal agencies and through February 2 for the rest. CBO’s baseline incorporates the funding provided by that continuing resolution on an annualized basis—that is, calculated as if the funding provided by the continuing resolution was in effect for the entire fiscal year. Because the resulting amounts exceed the limits, or caps, on discretionary funding for 2024 established by the Fiscal Responsibility Act of 2023 (P.L. 118-5), the total amount of budget authority and the resulting outlays were adjusted to comply with those caps.
21. To determine the change in net interest costs separately attributable to primary deficits (that is, deficits excluding net outlays for interest) and to changes in the average interest rate, CBO started with a benchmark scenario. In that scenario, after 2023, the average interest rate did not change and there were no primary deficits adding to the amount of debt. The agency then estimated the effect on net interest costs of primary deficits (by estimating those deficits without a change in the average interest rate) and of the change in the average interest rate (by estimating those rates without primary deficits). The relative size of those estimates was then used to calculate the percentage of the total increase in net interest costs attributable to the increase in the average interest rate and to primary deficits by proportionally allocating the interaction between those two factors.
22. CBO’s revenue projections are based on the assumption that the rules for all tax sources (individual income taxes, corporate income taxes, payroll taxes, and other taxes) will change as scheduled under current law. The sole exception is expiring excise taxes dedicated to trust funds. The Balanced Budget and Emergency Deficit Control Act of 1985 requires that CBO’s baseline reflect the assumption that those taxes would be extended at their current rates. That law does not stipulate that the baseline include the extension of other expiring tax provisions, even if lawmakers have routinely extended them in the past.
23. For more details, see Congressional Budget Office, “How Income Growth Affects Tax Revenues in CBO’s Long-Term Budget Projections” (June 2019), www.cbo.gov/publication/55368.
24. For additional information, see Brooks Pierce, How Changes in the Distribution of Earnings Affect the Federal Deficit, Working Paper 2021-12 (Congressional Budget Office, October 2021), www.cbo.gov/publication/57217.
Chapter 3: Long-Term Demographic and Economic Projections
Overview
Demographic and economic trends are key determinants of the long-term budget outlook. By the Congressional Budget Office’s estimate, the population will grow more slowly over the next 30 years than it did over the past 30 years. In CBO’s projections, the population would begin to shrink in 2040 without immigration, in part because fertility rates remain below the rate that would be required for a generation to replace itself. The average age of the population also increases (referred to as the aging of the population), largely because fertility rates remain low and mortality rates generally decline.
In the agency’s long-term economic forecast, the nation’s output grows more slowly over the next three decades than it did over the past three. That decline in output growth is the result of slower growth of the labor force and slower accumulation of capital stemming from increased federal borrowing. The labor force is projected to grow more slowly over the next three decades than it did over the past three, largely because of two factors: slower population growth, and a decline in the labor force participation rate attributable to the aging of the population.
In CBO’s projections, inflation slows through 2026 to a rate that is consistent with the Federal Reserve’s long-term goal of 2 percent. Over the 2024–2054 period, interest rates are higher than they were, on average, over the past 30 years. Those higher interest rates are largely the result of upward pressure from projected increases in federal borrowing and in capital income as a share of total income. CBO’s economic projections account for the effects on the economy of projected deficits and of changes in taxes and spending scheduled under current law.
Demographic Projections
The size and age profile of the U.S. population affects the nation’s economy and the federal budget. For example, those two factors are the main determinants of the number of people in the labor force and thus affect both gross domestic product (GDP) and federal tax receipts. Those factors also affect the number of beneficiaries of Social Security and other federal programs and thus federal outlays.
To estimate the population in future years, CBO projects rates of fertility, net immigration, and mortality. (Net immigration is the number of people who enter the United States minus the number who leave.) In the agency’s projections, the population increases from 342 million people at the beginning of 2024 to 383 million at the beginning of 2054—an average expansion of 0.4 percent per year.1 That rate is about half the average annual rate of growth over the past 30 years (0.8 percent).2 Moreover, population growth is increasingly driven by immigration, in part because the total fertility rate remains below the rate necessary for a generation to replace itself.3 Beginning in 2040, the population would shrink without immigration, as the number of deaths exceeds the number of births, in CBO’s projections (see Figure 3-1).
Figure 3-1.
Population Growth and the Demographic Factors That Contribute to It
Percent

In CBO’s projections, deaths exceed births beginning in 2040. As a result, without immigration the population would shrink thereafter.
Data source: Congressional Budget Office. See www.cbo.gov/publication/59711#data.
The population referred to in this figure is the Social Security area population, which includes all residents of the 50 U.S. states and the District of Columbia, as well as civilian residents of U.S. territories. It also includes federal civilian employees and members of the U.S. armed forces living abroad and their dependents, U.S. citizens living abroad, and noncitizens living abroad who are eligible for Social Security benefits on the basis of their earnings while in the United States.
The proportion of the population age 65 or older expands over the coming decades in the agency’s projections, continuing a long-standing historical trend (see Figure 3-2). From 2014 to 2023, the percentage of the population age 65 or older increased from 14.2 percent to 17.5 percent, driven largely by the aging of members of the baby boom generation (comprising people born between 1946 and 1964), who started to turn 65 in 2011. That percentage continues to increase in the agency’s projections, rising from 17.8 percent in 2024 to 20.5 percent in 2034 and 22.3 percent in 2054.
Figure 3-2.
Population, by Age Group
Millions of people
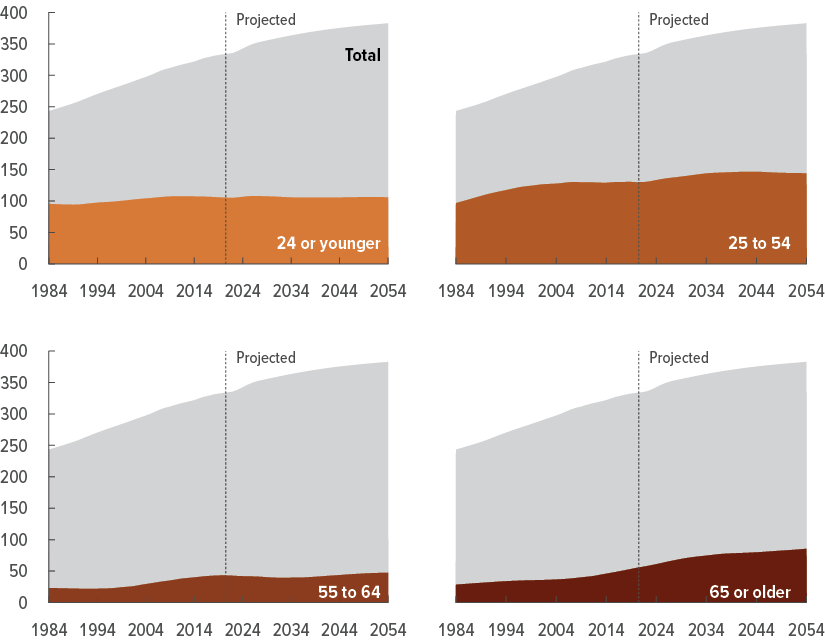
The number of people ages 25 to 54, which particularly affects the number of people employed, is projected to grow more slowly than the number of people age 65 or older, who are less likely to work and who are generally eligible for Social Security and Medicare.
Data source: Congressional Budget Office. See www.cbo.gov/publication/59711#data.
The population referred to in this figure is the Social Security area population, which includes all residents of the 50 U.S. states and the District of Columbia, as well as civilian residents of U.S. territories. It also includes federal civilian employees and members of the U.S. armed forces living abroad and their dependents, U.S. citizens living abroad, and noncitizens living abroad who are eligible for Social Security benefits on the basis of their earnings while in the United States.
Economic Projections
The state of the U.S. economy in coming decades will affect the federal government’s budget deficits and debt. Key to CBO’s long-term budget projections are its long-term projections of GDP, labor force participation, inflation, and interest rates. Among the factors incorporated in the agency’s long-term economic forecast are the effects of projected deficits on private investment and the effects of marginal tax rates on the supply of labor and private saving.4
Real Potential GDP
In CBO’s extended baseline projections, the growth of real potential GDP slows, falling from an annual average rate of 2.1 percent over the 2024–2034 period to an average of 1.6 percent over the 2045–2054 period. (Real potential GDP is an estimate of the amount of real GDP that can be produced if labor and capital are employed at their maximum sustainable rates. Real GDP is nominal GDP adjusted to remove the effects of changes in prices.) Over the entire 2024–2054 period, real potential GDP increases at an average rate of 1.8 percent per year (see Table 3-1).
Table 3-1.
Average Annual Values for Key Economic Variables That Underlie CBO’s Extended Baseline Projections
Percent
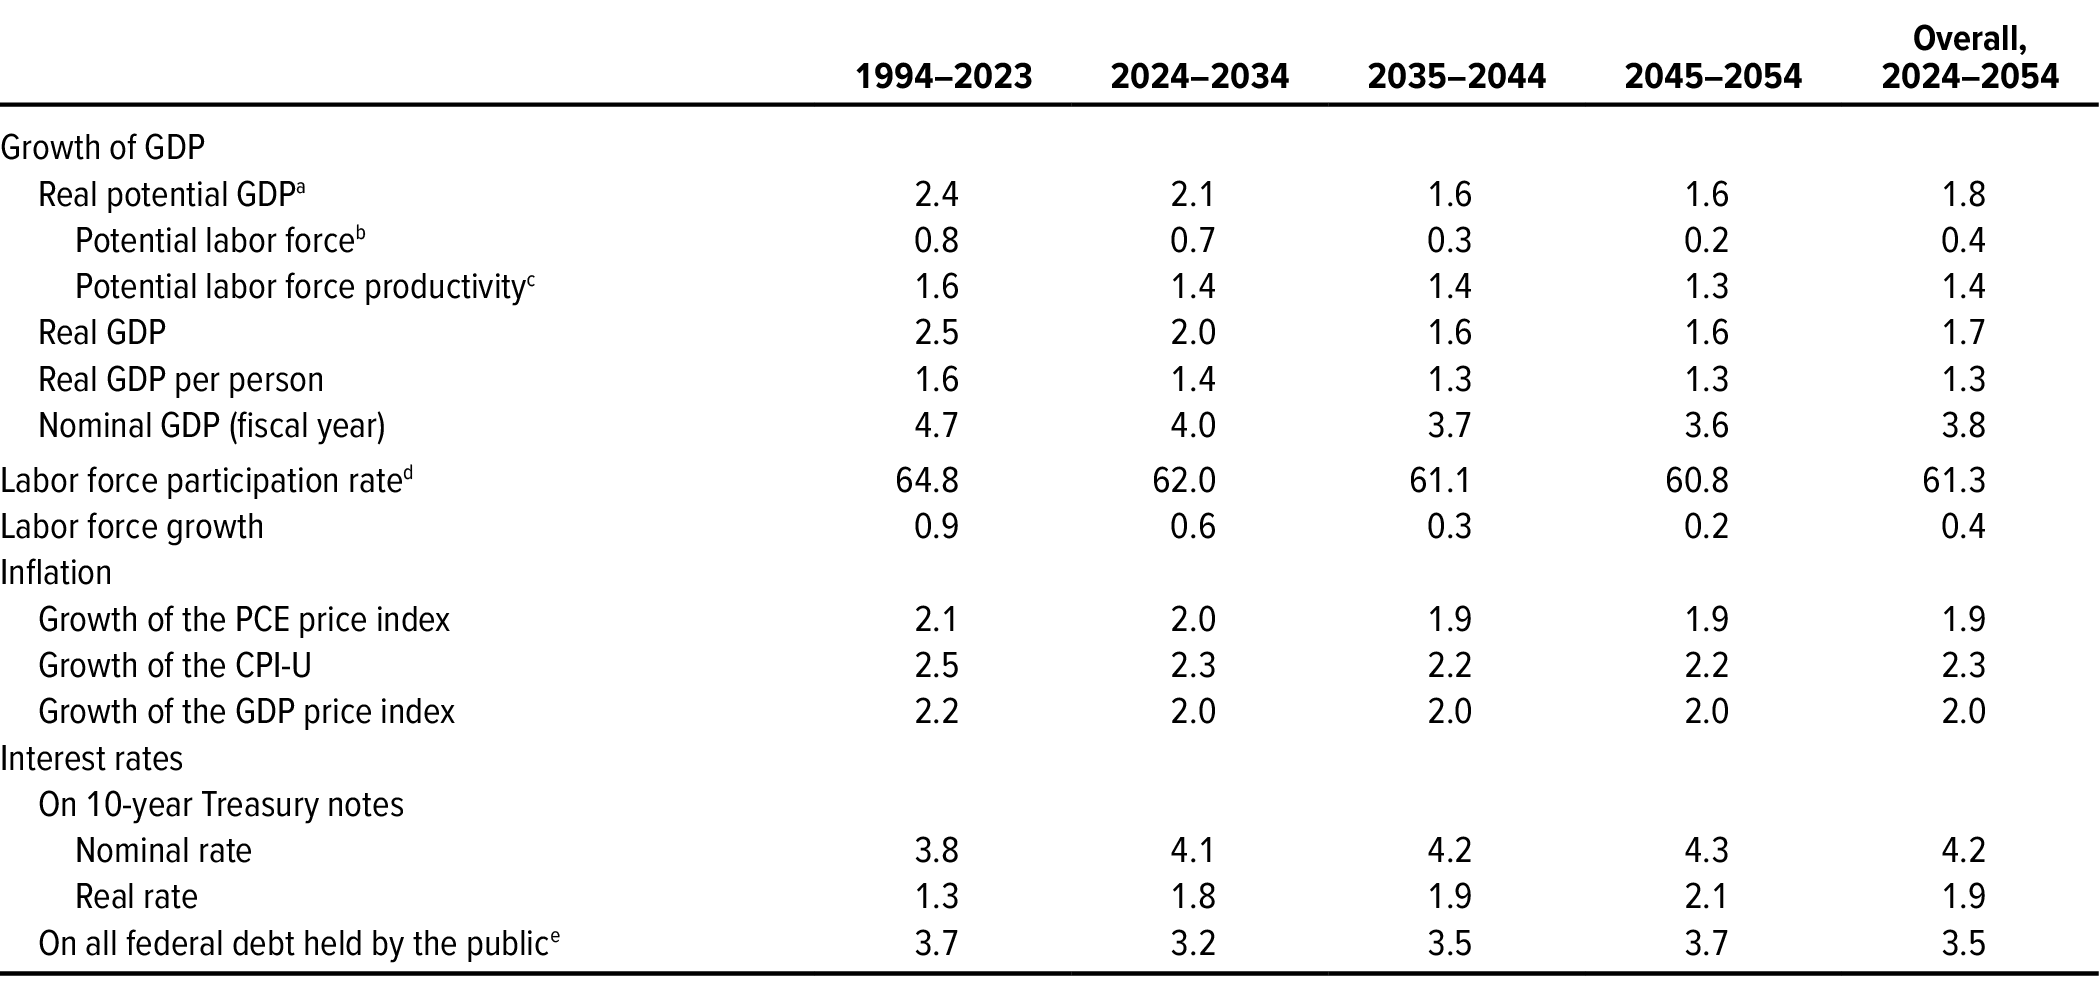
Data sources: Congressional Budget Office; Bureau of Economic Analysis; Bureau of Labor Statistics; Federal Reserve. See www.cbo.gov/publication/59711#data.
Real values are nominal values that have been adjusted to remove the effects of changes in prices.
The labor force consists of people age 16 or older in the civilian noninstitutionalized population who have jobs or who are unemployed (available for work and either seeking work or expecting to be recalled from a temporary layoff). The civilian noninstitutionalized population excludes members of the armed forces on active duty and people in penal or mental institutions or in homes for the elderly or infirm.
CPI-U = consumer price index for all urban consumers; GDP = gross domestic product; PCE = personal consumption expenditures.
a. An estimate of the amount of real GDP that can be produced if labor and capital are employed at their maximum sustainable rates.
b. An estimate of what the size of the labor force would be if economic output and other key variables were at their maximum sustainable amounts.
c. The ratio of real potential GDP to the potential labor force. The sum of growth in the potential labor force and growth in potential labor force productivity is equal to growth in real potential GDP.
d. The percentage of the civilian noninstitutionalized population age 16 or older that is in the labor force.
e. The interest rate on all federal debt held by the public equals net interest payments in the current fiscal year divided by debt held by the public at the end of the previous fiscal year.
That projection represents a slowdown in the annual growth of real potential GDP compared with such growth from 1994 to 2023, when it averaged an estimated 2.4 percent. That slowdown is attributable to slowing growth in the potential labor force (an estimate of what the size of the labor force would be if economic output and other key variables were at their maximum sustainable amounts) and in potential labor force productivity (the ratio of real potential GDP to the potential labor force) over the period (see Figure 3-3).
Figure 3-3.
Average Annual Growth of Real Potential GDP and Its Components
Percent
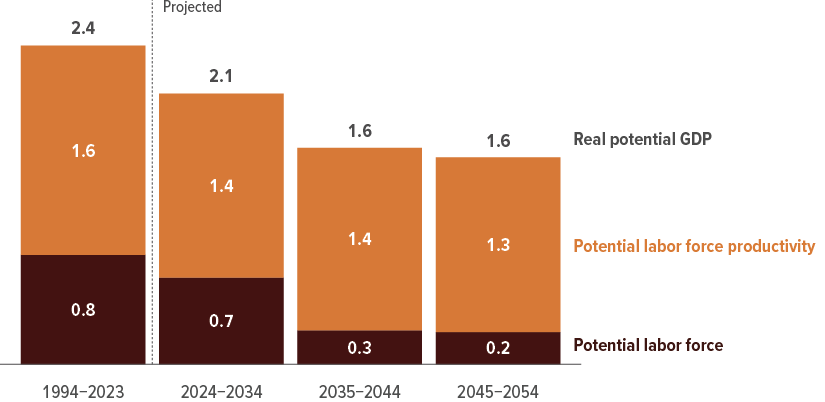
Real potential GDP is projected to grow more slowly from 2024 to 2054 than it has, on average, over the past 30 years. That decline is explained by slower growth in the potential labor force and in potential labor force productivity.
Data source: Congressional Budget Office. See www.cbo.gov/publication/59711#data.
Real values are nominal values that have been adjusted to remove the effects of changes in prices.
Real potential GDP is an estimate of the amount of real GDP that can be produced if labor and capital are employed at their maximum sustainable rates. Its growth is the sum of the growth of the potential labor force and of potential labor force productivity. The potential labor force is an estimate of what the size of the labor force would be if economic output and other key variables were at their maximum sustainable amounts. Potential labor force productivity is the ratio of real potential GDP to the potential labor force.
The bars show average annual growth rates over the specified periods.
GDP = gross domestic product.
Potential Labor Force. In CBO’s projections, the expansion of the potential labor force slows, averaging 0.7 percent from 2024 to 2034 and 0.2 percent from 2045 to 2054. Much of the growth in the labor force over the coming decade—especially in 2025 and 2026—is due to increased net immigration. Over the next three decades, the potential labor force grows by an average of 0.4 percent per year. That growth is much slower than it was over the past 30 years, when the potential labor force grew by an average of 0.8 percent per year. Slowing population growth and the aging of the population account for most of that slowdown.
Potential Labor Force Productivity. Like the growth of the potential labor force, the growth of potential labor force productivity is projected to slow over the next three decades. In CBO’s projections, potential labor force productivity grows by an average of 1.4 percent per year from 2024 to 2034 and by an average of 1.3 percent per year from 2045 to 2054. Over the entire 30-year projection period, potential labor force productivity grows at an average annual rate of 1.4 percent—slower than the 1.6 percent annual growth rate it averaged over the past 30 years.
Two key factors drive the slower growth in potential labor force productivity. First, measured per worker, the accumulation of capital—structures and equipment, intellectual property products (such as computer software), and residential housing, for example—is projected to be slower over the next three decades than in the past, in part because increased federal borrowing is projected to reduce private investment. (For details about the effects of federal borrowing on private investment, see Chapter 1; and see the subsequent discussion in this chapter's section about the effects of fiscal policy on CBO's economic projections.)
Second, total factor productivity (TFP) in the nonfarm business sector is also expected to increase more slowly over the next three decades than it did over the past three. (TFP is the average real output per unit of combined labor and capital services.) Whereas TFP grew by an average of 1.2 percent per year from 1994 to 2023, CBO projects that it will grow at an average rate of 1.1 percent over the next 30 years. That slower growth in TFP is attributable to several factors, including a slowdown in the increase in workers’ educational attainment, declining federal investment measured in relation to the size of the economy, and the effects of climate change on factors that affect production (see Appendix C for details).5
Real GDP
In CBO’s projections, real GDP grows at an average rate of 1.7 percent per year from 2024 to 2054—a little more slowly than real potential GDP grows over that period. The growth rates of real GDP and real potential GDP converge in 2026. At that point, the level of real GDP is about 0.5 percent below that of real potential GDP. That output gap remains through the end of the projection period, reflecting CBO’s assessment that during and after economic downturns, real GDP falls short of real potential GDP for longer, and by a larger amount, than it exceeds real potential GDP during economic expansions.6
Real GDP per Person
Real GDP per person is expected to increase at an average annual rate of 1.3 percent over the 2024–2054 period—more slowly than the average annual growth rate of 1.6 percent experienced over the past 30 years.7 In the agency’s projections, the average annual growth of real GDP per person falls from 1.4 percent in the first decade of the projection period to 1.3 percent in the second and third decades, as growth in real GDP slows more than growth in the population does.
Nominal GDP
In CBO’s projections, nominal GDP grows by 3.9 percent in 2024. Growth in nominal GDP climbs to 4.2 percent by 2026, as high rates of net immigration in preceding years boost economic activity. The agency expects that beginning in 2027, net immigration will be consistent with its long-run historical average and GDP growth will moderate. Over the last two decades of the projection period, the growth rate of nominal GDP reflects the projected growth in real potential GDP and projected inflation as measured by the GDP price index. In 2054, nominal GDP grows by 3.6 percent.
The Labor Force
CBO’s projections of the labor force participation rate and the size of the labor force affect the agency’s other economic projections.8 For example, when the potential labor force grows faster, potential GDP increases faster than it otherwise would. As the labor force grows, the amount of investment increases to equip the new workers with capital, which causes private capital to accumulate more quickly than it otherwise would, further boosting the growth of potential GDP.
Labor Force Participation Rate. In CBO’s projections, the labor force participation rate drops over the next three decades: It averages 62.0 percent over the 2024–2034 period, 61.1 percent over the 2035–2044 period, and 60.8 percent over the 2045–2054 period. That decline continues the downward trend that began in the mid-2000s—a trend that has been driven mostly by the aging of the population.
Although the aging of the population continues to be the main driver of the decline in labor force participation in CBO’s projections, it is not the only factor affecting those projections. Some factors, such as increases in educational attainment and life expectancy, tend to increase labor force participation and thus partially offset the effects of the aging of the population. But other factors, along with that aging, push down the labor force participation rate in CBO’s projections. For instance, in those projections, the marriage rate continues to fall, and unmarried men tend to participate in the labor force at lower rates than married men do. Also, under current law, many workers will face higher tax rates and thus earn lower after-tax wages than they would have earned with current tax rates, which is expected to weaken their incentive to work. Those projected higher tax rates are the result of two factors: the expiration of certain provisions of the 2017 tax act at the end of 2025, which will raise tax rates on individual income, and real bracket creep—the process by which, as people’s income rises faster than inflation, more of their income is pushed into higher tax brackets, raising their effective tax rates. In addition, increases in federal borrowing are projected to reduce private investment in capital, leading to lower wages (see the subsequent discussion in the section about the effects of fiscal policy on CBO’s economic projections).
To assess the importance of the aging of the population in its projections of the labor force participation rate, CBO calculated what the rate would be if in each year of the projection period the age-and-sex composition of the population remained the same as it was in 2024. The agency then compared the outcomes in that hypothetical scenario with its projections.9 In the hypothetical scenario, the labor force participation rate would increase from 62.7 percent in 2024 to 63.1 percent in 2054—2.8 percentage points higher than the labor force participation rate in that year in CBO’s projections. In the scenario without the aging of the population, the labor force participation rate rises because educational attainment is projected to increase, on average, and people with higher levels of education generally participate in the labor force at a higher rate. Thus, CBO estimates that the aging of the population causes the labor force participation rate to drop by 2.8 percentage points over the 2024–2054 period—which is more than the overall decline in that rate (2.5 percentage points) during the period.
Labor Force Growth. The size of the labor force depends on the rates at which people in different demographic groups participate in the labor market and on the number of people in those groups. In CBO’s projections, the number of people in those demographic groups is determined by the agency’s projections of the population—which are significantly affected by net immigration. For example, in the agency’s projections, net immigration increases the size of the overall population and, because immigrants are more likely to be of working age, results in a larger share of people in age groups that have higher rates of labor force participation.
In CBO’s projections, the labor force expands from 169 million people in 2024 to 188 million in 2054. That growth slows over the projection period, averaging 0.6 percent per year from 2024 to 2034 and 0.2 percent per year from 2045 to 2054. Those growth rates mark a significant slowdown from the pace of growth over the past 30 years: From 1994 to 2023, the labor force expanded at an average rate of 0.9 percent per year.
Inflation
CBO projects several measures of inflation that affect interest rates and, consequently, interest payments on federal debt. Inflation also affects income, cost-of-living adjustments for certain benefits, and the indexation of income tax brackets, thereby influencing tax revenues and federal expenditures. The agency projects rates of inflation in the prices of consumer goods and services and in the prices of all goods and services that contribute to GDP.
Personal Consumption Expenditures Price Index. One measure of change in consumer prices is the growth rate of the personal consumption expenditures (PCE) price index, which encompasses a broad range of goods and services. The Federal Reserve sets an explicit goal of 2 percent for the long-term average rate of inflation as measured by the PCE price index. In CBO’s projections, the PCE price index grows at rates that are consistent with that goal from 2026 to 2054.
Consumer Price Index. A second measure of change in consumer prices is the consumer price index for all urban consumers (CPI-U). In CBO’s projections, inflation in that index averages 2.3 percent per year over the 2024–2054 period. That average rate is consistent with the historical relationship between the CPI-U and PCE price index during the two decades before the coronavirus pandemic. In 2029, inflation in the CPI-U returns to a rate that is 0.3 percentage points higher than inflation in the PCE price index—a difference that is maintained for the rest of the projection period.10
GDP Price Index. Over the 2024–2054 period, inflation in the GDP price index is projected to average 2.0 percent annually. Like the projected rate of inflation in the CPI-U, that average rate is consistent with the historical relationship between the GDP and PCE price indexes over the past 30 years. In the long term, inflation in the GDP price index roughly equals that in the PCE price index.
Interest Rates
CBO projects a set of interest rates that affect the budget, including interest rates on various debt instruments issued by the Treasury Department and on special-issue Social Security bonds.
In CBO’s projections for the 2024–2054 period, interest rates on government securities are higher than they were, on average, over the past 30 years. The interest rate on 10-year Treasury notes increases slightly, rising from an average of 4.1 percent over the 2024–2034 period to an average of 4.3 percent over the 2045–2054 period (see Figure 3-4). Over the entire 2024–2054 period, the interest rate on 10-year Treasury notes averages 4.2 percent—about one-third of a percentage point higher than the 3.8 percent average recorded from 1994 to 2023. The real interest rate on 10-year Treasury notes (calculated by subtracting the percentage of increase in the consumer price index from the nominal yield on those notes) is projected to average 1.9 percent over the 2024–2054 period—0.6 percentage points higher than the average real interest rate on 10-year Treasury notes from 1994 to 2023. (That rate has averaged 0.1 percent since 2008.)
Figure 3-4.
Average Interest Rates on Federal Debt and on 10-Year Treasury Notes
Percent

In CBO’s projections for the 2024–2054 period, interest rates on government securities, such as 10-year Treasury notes, are higher than they were, on average, over the past 30 years. The rise in interest rates mainly stems from an increasing amount of federal debt and the growth of capital income as a share of total income.
Data sources: Congressional Budget Office; Federal Reserve. See www.cbo.gov/publication/59711#data.
Data are for fiscal years. The average interest rate on all federal debt held by the public equals net interest payments in the current year divided by debt held by the public at the end of the previous year.
In CBO’s assessment, structural factors—demographics, attitudes toward saving and investment, and the amount of federal debt, for example—largely determine interest rates in the long term. Because of changes in several of those factors, real interest rates in the United States have trended downward since the early 1980s.11 The agency expects a few of those changes—including slower growth of the labor force, more private foreign and domestic savings available for investment, and slower growth of TFP—to continue to put downward pressure on interest rates through 2054. Slower growth of the labor force and an increase in the total amount of savings available for investment tend to increase the amount of capital per worker in the long term, thereby reducing the return on capital and, thus, the return on government bonds and other investments.12 Slower growth of productivity reduces the return on capital and results in lower interest rates, all else being equal.
That downward pressure is expected to be more than completely offset by upward pressure on interest rates from two other changes. First, in CBO’s projections for the 2024–2054 period, federal debt as a percentage of GDP is higher than it was, on average, over the past 30 years. When federal debt grows, interest rates tend to go up, raising the cost of borrowing and, in turn, lowering private investment. That reduction in private investment tends to reduce the amount of capital per worker and further increase interest rates and the return on capital over time. Second, capital income as a percentage of total income is expected to be higher than it was, on average, over the past 30 years. In CBO’s estimation, a larger share of income accruing to owners of capital would directly boost the return on capital and, thus, interest rates.
The average interest rate on all federal debt held by the public tends to be lower than the rate on 10-year Treasury notes. That is because the average term to maturity for federal debt has been less than 10 years since the 1950s and interest rates on shorter-term debt (which is less risky for investors than longer-term debt) are generally lower than those on longer-term debt. In CBO’s projections, the average interest rate on federal debt is 3.7 percent over the 2024–2054 period—0.6 percentage points lower than the interest rate on 10-year Treasury notes.
The two Social Security trust funds (the Old-Age and Survivors Insurance Trust Fund and the Disability Insurance Trust Fund) hold special-issue bonds. In CBO’s projections, the interest rate on those bonds averages 2.4 percent from 2024 to 2034—the year that the Social Security trust funds are projected to be exhausted if their balances were combined. Because interest rates have been low for most of the past decade and are expected to rise, that projected average rate, which is for all bonds held by the Social Security trust funds, is lower over the next decade than the projected average interest rate on newly issued bonds.13
Effects of Fiscal Policy on CBO’s Economic Projections
CBO’s economic projections incorporate the effects of the federal deficits projected under current law. And because deficits grow, the federal government borrows more each year, in the agency’s budget projections. That increase in federal borrowing reduces the amount of resources for private investment and pushes up interest rates, further reducing private investment in capital. As a result, output is less in the long term than it would be otherwise, especially in the last two decades of the projection period. Less private investment also reduces the amount of capital per worker, making workers less productive and leading to lower wages. Those lower wages reduce people’s incentive to work and, consequently, lead to a smaller supply of labor.
The agency’s economic projections also incorporate the effects of changes in federal tax policies scheduled under current law, including the expiration of certain provisions of the 2017 tax act. Under current law, tax rates on individuals’ income are scheduled to increase at the end of 2025, when those provisions are scheduled to expire. Those changes aside, as income rises faster than inflation, more income is pushed into higher tax brackets over time. That real bracket creep results in higher effective marginal tax rates on labor income and capital.14 Higher marginal tax rates on labor income reduce people’s after-tax wages and weaken their incentive to work. Likewise, an increase in the marginal tax rate on capital income lowers people’s incentives to save and invest, thereby reducing the stock of capital and, in turn, labor productivity. In CBO’s projections, that reduction in labor productivity puts downward pressure on wages. All told, less private investment and a smaller labor supply decrease economic output and income in CBO’s extended baseline projections.
1. To develop its demographic projections, CBO uses the Social Security area population, which is the relevant population for estimating Social Security payroll taxes and benefits. That population includes all residents of the 50 U.S. states and the District of Columbia, as well as civilian residents of U.S. territories. It also includes federal civilian employees and members of the U.S. armed forces living abroad and their dependents, U.S. citizens living abroad, and noncitizens living abroad who are eligible for Social Security benefits on the basis of their earnings while in the United States.
2. Although the population is projected to grow more slowly over the next 30 years, on average, than it did over the past 30 years, the population in CBO’s current projections grows faster than in the agency’s projections last year. For a discussion of the changes to CBO’s population projections since January 2023, see Congressional Budget Office, The Demographic Outlook: 2024 to 2054 (January 2024), p. 8, www.cbo.gov/publication/59697.
3. The total fertility rate represents the average number of children that a woman would have if, in each year of her life, she experienced the birth rates observed or assumed for that year and if she survived her entire childbearing period (which CBO estimates is from ages 14 to 49).
4. The economic projections underlying this analysis are extended versions of the 10-year economic projections described in Congressional Budget Office, The Budget and Economic Outlook: 2024 to 2034 (February 2024), www.cbo.gov/publication/59710. For a discussion of changes to CBO’s economic projections since June 2023, when the agency last published its extended baseline projections, see Appendix B. For a discussion of projections of additional economic factors, see Appendix C.
5. For more information about the effects of climate change on the economy, see Evan Herrnstadt and Terry Dinan, CBO’s Projection of the Effect of Climate Change on U.S. Economic Output, Working Paper 2020-06 (Congressional Budget Office, September 2020), www.cbo.gov/publication/56505.
6. One recent study explains the existence of an average negative output gap (where actual output is less than potential output) by examining asymmetric fluctuations in the unemployment rate. See Stéphane Dupraz, Emi Nakamura, and Jón Steinsson, “A Plucking Model of Business Cycles” (unpublished draft, July 2023), https://tinyurl.com/yvcb2emu (PDF). And see Congressional Budget Office, Why CBO Projects That Actual Output Will Be Below Potential Output on Average (February 2015), www.cbo.gov/publication/49890.
7. To develop its projections of real GDP per person, CBO uses the “resident population plus armed forces overseas,” a measure of population that includes U.S. residents and members of the armed forces on active duty stationed outside the United States but excludes military dependents, and other U.S. citizens, living abroad.
8. The labor force consists of people age 16 or older in the civilian noninstitutionalized population who have jobs or who are unemployed (available for work and either seeking work or expecting to be recalled from a temporary layoff). The civilian noninstitutionalized population excludes members of the armed forces on active duty and people in penal or mental institutions or in homes for the elderly or infirm. The labor force participation rate is the percentage of the civilian noninstitutionalized population age 16 or older that is in the labor force.
9. Because the sex composition of the population is projected to change only slightly over the next three decades, the effect of the aging of the population accounts for nearly all of the difference between the labor force participation rate under the hypothetical scenario in which the age-and-sex composition of the population remains constant and the rate in CBO’s projections.
10. Another measure of inflation is the chained consumer price index for all urban consumers (chained CPI-U). Many tax parameters are adjusted for changes in the chained CPI-U. Historically, inflation as measured by the chained CPI-U has been about 0.25 percentage points lower, on average, than inflation as measured by the CPI-U. CBO’s projections reflect that average difference between the two measures. The chained CPI-U tends to grow more slowly than the traditional CPI-U does, for two reasons. First, it uses a formula that better accounts for households’ tendency to substitute goods and services with similar but cheaper alternatives when prices go up. Second, unlike the CPI-U, the chained CPI-U is little affected by statistical bias related to the sample sizes that the Bureau of Labor Statistics uses in computing each index.
11. Edward N. Gamber, The Historical Decline in Real Interest Rates and Its Implications for CBO’s Projections, Working Paper 2020-09 (Congressional Budget Office, December 2020), www.cbo.gov/publication/56891.
12. For more information about the relationship between the growth of the labor force and interest rates, see Congressional Budget Office, How Slower Growth in the Labor Force Could Affect the Return on Capital (October 2009), www.cbo.gov/publication/41325.
13. In CBO’s projections, the interest rate on newly issued bonds held in the two Social Security trust funds is equal to the rate on 10-year Treasury notes.
14. The effective marginal tax rate is the percentage of an additional dollar of income from labor or capital that is paid in taxes. For more information about the effects of real bracket creep on CBO’s long-term projections, see Congressional Budget Office, “How Income Growth Affects Tax Revenues in CBO’s Long-Term Budget Projections” (June 2019), www.cbo.gov/publication/55368.
Appendix A: Policy Specifications and Modeling
The Congressional Budget Office’s long-term budget projections are consistent with the demographic projections the agency published this past January and the economic forecast and 10-year baseline budget projections it published in February. The long-term budget projections, referred to as the extended baseline, follow the agency’s 10-year baseline budget projections (which conform to a set of assumptions specified in law) and then extend most of the concepts underlying those projections for an additional 20 years.1
CBO’s extended baseline projections give lawmakers a point of comparison from which to measure the effects of policy options or proposed legislation. The projections are not predictions of budgetary outcomes. Rather, they represent the agency’s assessment of future spending, revenues, deficits, and debt under these policy specifications:
- Current laws affecting revenues and spending generally remain unchanged;
- Some programs—for example, the Supplemental Nutrition Assistance Program—are nevertheless extended after their authorizations lapse;
- Spending on Medicare and Social Security continues as scheduled regardless of the amounts in those programs’ trust funds; and
- Discretionary spending follows the agency’s 10-year baseline projection through 2034 and then transitions (over a five-year period) to grow at the rate of nominal gross domestic product (that is, GDP measured in current-year dollars).
For a summary of the policy specifications about outlays and revenues that underlie CBO’s extended baseline projections, see Table A-1.
Table A-1.
Policy Specifications Underlying CBO’s Extended Baseline Projections
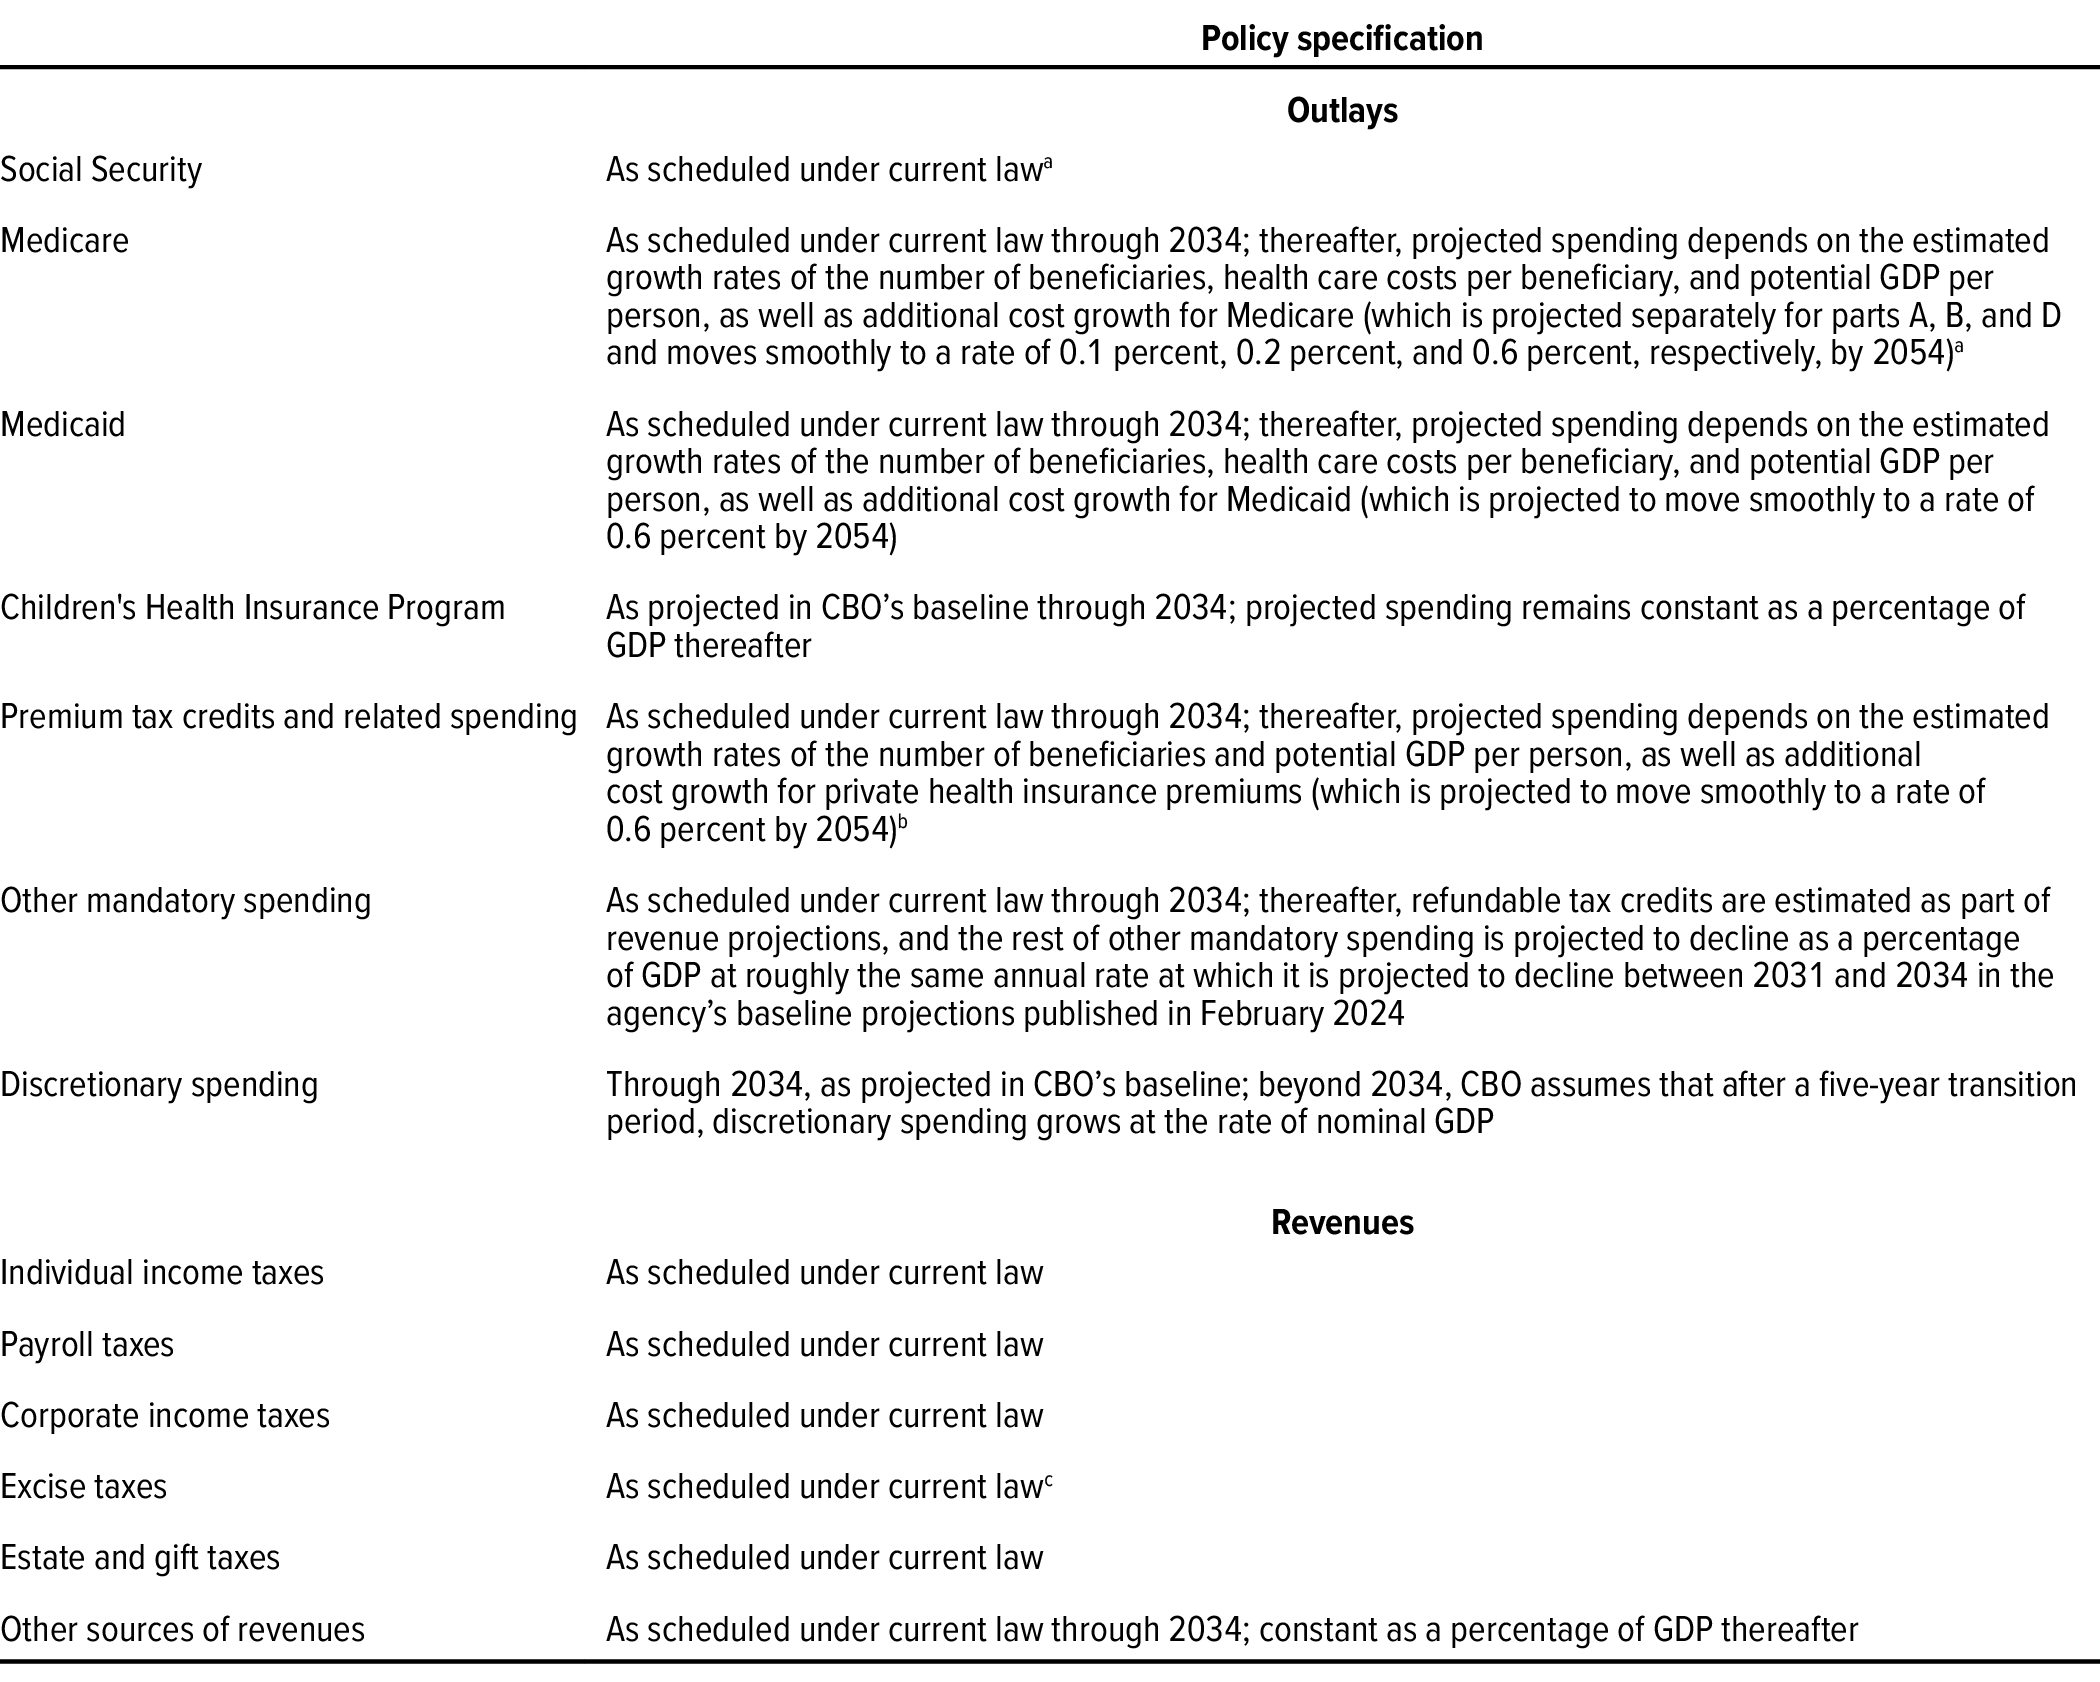
Data source: Congressional Budget Office.
The extended baseline projections follow the agency’s 10-year baseline budget projections and then extend most of the concepts underlying those projections for an additional 20 years.
For CBO’s most recent 10-year baseline projections, see Congressional Budget Office, The Budget and Economic Outlook: 2024 to 2034 (February 2024), www.cbo.gov/publication/59710.
Additional cost growth is the amount by which the growth rate of nominal health care spending per person (adjusted to remove the effects of demographic changes) exceeds the growth rate of potential GDP per person. Potential GDP is the maximum sustainable output of the economy.
GDP = gross domestic product.
a. Assumes the payment of full benefits as scheduled under current law, regardless of the amounts in the program’s trust funds.
b. Premium tax credits for health insurance purchased through the marketplaces established under the Affordable Care Act subsidize the purchase of health insurance. Related spending is spending to subsidize health insurance provided through the Basic Health Program and to stabilize premiums for health insurance purchased by individuals and small employers.
c. The exception to the current-law assumption applies to expiring excise taxes dedicated to trust funds. The Balanced Budget and Emergency Deficit Control Act of 1985 requires CBO’s baseline to reflect the assumption that those taxes would be extended at their current rates. That law does not stipulate that the baseline include the extension of other expiring tax provisions, even if they have been routinely extended in the past.
To develop the extended baseline projections, the agency uses a modeling approach that combines the following components:2
- A demographic model used to project the size of the population by age and sex;
- A set of economic forecasting models used to make baseline projections of economic variables;
- A set of models for projecting revenues from each major tax source;
- A microsimulation model used to project Social Security outlays beyond CBO’s standard 10-year budget period; and
- A long-term budget model and an interest rate model used to project federal outlays (except those for Social Security) and calculate deficits and debt beyond CBO’s standard 10-year budget period.
1. Congressional Budget Office, The Demographic Outlook: 2024 to 2054 (January 2024), www.cbo.gov/publication/59697, and The Budget and Economic Outlook: 2024 to 2034 (February 2024), www.cbo.gov/publication/59710.
2. For information about CBO’s demographic model, see Congressional Budget Office, The Demographic Outlook: 2024 to 2054 (January 2024), www.cbo.gov/publication/59697. For details about modeling the baseline projections of economic variables, see Robert W. Arnold, How CBO Produces Its 10-Year Economic Forecast, Working Paper 2018-02 (Congressional Budget Office, February 2018), www.cbo.gov/publication/53537; and Robert Shackleton, Estimating and Projecting Potential Output Using CBO’s Forecasting Growth Model, Working Paper 2018-03 (Congressional Budget Office, February 2018), www.cbo.gov/publication/53558. For information about CBO’s method for projecting revenues, see Congressional Budget Office, CBO Explains How It Develops the Budget Baseline (April 2023), www.cbo.gov/publication/58916; for long-term projections of spending on Social Security, see Congressional Budget Office, An Overview of CBOLT: The Congressional Budget Office Long-Term Model (April 2018), www.cbo.gov/publication/53667; and for projecting the average interest rate on federal debt, see Congressional Budget Office, The 2022 Long-Term Budget Outlook (July 2022), Appendix D, www.cbo.gov/publication/57971.
Appendix B: Changes in CBO’s Long-Term Economic Projections Since June 2023
Overview
In the Congressional Budget Office’s current extended baseline projections, the average annual growth of real gross domestic product (GDP) is faster than it was in the agency’s long-term projections published last June.1 (Real GDP is nominal GDP that has been adjusted to remove the effects of changes in prices.) In those current projections, real potential GDP grows faster, the labor force is larger, and interest rates are generally higher than in last year’s projections. (Real potential GDP is an estimate of the amount of real GDP that can be produced if labor and capital are employed at their maximum sustainable rates.) The forecast of inflation is similar to last year’s.
Changes in GDP Projections
CBO is now projecting faster growth of real potential GDP than it did last June, particularly over the next 10 years. In the current projections, real potential GDP grows at an average annual rate of 2.1 percent over the 2024–2033 period, instead of the 1.8 percent in last year’s projections. That increase reflects faster projected growth in the potential labor force that is largely attributable to significant upward revisions to the agency’s projections of net immigration over the next decade, particularly through 2027.2 Over the 2034–2053 period, real potential GDP growth averages 1.6 percent in this year’s projections, up from the 1.5 percent projected last year. That increase mainly stems from faster accumulation of capital in this year’s economic forecast.
Like its projections of the growth of real potential GDP, CBO’s projections of real GDP growth are higher than last year’s over the 2034–2053 period (see Figure B-1). During that period, real GDP grows at the same rate as real potential GDP in CBO’s forecast—up 0.1 percentage point, on average, from last year’s projection. For the 2024–2033 period, the agency expects real GDP to grow at a rate similar to that projected last June.
Figure B-1.
CBO’s 2023 and 2024 Projections of Selected Economic Variables
Percent

CBO’s long-term projections of real GDP growth—which affect its projections of revenues from income, payroll, and corporate taxes—are slightly higher over the last two decades of the projection period than they were last year.
The agency’s projections of inflation in the CPI-U—which affect its projections of spending on Social Security and other benefit programs with cost-of-living adjustments—are roughly the same as last year’s.
Projections of the average nominal interest rate on 10-year Treasury notes—a key factor in the agency’s projections of net interest costs—are now higher in most years of the projection period than they were last year.
Data source: Congressional Budget Office. See www.cbo.gov/publication/59711#data.
CPI-U = consumer price index for all urban consumers; GDP = gross domestic product.
a. Real GDP is nominal GDP that has been adjusted to remove the effects of changes in prices.
CBO now expects average annual growth in real GDP per person to be slower over the next decade but slightly faster over the second and third decades of the projection period. Because of upward revisions to its estimates of net immigration, the agency now projects faster average population growth over the 2024–2033 period than it did last year. All else being equal, the increase in projected population growth lowers average growth in real GDP per person over that period, compared with last June’s projections. Over the 2034–2053 period, however, real GDP per person grows by an average of 1.3 percent per year instead of the 1.2 percent in last year’s projections. That change is the result of an increase in the agency’s projection of real GDP growth.
Average annual growth of nominal GDP is now projected to be slightly slower over the next decade but faster over the second and third decades of the projection period than CBO expected last June. Whereas in last year’s projections, nominal GDP grew by an average of 4.1 percent per fiscal year from 2024 to 2033, it grows by an average of 4.0 percent over that period in the current projections. That difference is mostly attributable to downward revisions to the agency’s projections of growth in the GDP price index over the next few years. (To project nominal GDP growth, CBO first projects real GDP growth and then adjusts those values by using its projections of growth in the GDP price index to incorporate the effects of inflation.) The agency now projects that from 2034 to 2053, nominal GDP will grow by an average of 3.7 percent instead of the 3.6 percent projected last year. That increase reflects the agency’s current expectation of faster growth of real GDP over that period.
Changes in Labor Force Projections
In CBO’s current projections, the labor force participation rate for the 2024–2033 period is higher, on average, than it was in last year’s projections. The agency now expects that the percentage of the population ages 25 to 54 (the ages at which people are most likely to work) will be larger over that period because of increased net immigration.3 By contrast, CBO’s current projection of the labor force participation rate for the 2034–2053 period is slightly lower (by 0.2 percentage points), on average, than it was last year. That is because estimated labor force participation rates are now slightly lower for some subgroups of the population (as defined by age, sex, and level of education).
Although its projections of the labor force participation rate have changed only slightly since last year, CBO now expects that the population will be larger than previously projected. As a result, the labor force in the agency’s current projections is about 3 percent larger in 2053 than it was in last year’s projections (see Figure B-2).
Figure B-2.
CBO’s 2023 and 2024 Projections of the Labor Force
Millions of people
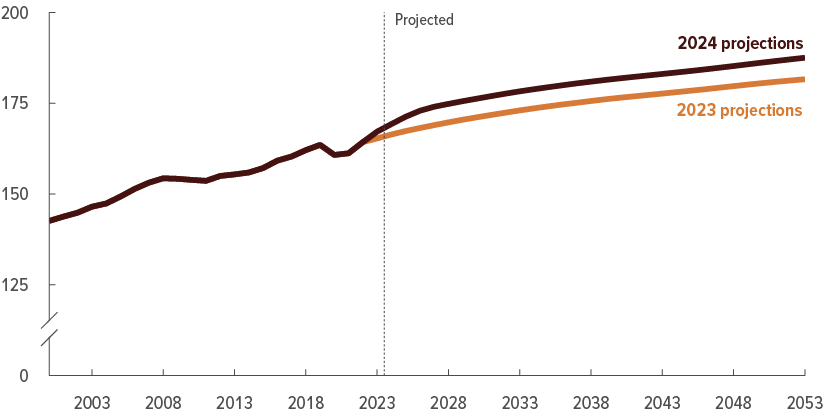
In CBO’s current projections, the labor force is about 3 percent larger in 2053 than it was in last year’s projections. That change results from the agency’s increased projections of population growth, which mainly stem from upward revisions to its estimates of net immigration.
Data source: Congressional Budget Office; Bureau of Labor Statistics. See www.cbo.gov/publication/59711#data.
The labor force consists of people age 16 or older in the civilian noninstitutionalized population who have jobs or who are unemployed (available for work and either seeking work or expecting to be recalled from a temporary layoff). The civilian noninstitutionalized population excludes members of the armed forces on active duty and people in penal or mental institutions or in homes for the elderly or infirm.
Changes in Inflation Projections
Whether measured by growth in the consumer price index for all urban consumers (CPI-U), the personal consumption expenditures (PCE) price index, or the GDP price index, CBO’s projections of inflation after 2026 are similar to last year’s projections. In 2025 and 2026, inflation in the CPI-U index is now expected to be slightly higher than the agency forecast last year.
Changes in Interest Rate Projections
The average nominal interest rates on 10-year Treasury notes and on newly issued bonds held in the two Social Security trust funds over the 2024–2053 period are generally higher in CBO’s current projections than they were in the June 2023 projections—4.2 percent in the current projections instead of 4.0 percent in the previous projections—and the contour of those projections has changed.
The agency has increased its projections of interest rates over the next decade. The average interest rate on 10-year Treasury notes from 2024 to 2033 is now projected to be 4.1 percent, which is 0.3 percentage points higher than was projected last year. In response to stronger-than-anticipated economic growth in 2023, the Federal Reserve has raised the target range for the federal funds rate higher than previously projected. As a result, short-term interest rates are projected to be higher, on average, over the next few years than CBO expected last year. Likewise, long-term rates, which partly reflect the expected path of short-term rates, are higher over the next few years in CBO’s current projections. Additionally, CBO revised upward its projections of interest rates over the second half of the next decade, mostly because the agency now expects capital income as a percentage of total income to be higher than previously projected.
CBO changed the contour of its projections of interest rates over the final two decades of the projection period, largely because of a change in how the agency projects interest rates in the period beyond the next few years. For its current projections, CBO reduced its estimate of the long-term sensitivity of the interest rate on 10-year Treasury notes to changes in federal debt. CBO now estimates that an increase of 1 percentage point in federal debt as a percentage of GDP will cause the interest rate on 10-year Treasury notes to rise by 2 basis points (0.02 percentage points) rather than by 2.5 basis points. That change reflects the agency’s analysis of the statistical relationship between the 10-year Treasury rate and federal debt (accounting for a variety of other factors) and its review of the related research literature.
Because the projected rise in the amount of federal debt over the final two decades of the projection period is now expected to put less upward pressure on interest rates, the contour of CBO’s current projections of interest rates is flatter than it would otherwise have been. The combined effect of the increase in projected interest rates over the next decade and the flatter contour of projected interest rates thereafter raises the average interest rate on 10-year Treasury notes over the 2035–2053 period from 4.1 percent in last year’s projections to 4.3 percent in the current projections.
The real interest rate on 10-year Treasury notes is also generally higher in this year’s projections—now averaging 1.9 percent over the 2024–2053 period instead of the 1.7 percent projected last year. The projected average nominal interest rate on all federal debt held by the public over the 2024–2053 period is higher, too—now 3.6 percent instead of the 3.4 percent projected last year.
1. Congressional Budget Office, The 2023 Long-Term Budget Outlook (June 2023), www.cbo.gov/publication/59014.
2. The potential labor force is an estimate of what the size of the labor force would be if economic output and other key variables were at their maximum sustainable amounts. The labor force consists of people age 16 or older in the civilian noninstitutionalized population who have jobs or who are unemployed (available for work and either seeking work or expecting to be recalled from a temporary layoff). The civilian noninstitutionalized population excludes members of the armed forces on active duty and people in penal or mental institutions or in homes for the elderly or infirm. Net immigration is the number of people who enter the United States minus the number who leave.
3. Congressional Budget Office, The Demographic Outlook: 2024 to 2054 (January 2024), www.cbo.gov/publication/59697. The labor force participation rate is the percentage of people age 16 or older in the civilian noninstitutionalized population who have jobs or who are unemployed (available for work and either seeking work or expecting to be recalled from a temporary layoff).
Appendix C: CBO’s Projections of Additional Economic Factors
Overview
The Congressional Budget Office develops its assessment of the long-term outlook for the federal budget on the basis of its projections of economic factors over the next three decades.1 The projections presented in this report are consistent with the economic forecast for 2024 to 2034 that CBO published in February 2024.2 Those projections reflect the assumption that current laws governing federal taxes and spending generally remain unchanged.
Projections of federal budgetary outcomes depend on many economic factors, some of which are not included in the discussion of CBO’s economic projections in Chapter 3. In this appendix, CBO describes its long-term projections of those additional economic factors, most of which have secondary effects on the agency’s projections of federal spending and revenues but contribute directly to its projections of gross domestic product (GDP), inflation, and interest rates. Those additional factors include several labor market outcomes (unemployment, average weekly hours worked, total hours worked, earnings as a share of compensation, inflation-adjusted earnings per worker, and the distribution of earnings among workers) and a number of factors related to capital accumulation and productivity. CBO’s projections of those factors reflect the agency’s assessment of various economic and demographic developments as well as its estimates of the effects of monetary and fiscal policy on economic activity.
Labor Market Outcomes
In addition to the rate of labor force participation and the size and growth of the labor force, CBO projects the unemployment rate, the average and total number of hours that people work, and various measures of workers’ earnings. The agency regularly updates those projections to account for revisions to historical data, reassessments of economic and demographic trends, and changes to its analytic methods.
Unemployment
In CBO’s projections, the unemployment rate generally rises through 2030 and then declines over the 2031–2054 period. The average unemployment rate is 4.4 percent over the next decade; that rate falls to 4.1 percent in the third decade (see Table C-1).3 From 2030 to 2054, the unemployment rate remains roughly one-fifth of 1 percentage point above the noncyclical rate of unemployment, a difference that is consistent with the projected gap of 0.5 percent between actual and potential GDP (that is, the maximum sustainable output of the economy).4
Table C-1.
Average Annual Values for Additional Economic Variables That Underlie CBO’s Extended Baseline Projections
Percent

Data sources: Congressional Budget Office; Bureau of Labor Statistics. See www.cbo.gov/publication/59711#data.
Real values are nominal values that have been adjusted to remove the effects of changes in prices.
GDP = gross domestic product; * = between -0.05 percent and 0.05 percent.
a. The percentage of people in the labor force who are not working but who are available for work and are either seeking work or expecting to be recalled from a temporary layoff.
b. The rate of unemployment resulting from all sources except changes in aggregate demand.
c. Total factor productivity is the average real output per unit of combined labor and capital services.
The agency’s projection of the noncyclical rate of unemployment declines for most of the 30-year projection period—from an average of 4.3 percent over the first decade to 3.9 percent over the third decade. That slow decline reflects the continuing shifts in the composition of the workforce toward older workers, for whom (when they participate in the labor force) unemployment rates tend to be lower, and away from less-educated workers, for whom unemployment rates tend to be higher.
Average Weekly Hours Worked
Given current laws and economic trends, CBO expects the average number of hours worked per week to decline slightly over the next 30 years. In 2054, the average worker is projected to work roughly one-quarter of an hour less per week than workers do today.
In CBO’s projections, the scheduled expiration of certain provisions of the 2017 tax act at the end of calendar year 2025 increases tax rates on individuals’ income and slightly reduces the average number of hours worked in the years that follow. In addition, effective tax rates on individuals’ income rise because of real bracket creep—the process by which, as people’s income rises faster than inflation, more of their income is pushed into higher tax brackets.
The average number of hours worked each week tends to vary by industry. Workers in manufacturing, for example, put in more than 40 hours per week, on average, whereas those in service industries work an average of about 32 hours per week. During the past decade, the percentages of workers in the manufacturing and service industries have been largely stable. In CBO’s assessment, changes in the percentages of workers employed in different industries are unlikely to substantially affect the economywide average number of hours worked over the next 30 years.
Total Hours Worked
CBO projects that the total number of hours worked per year will increase at an average annual rate of 0.4 percent over the entire 30-year projection period—much more slowly than the average rate of increase over the past three decades (0.9 percent). The growth of total hours worked is projected to slow mainly because the labor force is expected to grow more slowly in the future than it did over the past 30 years. (The total number of hours worked is calculated on the basis of projections of the growth of the labor force, average weekly hours worked, and unemployment.)
Earnings as a Share of Compensation
Workers’ total compensation consists of earnings (that is, wages and salaries) and nonwage compensation (such as employers’ contributions for health insurance, pensions, and government social insurance programs). Since 1960, the share of total compensation paid in the form of wages and salaries has declined—from 91 percent that year to 83 percent in 2023—mainly because health insurance premiums have increased more quickly than total compensation has.5 Because CBO anticipates that the cost of health insurance will continue to grow faster than wages and salaries, the portion of compensation that workers receive as earnings is projected to generally decline over the 30-year projection period and to equal 81 percent in 2054.
Real Earnings per Worker
Real earnings per worker (that is, earnings per worker adjusted to remove the effects of changes in prices) are projected to grow by an average of 1.1 percent annually over the 2024–2054 period—identical to the 1.1 percent annual growth they averaged over the past 30 years. CBO’s projections of real earnings per worker are based on the agency’s projections of total factor productivity (TFP, which is the average real output per unit of combined labor and capital in the nonfarm business sector), capital per worker, prices, the amount of nonwage compensation, and the average number of hours worked.
Distribution of Earnings
The distribution of earnings affects revenues from income taxes and payroll taxes (particularly Social Security taxes). Income taxes are affected by the earnings distribution because of the progressive rate structure of the individual income tax: People with lower income pay a smaller percentage of their earnings in taxes than people with higher income do.
In CBO’s projections, earnings grow faster for high earners than for low earners, but the rate of growth for high earners is slower than it was in the past. The share of earnings accruing to workers in the top 10 percent of the earnings distribution, for example, increases at an average rate of 0.1 percentage point per year from 2024 to 2054. That growth is less than it was from 1978 to 2022 (the most recent year for which data are available); over that period, the share of earnings accruing to workers in the top 10 percent of the distribution increased by an average of 0.2 percentage points per year.
Social Security payroll taxes are levied only on covered earnings up to a certain annual amount (called the taxable maximum, which is $168,600 in 2024), so projections of such taxes are affected by projected changes in the distribution of earnings.6 Because earnings have grown more for higher earners than for others, the portion of covered earnings on which Social Security payroll taxes are paid has fallen from 90 percent in 1983 to 82 percent in 2022. In CBO’s projections, the portion of covered earnings subject to Social Security taxes is 83 percent in 2024 and falls to 81 percent in 2054. That decline in the share of covered earnings below the taxable maximum reduces CBO’s projections of Social Security payroll taxes.
Changes in Projections of Those Labor Market Outcomes Since Last Year
Some of this year’s projections of labor market outcomes are close to last year’s. For example, the agency’s projected unemployment rate over the 2024–2053 period is roughly the same as that projected last June.7
Other projections differ:
- CBO’s projections of growth in total hours worked are now slightly higher over the next 30 years—mainly because of upward revisions to the agency’s forecast of net immigration, which increased projected growth in the labor force over the next decade.
- Earnings as a share of compensation are generally higher in CBO’s current projections than they were in last year’s. That increase reflects recent data showing stronger growth in taxable earnings than in nontaxable benefits.
- CBO also raised its projection of growth in real earnings per worker because private capital accumulates faster in its current projections than in last year’s.
- And to reflect recent data, the agency decreased its projection of the share of earnings accruing to workers at the very top of the earnings distribution and increased the projected share of earnings accruing to workers in the bottom half of the distribution.
Capital Accumulation and Productivity
Like labor market factors, capital accumulation and total factor productivity directly affect CBO’s projections of output growth. The accumulation of productive capital contributes to growth in production from one year to the next. In the nonfarm business sector, growth in TFP contributes directly to output growth. TFP growth has been the biggest contributor to potential output growth over past decades, and it continues to be the main driver of such growth in CBO’s projections.
The productivity of labor is measured by real GDP per hour worked. An increase in that measure reflects the growth in real GDP that is not attributable to growth in total hours worked; thus, it includes the contributions of capital accumulation and TFP to real GDP growth.
Capital Accumulation
In CBO’s projections, the accumulation of private capital in the nonfarm business sector is faster over the next 10 years than it is over the second and third decades of the projection period. Over the next decade, capital services in the nonfarm business sector (that is, the flow of productive services from the stock of capital assets) are expected to grow at an average annual rate of 2.3 percent. By the third decade of the projection period, that average falls to 2.0 percent.
The accumulation of private capital mainly depends on the growth of private saving, international flows of capital, the labor force, and federal borrowing. Over the next 30 years, private saving and inflows of foreign investment as a percentage of GDP generally rise in CBO’s projections, increasing the speed of capital accumulation. But that increase is more than offset by two factors: an increase in federal borrowing as a percentage of GDP, which pushes up interest rates, reduces growth in private investment, and slows the growth of the stock of private capital; and a slowdown in the growth of the labor force, which diminishes the demand for capital to equip new workers and thus slows capital accumulation.
Total Factor Productivity
The annual growth of TFP is projected to average 1.1 percent from 2024 to 2054. That projected growth rate is 0.3 percentage points slower than the average annual rate of growth since 1950 and 0.1 percentage point slower than the average rate since 1990.
CBO’s recent analysis of historical trends in TFP growth suggests that projections for the next few decades should place greater weight on the slower growth in recent years than on the faster growth in the more distant past. Thus, although CBO projects that growth in TFP will accelerate from its recent, unusually slow rate, the rate of growth in the agency’s projections is less than its long-term historical average.
Labor Productivity
Given the projected slowdown in the growth of the capital stock and TFP, average annual growth in real GDP per hour worked falls in CBO’s projections—from 1.4 percent over the first decade of the projection period to 1.3 percent over the third decade. Potential labor force productivity (the ratio of real potential GDP to the potential labor force) is projected to follow a similar trajectory over the next 30 years.8
Changes in Projections of Capital Accumulation and Productivity Since Last Year
CBO’s current projections of capital accumulation over the 2024–2053 period are higher than last year’s. The agency now projects that capital services in the nonfarm business sector will grow at an average annual rate of 2.1 percent over the 2024–2053 period instead of the 2.0 percent projected last year. Recent revisions to historical data by the Bureau of Economic Analysis raised the amount of real (inflation-adjusted) investment in structures and software. But because those revisions did not significantly change the nominal amount of investment in structures and software, they thus lowered the growth of historical price indexes for investment in those assets. Although CBO’s current projection of nominal private investment is similar to what it was last year, real business investment and capital services growth in the nonfarm business sector over the next 30 years are higher as a result of those revisions.
In CBO’s current long-term projections, TFP and real GDP per hour worked grow at about the same rate, on average, as they did in last year’s projections. Upward revisions to growth in hours worked lowered the agency’s current projections of real GDP per hour worked, relative to last year. Those revisions were offset by faster growth in capital services, which raised the growth of real GDP, all else being equal, in this year’s projection.
Factors Affecting Capital Accumulation and Productivity
In CBO’s view, the long-term growth of the nation’s stock of private capital (which results from private investment) will be driven by the growth of the labor force, private saving, international flows of direct foreign investment and financial capital, and federal borrowing. Private saving tends to move in the same direction as growth in the labor force, and both private saving and international capital flows tend to move in tandem with the rate of return on investment—a rate that measures the extent to which investment in the stock of capital results in a flow of income.
In the agency’s view, increased federal borrowing reduces the amount of funds available for private investment and puts upward pressure on interest rates. Higher interest rates reduce the growth of business investment by making it more costly to borrow money to expand productive capacity, and they reduce the growth of residential investment by raising mortgage rates. Consistent with its projections of federal borrowing, CBO’s projections of interest rates on 10-year Treasury notes generally increase over the 30-year period.
Annual growth in TFP is projected to be slower over the next 30 years than it was, on average, over the past 30 years for several reasons. One is that CBO expects the improvement in labor quality—an aggregate measure of workers’ skills that accounts for educational attainment and work experience—to slow over the next three decades, on net. Although the workforce is likely to become more experienced as improvements in health and increases in life expectancy lead people (particularly highly educated people) to continue working past the ages at which previous generations retired, slowing increases in overall educational attainment are projected to offset those gains in experience. Improvement in labor quality is implicitly included in CBO’s measure of TFP.
Another factor that reduces TFP growth in CBO’s forecast is a projected decline in federal investment in physical capital (such as transportation infrastructure and water and power projects), education and training, and research and development in relation to the size of the economy. Such investment produces income and other benefits (higher productivity and greater efficiency, for example) for private businesses. In CBO’s projections, over the next decade, federal discretionary spending measured as a percentage of GDP falls below the levels recorded in past decades. If federal investment generally remained unchanged as a share of discretionary spending and discretionary spending declined as a percentage of GDP, federal investment would also fall as a share of GDP. In CBO’s assessment, such a reduction in federal investment would dampen TFP growth.9
In at least two ways, climate change also affects the agency’s projections of TFP growth in future decades. First, in CBO’s assessment, climate change has affected recent productivity trends. Because CBO’s projections are based in part on those recent trends, they implicitly account for a portion of the future effects of climate change: In the agency’s projections, the level of GDP is 0.6 percent less in 2054 than it would have been without those effects. Second, the agency explicitly estimates a certain amount of additional impact on the growth of TFP from future changes in the climate. In CBO’s projections, TFP growth over the 2024–2054 period is 0.02 percentage points slower per year, on average, to account for that additional impact of climate change; as a result, in 2054 TFP is about 0.6 percent less and GDP is about 0.4 percent less than they would have been if CBO did not incorporate those additional effects of climate change into its projections. In all, climate change reduces CBO’s projection of GDP in 2054 by 1.0 percent.10
1. Those long-term economic projections are included in the supplemental data posted along with this report at www.cbo.gov/publication/59711#data.
2. Congressional Budget Office, The Budget and Economic Outlook: 2024 to 2034 (February 2024), www.cbo.gov/publication/59710.
3. The unemployment rate is the percentage of people in the labor force who are not working but who are available for work and are either seeking work or expecting to be recalled from a temporary layoff. The labor force consists of people age 16 or older in the civilian noninstitutionalized population who have jobs or who are unemployed (available for work and either seeking work or expecting to be recalled from a temporary layoff). The civilian noninstitutionalized population excludes members of the armed forces on active duty and people in penal or mental institutions or in homes for the elderly or infirm.
4. The noncyclical rate of unemployment is the rate of unemployment resulting from all sources except changes in aggregate demand.
5. For more discussion about CBO’s projections of the various components of income, see Congressional Budget Office, How CBO Projects Income (July 2013), www.cbo.gov/publication/44433.
6. Covered earnings are those received by workers in jobs subject to Social Security payroll taxes. Most workers pay payroll taxes on their earnings, although a small number of workers—mostly in state and local government jobs or in the clergy—are exempt. Earnings above the taxable maximum are also exempt from payroll taxes, and no additional Social Security benefits accrue to people on the basis of those excess earnings.
7. Congressional Budget Office, The 2023 Long-Term Budget Outlook (June 2023), www.cbo.gov/publication/59014.
8. The potential labor force is an estimate of what the size of the labor force would be if economic output and other key variables were at their maximum sustainable amounts.
9. For more details about how CBO estimates the macroeconomic effects of federal investment, see Congressional Budget Office, Effects of Physical Infrastructure Spending on the Economy and the Budget Under Two Illustrative Scenarios (August 2021), www.cbo.gov/publication/57327, and The Macroeconomic and Budgetary Effects of Federal Investment (June 2016), www.cbo.gov/publication/51628.
10. CBO has drawn on studies that relate differences in regional economic activity and growth to differences in regional weather patterns, as well as on studies of the economic effects of increasingly intense storms and rising sea levels. For more information, see Evan Herrnstadt and Terry Dinan, CBO’s Projection of the Effect of Climate Change on U.S. Economic Output, Working Paper 2020-06 (Congressional Budget Office, September 2020), www.cbo.gov/publication/56505.
Appendix D: Changes in CBO’s Long-Term Budget Projections Since June 2023
Overview
The Congressional Budget Office’s current budget projections for the 2024–2053 period differ from the projections it published in June 2023.1 The differences are attributable to changes in law, changes to the agency’s projections of demographic and economic factors, and the availability of more recent data.2
In CBO’s current projections:
- Spending as a percentage of gross domestic product (GDP) is 1 percentage point lower, on average, over the 2024–2053 period than it was in last year’s projections.
- Revenues as a percentage of GDP are 0.3 percentage points lower, on average, over the 2024–2053 period than they were in last year’s projections.
- Total deficits as a percentage of GDP are generally larger through 2029 and smaller thereafter than they were in last year’s projections (see Figure D-1). All told, such deficits are 0.6 percentage points smaller, on average, than CBO projected last year. Primary deficits (that is, total deficits excluding net outlays for interest) as a percentage of GDP are 0.8 percentage points smaller, on average, throughout the 2024–2053 period than they were in last year’s projections.
- Debt held by the public rises from 99 percent of GDP in 2024 to 163 percent in 2053. Such debt is 1 percentage point lower in 2024 and 17 percentage points lower in 2053 than the agency projected last year.
Figure D-1.
CBO’s 2023 and 2024 Projections of Deficits and Federal Debt Held by the Public
Percentage of GDP
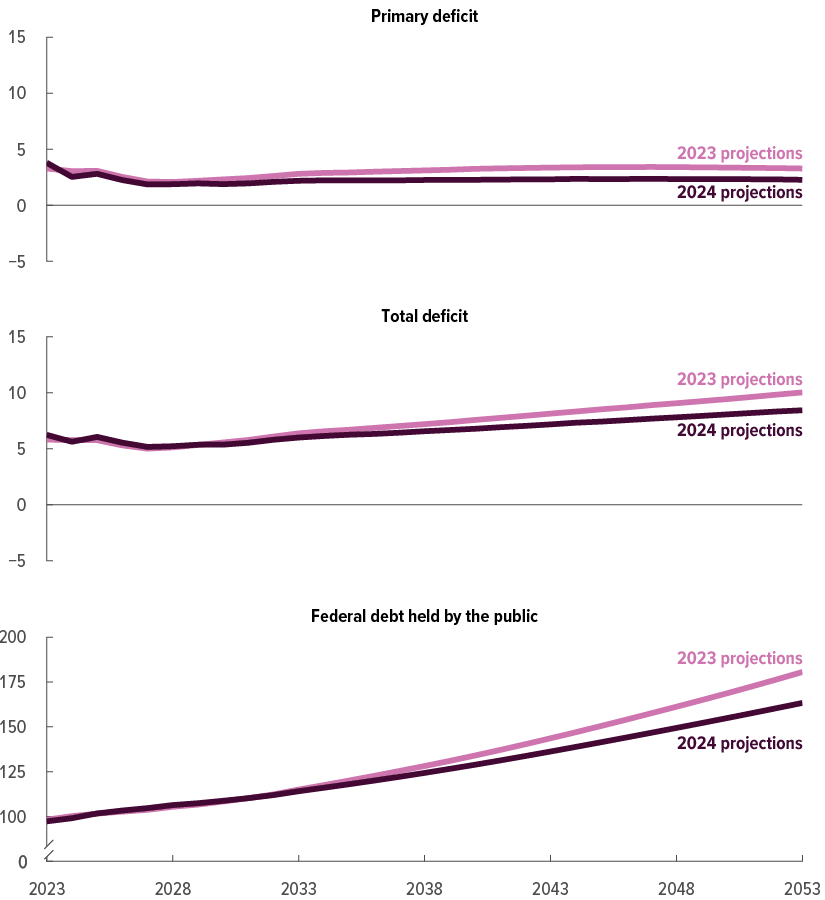
In CBO’s current projections, primary deficits as a percentage of GDP are 0.8 percentage points smaller, on average, over the 2024–2053 period than they were in last year’s projections.
CBO’s projections of total deficits are generally larger through 2029 but smaller in subsequent years.
Measured as a percentage of GDP, federal debt is now projected to be lower over the 2024–2053 period than CBO previously projected.
Data source: Congressional Budget Office. See www.cbo.gov/publication/59711#data.
CBO’s long-term budget projections, referred to as the extended baseline, follow the agency’s 10-year baseline budget projections (which conform to a set of assumptions specified in law) and then extend most of the concepts underlying those projections for an additional 20 years.
In this figure, deficits were calculated by subtracting revenues from outlays; thus, positive values indicate deficits.
Primary deficits exclude net outlays for interest.
GDP = gross domestic product.
CBO also changed its projections of amounts in the two Social Security trust funds—the Old-Age and Survivors Insurance (OASI) Trust Fund and the Disability Insurance (DI) Trust Fund. In CBO’s current projections, the OASI trust fund is exhausted in fiscal year 2033, one year later than the agency projected last year. The exhaustion date for the DI trust fund is extended beyond the 30-year projection period. The exhaustion date for the Old-Age, Survivors, and Disability Insurance (OASDI) trust funds, were they combined, occurs in fiscal year 2034, one year later than what was estimated last year.3
CBO’s current budget projections for the 2024–2054 period also differ from the long-term projections the agency published in February 2024, which were constructed using a simplified approach to project some categories of spending. In CBO’s current long-term projections, federal debt held by the public reaches 166 percent of GDP in 2054; in its February 2024 projections, such debt reached 172 percent of GDP in that year. The projected exhaustion dates for the OASI and OASDI trust funds are the same as they were in February. The differences reflect the full update to the projections (as opposed to the simplified approach) and a technical adjustment to CBO’s method for projecting the number of beneficiaries for Medicare and Social Security in the long term.
Changes in Projected Spending
In the current projections, total spending, measured as a percentage of GDP, is lower throughout the 2024–2053 period than it was in last year’s projections, by 0.4 percentage points in 2024 and 1.9 percentage points in 2053.4 Noninterest spending (that is, spending for mandatory and discretionary programs combined), measured as a percentage of GDP, is lower throughout the period; net outlays for interest are higher than previously estimated through 2044 and lower thereafter (see Figure D-2).
Figure D-2.
CBO’s 2023 and 2024 Projections of Outlays
Percentage of GDP

In CBO’s current projections, noninterest spending as a percentage of GDP is lower throughout the 2024–2053 period than it was in last year’s projections.
Net outlays for interest, measured as a percentage of GDP, are higher through 2044 and lower thereafter.
Data source: Congressional Budget Office. See www.cbo.gov/publication/59711#data.
CBO’s long-term budget projections, referred to as the extended baseline, follow the agency’s 10-year baseline budget projections (which conform to a set of assumptions specified in law) and then extend most of the concepts underlying those projections for an additional 20 years.
GDP = gross domestic product.
The decrease in projected noninterest spending as a percentage of GDP is explained by several factors. One such factor was changes in law: Annual funding limits for 2024 and 2025 established by the Fiscal Responsibility Act (FRA) and in effect under the Further Continuing Appropriations and Other Extensions Act, 2024, reduced projected spending for discretionary programs.5 CBO now projects outlays for those programs, measured as a percentage of GDP, to be lower throughout the next three decades than the agency estimated last year.
Those laws affect projected spending in later years because of the way that CBO is required to project discretionary funding. In CBO’s projections, discretionary funding for each year in the 10-year period used by the Congress for budget enforcement purposes is generally based on the amount of funding provided or projected for the previous year, adjusted for inflation. If the projected amounts exceed the limits established by the FRA, the total amount of discretionary funding in CBO’s baseline is reduced to comply with those limits. Because the caps lower projected funding for 2025, projections for each remaining year of the projection period are also reduced.
In addition, in CBO’s current projections, spending on Social Security as a percentage of GDP is lower throughout the 2024–2053 period than it was in last year’s projections, by an average of 0.2 percentage points each year, because the agency’s projections of nominal GDP are higher than they were last year and outlays for Social Security in nominal dollars are generally lower than they were last year.
Projections of outlays for Social Security, measured in nominal dollars, are lower for two reasons. First, CBO now projects inflation and average wages to be lower than it previously did. Social Security provides annual cost-of-living adjustments (COLAs) based on changes in the consumer price index for urban wage earners and clerical workers (CPI-W). CPI-W growth in 2023 and the corresponding COLA that took effect in January 2024 were 1 percentage point lower than CBO previously projected. As a result, projected Social Security outlays fell. (COLAs in later years are unchanged, on average.)
Second, the number of Social Security beneficiaries is higher from 2024 to 2033 than it was in last year’s projections but lower thereafter; over the full 2024–2053 period, that number is 0.8 percent lower than the agency estimated last year. A larger-than-projected caseload of OASI beneficiaries in 2023 and the beginning of 2024, along with faster projected growth of the population age 65 or older, resulted in larger projected caseloads from 2024 to 2033. The decrease in the number of Social Security beneficiaries after 2033 primarily results from a technical change in the agency’s model for projecting people’s eligibility for benefits. CBO’s method now takes into consideration the immigration status of beneficiaries. In particular, the agency now estimates that half (rather than all) of people who are not citizens and not legal permanent residents will be eligible for Social Security benefits on the basis of their own work record or that of their spouse. As is the case for all Social Security beneficiaries, they must also meet the work requirements.6
Projected spending on the major federal health care programs, measured as a percentage of GDP, is also less throughout most of the next three decades—by an average of 0.2 percentage points per year—than CBO estimated last year. Combined outlays for Medicaid, the Children’s Health Insurance Program, and premium tax credits for health insurance purchased through the marketplaces established under the Affordable Care Act are lower both in nominal dollars and as a percentage of GDP than they were last year. CBO’s projections of spending for Medicare are higher in nominal dollars than they were in last year’s projections but are lower as a share of GDP.
In particular, the agency now projects higher GDP and slower growth in spending on Medicaid, measured as a percentage of GDP, than it did last year. CBO lowered its projections of spending for Medicaid in part because the agency’s latest economic forecast includes downward revisions to projected increases in many prices, which reduce projected payment rates for Medicaid.
All told, projections of mandatory spending excluding outlays for the major health care programs and Social Security, measured as a percentage of GDP, are now generally lower than they were last year (see Table D-1). Several factors boosted projected outlays, including increases in projected outlays for temporary tax credits—such as the clean vehicle and energy-related tax credits and coronavirus refundable tax credits—and student loan programs. However, those increases were more than offset by other factors. One such factor was greater GDP, which reduces any given amount of spending as a percentage of GDP. Another was decreased projected outlays in other areas, including veterans’ benefits, deposit insurance, the Supplemental Nutrition Assistance Program, and child nutrition programs. (The reduction in projected outlays for the latter two programs was driven by downward revisions to CBO’s projections of increases in food prices.)
Table D-1.
CBO’s 2023 and 2024 Projections of Revenues, Outlays, Deficits, and Federal Debt Held by the Public in Selected Years
Percentage of GDP

Data source: Congressional Budget Office. See www.cbo.gov/publication/59711#data.
CBO’s long-term budget projections, referred to as the extended baseline, follow the agency’s 10-year baseline budget projections (which conform to a set of assumptions specified in law) and then extend most of the concepts underlying those projections for an additional 20 years.
GDP = gross domestic product.
a. Consists of excise taxes, remittances to the Treasury from the Federal Reserve System, customs duties, estate and gift taxes, and miscellaneous fees and fines.
b. Consists of outlays for Medicare (net of premiums and other offsetting receipts), Medicaid, the Children’s Health Insurance Program, and premium tax credits for health insurance purchased through the marketplaces established under the Affordable Care Act and related spending. The premium tax credits subsidize the purchase of health insurance. Related spending is spending to subsidize health insurance provided through the Basic Health Program and to stabilize premiums for health insurance purchases by individuals and small employers.
c. Includes the refundable portions of the earned income tax credit, the child tax credit, and the American Opportunity Tax Credit.
d. When outlays exceed revenues, the result is a deficit. Values in this row were calculated by subtracting outlays from revenues; thus, negative values indicate deficits.
e. Excludes net outlays for interest.
Net outlays for interest in the current projections total 3.1 percent of GDP in 2024 (0.4 percentage points more than was estimated last year) and 6.2 percent of GDP in 2053 (0.6 percentage points less than was estimated last year). The change in the estimate for 2024 stems from higher projected interest rates. Net outlays for interest remain higher than previously estimated through 2044, but in later years, they are lower than previously projected. The later reductions reflect lower long-term projections of the average interest rate on federal debt and of federal debt held by the public as a percentage of GDP. (For a discussion of the changes in the long-term projections of interest rates, see Appendix B.)
Changes in Projected Revenues
Since last year, CBO has lowered its projections of federal revenues as a percentage of GDP for the entire 2024–2053 period—by 0.3 percentage points in 2024 and in 2053 (see Figure D-3). That overall decrease is largely driven by lower receipts, relative to GDP, from individual income taxes—the largest source of revenues—in the current projections.
Figure D-3.
CBO’s 2023 and 2024 Projections of Revenues
Percentage of GDP

In CBO’s current projections, federal revenues as a percentage of GDP are lower throughout the 2024–2053 period than they were in last year’s projections.
Data source: Congressional Budget Office. See www.cbo.gov/publication/59711#data.
CBO’s long-term budget projections, referred to as the extended baseline, follow the agency’s 10-year baseline budget projections (which conform to a set of assumptions specified in law) and then extend most of the concepts underlying those projections for an additional 20 years.
GDP = gross domestic product.
Measured in nominal dollars, tax receipts are higher in the longer term than projected last year because CBO increased its estimates of factors that contribute to the size of the economy, including wages and salaries. Because those factors boost GDP as well as revenues, they have less of an effect on receipts as a percentage of GDP.
Relative to GDP, projected receipts from individual income taxes are lower in the near term and the long term as a result of several factors, including higher projections of mortgage interest, which is deductible for taxpayers who itemize, and lower projections of proprietors’ income, which is taxable. In addition, changes in the distribution of earnings in CBO’s projections lead to lower individual income tax receipts because a smaller share of income is taxed at higher marginal tax rates.
Payroll tax receipts are slightly higher, by an average of 0.1 percentage point of GDP throughout the projection period, in part because changes in the projected distribution of income mean that a larger share of total earnings falls below the maximum taxable amount ($168,600 in calendar year 2024). Therefore, more earnings are subject to payroll taxes. Corporate income tax receipts are slightly lower, by an average of less than 0.1 percentage point of GDP.
Changes in Projected Deficits and Debt
As a result of the changes to CBO’s projections of spending and revenues, projections of total deficits, measured as a percentage of GDP, are generally larger through 2029 and smaller thereafter. In the current projections, the total deficit for 2024 equals 5.6 percent of GDP, 0.2 percentage points smaller than was projected last year. In 2025, however, the total deficit is 0.3 percentage points larger than was projected last year. In 2029, the deficit is slightly larger than it was in last year’s projections, and by 2053, the total deficit is 8.4 percent of GDP—1.6 percentage points less than last year’s projection. The larger total deficits in earlier years are attributable to higher interest costs in this year’s projections. In later years, primary deficits are smaller and, ultimately, interest costs are lower than CBO previously projected, leading to smaller total deficits.
CBO lowered its projections of primary deficits, measured as a percentage of GDP, throughout the 2024–2053 period. In the current projections, the primary deficit equals 2.5 percent of GDP in 2024 and 2.3 percent of GDP in 2053. The estimate for 2024 is 0.5 percentage points smaller than it was in last year’s projections, and the estimate for 2053 is 1.0 percentage point smaller. The smaller primary deficits reflect greater reductions in projected noninterest spending than in projected revenues.
The same factors underlying the changes in projected deficits from 2024 to 2053 also affected CBO’s projections of debt held by the public. Measured as a percentage of GDP, such debt is projected to be generally higher through 2031 and lower thereafter than the agency estimated last year. In the current projections, debt held by the public rises from 99 percent of GDP in 2024 to 163 percent in 2053; last year, CBO projected that it would rise from 100 percent of GDP in 2024 to 181 percent in 2053.
Changes in Projected Amounts in the Social Security Trust Funds
CBO’s projections of total income credited to the OASI and DI trust funds are 2.1 percent higher over the 2024–2033 period than they were last year, and the agency’s projections of expenditures from the trust funds are 0.1 percent lower. The projected year that the funds would be exhausted if they were combined is now fiscal year 2034—one year later than what CBO projected last year.
Considering the trust funds individually, CBO projects that if current laws governing the Social Security program’s taxes and benefits did not change, the OASI trust fund would be exhausted in fiscal year 2033, one year later than the agency projected last year. The DI trust fund would not be exhausted within the 30-year projection window. Last year, the agency projected that the DI trust fund would be exhausted in calendar year 2052.7
For OASI, CBO has increased its projections of both income to the trust fund and expenditures from the fund. The estimated exhaustion date is now later because the increases in projected income are larger than the increases in projected expenditures.
Since last year, CBO has increased its estimates of income credited to the OASI trust fund from 2024 to 2033 by 2.1 percent. That increase is mainly attributable to two factors: First, larger projected GDP leads to higher earnings and more revenues from payroll taxes; and second, a larger share of earnings is now projected to fall below the taxable maximum for Social Security taxes. Those changes to income are, in turn, driven by changes to CBO’s projections of the population. CBO now projects that the population will be larger—and more concentrated among people ages 16 to 54—than it projected last year, a change resulting from higher projections of net immigration (the number of people who migrate to the United States minus the number who leave) and lower projections of mortality rates.
CBO’s current projections of expenditures from the OASI fund over the 2024–2033 period are similar to those from last year, increasing by 0.1 percent. A larger-than-projected caseload in 2023 and the beginning of 2024, along with faster projected growth of the population age 65 or older, resulted in larger projected caseloads over the entire projection period. However, those factors were offset by lower projected inflation and wage growth, which resulted in lower projected average benefits.
For DI, CBO has increased its projections of income credited to the fund from 2024 to 2053 by 6.6 percent, mainly because of larger revenues from payroll taxes. Expenditures from the trust fund are lower over the entire projection period; over the full 2024–2053 period, they are 1.6 percent lower than the agency estimated last year. That decrease mostly reflects lower projected inflation and wage growth and reductions in the projected number of people receiving disability benefits. Taken together, the increased income and decreased expenditures account for the DI trust fund’s later exhaustion date—now beyond the end of the 30-year projection period.
Changes in Long-Term Budget Projections Since February 2024
CBO last published long-term budget projections in February 2024. Those projections and the ones presented here are based on CBO’s current economic and budget projections for 2024 to 2034 and incorporate the agency’s long-term projections of the population, the economy, and revenues, none of which have changed since February. The long-term spending projections released in February were prepared using a simplified approach that the agency regularly uses between full updates. The projections in this report, by contrast, constitute a full update.
In February, CBO projected that federal debt held by the public would reach 172 percent of GDP in 2054. Such debt is now projected to reach 166 percent of GDP in that year. Two factors drive that change. First, the projections presented here are based on a full update to the agency’s projections of health care spending beyond the 10-year window. In February 2024, the agency projected slower growth in Medicaid spending between 2024 and 2034 than it had projected in June 2023. The full update of the projections of spending on health care beyond the 10-year budget window better reflects that slower growth.8 As a result of that change, spending on Medicaid is now projected to be 0.1 percentage point lower in 2054 than CBO projected in February.
Second, the agency made a technical adjustment to its methods (described earlier) for projecting the number of beneficiaries in Social Security and in Medicare beyond the 10-year window. As a result of that change, spending on Social Security and spending on Medicare are each projected to be 0.1 percentage point lower in 2054 than CBO projected in February.
Those reductions in noninterest spending led to reductions in net spending for interest. In 2054, such spending is 0.2 percentage points lower in this year’s projections than it was in February’s projections.
The agency’s current projections of the exhaustion dates for the OASI trust fund and the combined OASDI trust funds—in fiscal years 2033 and 2034, respectively—are the same as they were in February. (CBO did not project an exhaustion date for the DI trust fund in February because that date would have been beyond the 10-year projection period and the simplified approach used to produce the February 2024 projections beyond that 10-year period did not allow for a projection of the trust fund’s exhaustion.)
1. See Congressional Budget Office, The 2023 Long-Term Budget Outlook (June 2023), www.cbo.gov/publication/59014. Because most of last year’s projections ended in 2053, this appendix generally makes comparisons only through that year. This year’s long-term budget projections are consistent with the demographic projections the agency published this past January and the economic forecast and 10-year baseline budget projections published in February. For information about those projections, see Congressional Budget Office, The Demographic Outlook: 2024 to 2054 (January 2024), www.cbo.gov/publication/59697, and The Budget and Economic Outlook: 2024 to 2034 (February 2024), www.cbo.gov/publication/59710.
2. For changes in projections of economic factors since 2023, see Appendix B of this report. For changes in projections of demographic factors since 2023, see Congressional Budget Office, The Demographic Outlook: 2024 to 2054 (January 2024), www.cbo.gov/publication/59697.
3. The projected exhaustion dates for the OASI and OASDI trust funds are drawn from CBO’s 10-year baseline projections for fiscal years 2024 to 2034.
4. For details on how CBO’s budget projections for 2024 to 2034 have changed since last year, see Congressional Budget Office, The Budget and Economic Outlook: 2024 to 2034 (February 2024), Chapter 3, www.cbo.gov/publication/59710.
5. The FRA established annual funding limits from 2026 through 2029 that can be enforced using the Congress’s procedures for considering budgetary legislation. The effects of those limits were not included in the agency’s extended baseline projections in 2023. See Congressional Budget Office, The 2023 Long-Term Budget Outlook (June 2023), www.cbo.gov/publication/59014. For a more recent discussion of how the FRA affects CBO’s projections of discretionary funding between 2024 and 2034, see Congressional Budget Office, The Budget and Economic Outlook: 2024 to 2034 (February 2024), Box 1-1, www.cbo.gov/publication/59710.
6. For more details about Social Security benefits and citizenship, see William R. Morton and Abigail F. Kolker, Social Security Benefits for Noncitizens, Report RL32004, version 21 (Congressional Research Service, November 2016), https://tinyurl.com/yd47ebez.
7. CBO will release updated projections of outlays and income for Social Security over the next 75 years later this year. For last year’s long-term projections for Social Security, see Congressional Budget Office, CBO’s 2023 Long-Term Projections for Social Security (June 2023), www.cbo.gov/publication/59184.
8. See Congressional Budget Office, The Budget and Economic Outlook: 2024 to 2034 (February 2024), www.cbo.gov/publication/59710.
About This Document
This volume is one of a series of reports on the state of the budget and the economy that the Congressional Budget Office issues each year. CBO’s long-term budget projections, referred to as the extended baseline, follow the agency’s 10-year baseline budget projections and then extend most of the concepts underlying those projections for an additional 20 years. In keeping with CBO’s mandate to provide objective, impartial analysis, the report makes no recommendations.
Overseen by Molly Dahl and prepared with guidance from Robert Arnold, Richard DeKaser, Devrim Demirel, Edward Harris, John McClelland, Jaeger Nelson, and Julie Topoleski, the report is the work of many analysts at CBO. Molly Dahl prepared the executive summary and wrote Chapter 1 with contributions from Aaron Betz, Devrim Demirel, Daniel Fried, and Jaeger Nelson. Molly Dahl wrote Chapter 2 in collaboration with Kathleen Burke and with contributions from Alia Abdelkader, Xinzhe Cheng, and Charles Pineles-Mark. Aaron Betz wrote Chapter 3 with contributions from Daniel Crown, Edward Gamber, Chandler Lester, Michael McGrane, and Jeffrey Schafer. Molly Dahl compiled Appendix A. Aaron Betz authored Appendix B and Appendix C with contributions from Daniel Crown, Edward Gamber, Evan Herrnstadt, Chandler Lester, and Jeffrey Schafer. Molly Dahl authored Appendix D with contributions from Alia Abdelkader, Kathleen Burke, Xinzhe Cheng, and Charles Pineles-Mark.
Austin Barselau, Cornelia Hall, Noah Meyerson, Eamon Molloy, Hudson Osgood, Aaron Pervin, Dan Ready, Lara Robillard, Sarah Sajewski, Julia Sheriff, Delaney Smith, Robert Stewart, Carolyn Ugolino, Kate Young, and Noah Zwiefel contributed to the analysis in this report with guidance from Christina Hawley Anthony, Barry Blom, Chad Chirico, Elizabeth Cove Delisle, Sean Dunbar, Alexandra Minicozzi, Sam Papenfuss, Asha Saavoss, and Emily Stern.
The long-term budget simulations were coordinated and prepared by Charles Pineles-Mark along with Alia Abdelkader, Xinzhe Cheng, Daniel Crown, and Madeleine Fischer.
Edward Harris, John McClelland, Joseph Rosenberg, and Joshua Shakin coordinated the revenue simulations, which were prepared by Kathleen Burke, Dorian Carloni, Nathaniel Frentz, Bilal Habib, Eshika Kaul, Shannon Mok, Omar Morales, James Pearce, Kevin Perese, Molly Saunders-Scott, Kurt Seibert, Jennifer Shand, Molly Sherlock, Naveen Singhal, Ellen Steele, Emma Uebelhor, and James Williamson.
Robert Arnold, Richard DeKaser, Devrim Demirel, Sebastien Gay, and Jaeger Nelson coordinated the macroeconomic projections, which were prepared by Nicholas Abushacra, Joyce Bai, Grace Berry, Aaron Betz, Daniel Crown, Daniel Fried, Edward Gamber, Ron Gecan, Mark Lasky, Chandler Lester, Kyoung Mook Lim, Michael McGrane, Christine Ostrowski, and Jeffrey Schafer.
Molly Dahl, Xiaotong Niu, Sam Papenfuss, and Julie Topoleski coordinated the population projections, which were developed by Daniel Crown with contributions from Adam Abadi, Rebecca Heller, David Rafferty, and Natalie Tawil.
Lucy Yuan coordinated the fact-checking process, which she contributed to along with Nicholas Abushacra, Grace Berry, and Omar Morales.
Mark Doms, Jeffrey Kling, and Robert Sunshine reviewed the report. Scott Craver, Rebecca Lanning, Loretta Lettner, and Caitlin Verboon edited it, and R. L. Rebach created the graphics and prepared the text for publication. Nicholas Abushacra, Grace Berry, Daniel Crown, and Lucy Yuan prepared the supplemental information files. The report is available at www.cbo.gov/publication/59711.
CBO seeks feedback to make its work as useful as possible. Please send comments to communications@cbo.gov.

Phillip L. Swagel
Director
March 2024