
At a Glance
To help reduce U.S. emissions of carbon dioxide (CO2), the federal government has provided financial support for more than a decade to spur the development and use of technologies for capturing CO2 emissions. Recent legislation has significantly boosted annual funding for those efforts.
In this report, the Congressional Budget Office examines the status, federal support, and future potential of carbon capture and storage (CCS)—a process that involves removing CO2 from the emissions of power plants and industrial facilities and storing it permanently underground. CCS is used to only a small extent today; various factors will affect the degree to which it is used in the future.
- Status of Carbon Capture and Storage. Fifteen CCS facilities are currently operating in the United States. Together, they have the capacity to capture 0.4 percent of the nation’s total annual CO2 emissions. An additional 121 CCS facilities are under construction or in development. If all of them were completed, they would increase the nation’s CCS capacity to 3 percent of current annual CO2 emissions.
Those percentages are small in part because CCS is generally used in sectors that have the lowest costs for capturing CO2—such as natural gas processing and ammonia and ethanol production—and those sectors account for a small share of total U.S. CO2 emissions. Almost all CCS facilities recoup some of their costs by using the captured CO2 to force more oil out of partially depleted oil wells.
- Federal Financial Support for CCS. Annual appropriations for CCS research and related programs totaled $5.3 billion (in nominal dollars) over the 2011–2023 period. Outside the regular appropriation process, the American Recovery and Reinvestment Act of 2009 provided $3.4 billion in funding for CCS programs (some of that funding was spent, and the rest expired). More recently, the 2021 Infrastructure Investment and Jobs Act provides $8.2 billion in advance appropriations for CCS programs over the 2022–2026 period.
In addition, companies that capture and store CO2 are eligible for the section 45Q federal tax credit, which gives them an incentive to use CCS and reduces federal revenues. According to the Treasury, companies claimed a total of $1 billion in those credits from 2010 to 2019. The reconciliation act of 2022 expanded the section 45Q credit significantly. The staff of the Joint Committee on Taxation projects that the tax credit will reduce revenues by about $5 billion over the 2023–2027 period.
- Factors Affecting the Future Use of CCS. The extent to which carbon capture and storage will be used in the future is highly uncertain. Its prospects depend on a variety of factors, including changes in the cost to capture CO2, the availability of pipeline networks and storage capacity for transporting and storing CO2, federal and state regulatory decisions, and the development of clean energy technologies that could affect the demand for CCS.
Notes
This report applies the terminology of the Global CCS Institute in using “CCS facility” to refer to the capture and transport of carbon dioxide for permanent storage as part of an ongoing commercial operation.
Volumes of captured carbon dioxide are reported in metric tons, which equal 1,000 kilograms, or 2,204.6 pounds.
Dollar amounts are expressed in nominal dollars, which measure spending or revenues in a given year in terms of the prices that prevailed at that time, with no adjustment to remove the effects of inflation.
Unless this report indicates otherwise, all years referred to are federal fiscal years, which run from October 1 to September 30 and are designated by the calendar year in which they end.
Numbers in the text, tables, and figures may not add up to totals because of rounding.
Summary
One way the United States can decrease its greenhouse gas emissions to reduce the extent of climate change is to trap emissions of carbon dioxide (CO2) and store them permanently underground. That process, known as carbon capture and storage (CCS), is in limited use in the United States. Recent increases in the federal government’s support for CCS are among a number of factors—whose future course and eventual impact are hard to predict—that will determine the extent to which CCS technology is deployed in coming years.
Current Use of Carbon Capture and Storage
CCS removes carbon dioxide when it is emitted (before it enters the atmosphere) at sources such as electric power and industrial plants and sequesters the captured CO2 underground. A different process, called direct air capture, removes CO2 from the atmosphere. This report focuses on capturing CO2 emissions through CCS where the emissions are generated (called point-source capture).
As of September 2023, 15 CCS facilities were operating in the United States. Most of them are located at plants that process natural gas or produce ethanol for fuel or ammonia for fertilizer. Together, those 15 facilities have the capacity to capture about 22 million metric tons of CO2 per year, or 0.4 percent of the United States’ total annual emissions of CO2. Almost all of those facilities provide the captured CO2 to oil companies, which use it for enhanced oil recovery. In that process, carbon dioxide is injected into partially depleted oil wells, and the pressure from the gas pushes remaining oil to the surface.
The main reason CCS is used to such a limited extent is that the cost to implement CCS technology exceeds its value in most potential settings. Estimates of the cost to capture CO2 come mainly from engineering and economic modeling and can vary widely depending on the assumptions made in that modeling. An indicative range of estimates is from about $15 to $120 per metric ton of CO2 captured, with additional costs for transporting and storing the CO2. Sectors at the lower end of that range provide fewer opportunities for capturing significant amounts of CO2. Relatively large sources of CO2 emissions, such as electric power generation and some industrial production, tend to have CO2 capture costs toward the upper end of that range. Consequently, those sectors have had little economic reason to adopt CCS. The main financial incentives to use CCS are revenues from enhanced oil recovery and a federal tax credit for capturing and storing CO2.
Sources of Federal Financial Support for CCS
The federal government subsidizes the development of CCS technology largely through funding for the Department of Energy; it subsidizes the use of CCS through tax provisions that reduce the cost of capturing and storing CO2. From 2011 to 2023, lawmakers appropriated a total of $5.3 billion (in nominal dollars) for CCS research and related programs. In addition, outside the regular appropriation process, the American Recovery and Reinvestment Act of 2009 (Public Law 111-5) provided $3.4 billion for CCS, and the Infrastructure Investment and Jobs Act (IIJA, P.L. 117-58), enacted in November 2021, provided $8.2 billion.
Companies that capture and store CO2 are eligible for a tax credit per metric ton of carbon dioxide sequestered. That tax provision, the section 45Q tax credit, provides an incentive for the use of CCS and reduces federal revenues. According to the Treasury, companies claimed a total of $1 billion in section 45Q credits from 2010 to 2019. The reconciliation act of 2022 (P.L. 117-169) expanded the tax credit by easing requirements to qualify for it and increasing its value.
Some studies predict that the use of CCS will grow rapidly in the United States over the next decade as companies respond to the CCS demonstration projects funded by the IIJA and the more generous terms of the section 45Q tax credit. Other studies are much more pessimistic about the prospects for CCS and anticipate that modifications to the tax credit will have relatively little impact. In particular, they do not expect the increased value of the credit to encourage many new CCS projects. According to the staff of the Joint Committee on Taxation, the credit will reduce federal revenues by a total of about $5 billion from 2023 to 2027.
Factors Determining the Future Use of CCS
The future adoption of carbon capture and storage will depend on a variety of factors, such as the cost to capture CO2, the cost and capacity to transport and sequester it, federal and state regulations, and the development of clean energy technologies that could decrease the demand for CCS:
- The cost of implementing CCS is likely to influence companies’ future decisions about using the technology. Costs may be reduced as more CCS projects come online and illustrate how best to implement the technology. In addition, researchers are studying ways to make CO2 capture less expensive.
- The availability of pipelines to transport CO2 and underground capacity to store CO2 will also affect the use of CCS. The investment necessary to build a CO2 transport network has been estimated at several billion dollars for a regional network and several hundreds of billions of dollars for a national network. The United States appears to have abundant capacity to store captured CO2, but the suitability of some potential storage sites is still being explored. Scientists are also exploring whether, and at what cost, CO2 can be sequestered permanently in the large volumes that would be needed to contribute significantly to mitigating climate change.
- Regulatory decisions at the federal and state levels will influence the future deployment of CCS. Some types of regulation, such as environmental reviews of CCS projects funded by the federal government, lengthen the time to implement CCS technology. The federal government has recently taken steps that may speed up the review process, such as allowing some state (rather than federal) officials to review applications for CO2 storage sites and enacting legislation to expedite (and possibly even eliminate) the federal government’s environmental reviews. Future regulatory developments, including new rules proposed by the Environmental Protection Agency to limit CO2 emissions from electric power plants, could boost the use of CCS.
- Other clean energy technologies may also play a role in the future deployment of CCS. For example, if clean sources of electric power generation continue to expand and to decline in cost, or if cost-effective substitutes for fossil fuels in industrial processes emerge, those developments will reduce the potential adoption of CCS. Alternatively, if other profitable ways of using captured CO2 besides enhanced oil recovery are discovered, the use of CCS may increase.
Chapter 1Use of Carbon Capture and Storage in the United States
The technology for capturing carbon dioxide emissions and storing them underground is being used to only a small extent in the United States today. The carbon capture and storage facilities now in operation have a total capacity to capture roughly 22 million metric tons of CO2 per year, only 0.4 percent of the nation’s annual CO2 emissions. One likely reason the technology has been so little used is that the cost to install and operate it generally exceeds any financial incentive that companies have to do so.
Interest in carbon capture and storage has grown markedly in recent years, mainly because the federal government has increased its financial support for the technology. Today, CCS facilities with a combined capacity of 134 million tons of CO2 per year are under construction or are being developed. If all of those facilities actually came online, the nation’s total CO2 capture capacity would increase roughly sevenfold—to 156 million tons per year, 3 percent of current annual CO2 emissions in the United States.
How CCS Works and What It Costs
Carbon capture and storage removes CO2 that is produced by burning fossil fuels in power plants or other industrial settings and transports it to sites where it is permanently sequestered underground (see Figure 1-1). Each part of the CCS process—capture, transport, and storage—imposes a cost on companies using the technology. One type of storage, which involves injecting CO2 into partially depleted oil reservoirs to recover more oil, can produce an economic return. That method is typically relied on to offset some of the costs of CCS.1

Capturing CO2
CCS facilities capture carbon dioxide before it enters the atmosphere. The most common approach is to remove CO2 from the exhaust gas that results from using fossil fuels for power or from using various types of carbon-rich matter, such as starch-based crops or limestone, in industrial processes. Generally, a chemical solvent or a porous solid material is used to separate the CO2 from other components of a plant’s exhaust stream. A follow-on process frees the carbon dioxide from the substance used to capture it and isolates it for storage.2 CCS facilities are designed to remove 85 percent to 90 percent of CO2 from emissions, although higher capture rates are considered technically feasible.3
On average, CO2 capture is estimated to account for about three-quarters of the total per-ton cost of implementing CCS.4 The rest of that cost is associated with transportation and storage.
Because CCS removes CO2 where and when the emissions occur, it is referred to as point-source capture of carbon dioxide. Alternatively, CO2 emissions that have already been released into the atmosphere can be removed in a process known as direct air capture. That process, which is also receiving federal support, is less well developed and more expensive than CCS (see Box 1-1 for more details).
Box 1-1.
Capturing Carbon Dioxide Directly From the Atmosphere
Unlike carbon capture and storage (CCS), which removes carbon dioxide (CO2) at the source where it is emitted, direct air capture (DAC) removes CO2 from the atmosphere after it has been emitted. Eliminating CO2 emissions from the transportation and industrial sectors and from other significant sources may prove difficult in the near to medium term for technological reasons. Thus, direct air capture is often viewed as an important tool for CO2 abatement. (As with CCS, the net effect of DAC on total carbon dioxide in the atmosphere is the amount of CO2 captured minus emissions from the energy used to capture it.)
The cost to capture CO2 is greater using DAC than using CCS because the concentration of carbon dioxide is much lower (more diluted) in the atmosphere than in energy- or industrial-sector emissions. In addition, the pressure of the exhaust gas from those sectors is often higher than the pressure of the atmosphere, making CO2 in that exhaust easier to capture. According to the International Energy Agency, the cost to capture a metric ton of CO2 using DAC ranges from $135 to $345, compared with $15 to $120 for CCS in various industrial settings.1 Because DAC is a more experimental process than CCS, estimates of its costs are more uncertain. Other analysts estimate that costs are likely to be much higher—$600 to $1,000 per metric ton, or more—over the next decade.2
For direct air capture to help mitigate climate change, the captured carbon dioxide must be permanently stored. In that respect, DAC offers the advantage that it can be located anywhere. In many cases, a DAC system can be constructed next to or directly above the site where the captured CO2 will be used for enhanced oil recovery or stored underground. CCS, in contrast, is tied to an emitting facility, so its captured CO2 usually has to be transported, at some cost, to a suitable location to be used or stored.
DAC facilities may need to be very large, however. One capable of capturing, for example, a million metric tons of CO2 per year (0.02 percent of the nation’s annual CO2 emissions) would consist of multiple capture units roughly the height of a three-story building that together would occupy an area almost three miles long. Such space needs could limit the areas where DAC can be installed. In addition, choices about sites for DAC facilities must take into account the presence of air pollution, which makes the capture process less effective, and meteorological conditions such as high humidity, which can raise costs.3
The federal government has been providing financial support for DAC programs for several years. Since 2021, the Department of Energy (DOE) has received a total of $119 million in regular appropriations for DAC research, development, and demonstration efforts, with almost half of that funding provided in 2023. Outside the regular appropriation process, the 2021 Infrastructure Investment and Jobs Act (Public Law 117-58) provided DOE with $3.5 billion in one-time funding to develop four regional DAC hubs, which will group CO2 capture sites so they can share transport pipelines, and $115 million for prize competitions to advance DAC technology. In addition, since February 2018, companies that implement DAC have been able to qualify for federal tax credits. The reconciliation act of 2022 (P.L. 117-169) increased those credits to $180 per metric ton of CO2 that is captured and geologically sequestered and $130 per metric ton of CO2 that is used for enhanced oil recovery.
1. International Energy Agency, Energy Technology Perspectives 2020—Special Report on Carbon Capture, Utilization, and Storage: CCUS in Clean Energy Transitions (September 2020), p. 101, https://tinyurl.com/2wb55rzm.
2. Howard J. Herzog, “Direct Air Capture,” in Mai Bui and Niall Mac Dowell, eds., Greenhouse Gas Removal Technologies (Royal Society of Chemistry, 2022), https://tinyurl.com/337w5jtt; and Department of Energy, Pathways to Commercial Liftoff: Carbon Management (April 2023), p. 38, https://liftoff.energy.gov/carbon-management.
3. Howard J. Herzog, “Direct Air Capture,” in Mai Bui and Niall Mac Dowell, eds., Greenhouse Gas Removal Technologies (Royal Society of Chemistry, 2022), https://tinyurl.com/337w5jtt.
Building CCS Into New Plants Versus Retrofitting Old Plants. Incorporating carbon capture and storage into a power plant or industrial facility can be expensive. For example, studies estimate that including CCS when building a new power plant will increase the plant’s capital costs by between roughly 40 percent and almost 100 percent per kilowatt of plant capacity, compared with the capital outlay for a representative conventional power plant.5 That additional cost varies depending on whether the plant is fueled by coal or natural gas and whether the CO2 is captured before or after combustion. (Experience with CCS in commercial power plants is very limited, so such estimates rely heavily on assumptions about the physical and chemical engineering of CCS technology as well as about economic factors.)
The cost increase from incorporating CCS into a new power plant stems not only from the capital outlay for CCS equipment but also from the reduction in the plant’s output, because some of the electricity produced by the plant must be diverted to run the CCS equipment. That “energy penalty” can require a plant to increase its electricity production by anywhere from about one-sixth to almost one-third of what it would produce without using CCS.6 High capital costs, along with cost overruns, were among the factors that contributed to the cancellation of CCS demonstration projects that received large federal subsidies under 2009 legislation (as described in Chapter 2) and other CCS projects in the United States.7
Installing CCS in existing power plants (“retrofitting”) can be more costly than incorporating CCS into the design and construction of a new plant. Space constraints in existing plants can make it harder to install CCS equipment and can require longer pipes and ductwork to connect the equipment to existing machinery. In addition, at power plants that were built before the current, more stringent emission standards were put in place, scrubbers would need to be installed to remove pollutants (such as sulfur dioxide, nitrogen oxide, and mercury) from the plant’s exhaust stream so those gases did not impede the solvent from capturing CO2.
Cost per Metric Ton of CO2 Captured. A more comprehensive measure of the cost to implement CCS than capital outlays is the expense to capture a ton of carbon dioxide. Estimates of that expense illustrate how much the use of CCS will increase the average cost of producing a given amount of electricity or comparable industrial output over the life of a plant—the “levelized cost”—relative to the amount of CO2 captured from that process. The per-ton cost to capture carbon dioxide includes expenses for investment in and operation, maintenance, and fuel consumption of a CCS facility, but it does not reflect the additional CO2 emissions from operating the facility (discussed below).
Estimates of the per-ton cost to capture CO2 vary significantly among studies depending on their engineering and economic assumptions.8 The International Energy Agency (IEA) publishes a representative set of cost estimates for various sectors and industries where CCS can be applied (see Figure 1-2).9 For each industrial application, the estimates show a range of costs, in part because capturing carbon dioxide is subject to economies of scale: The greater the amount of exhaust gas from a plant, the less expensive it is on a per-ton basis to remove CO2 from that exhaust.
Figure 1-2.
Estimated Range of Costs for Capturing a Metric Ton of CO2 in the United States in 2019, by Source
2019 Dollars
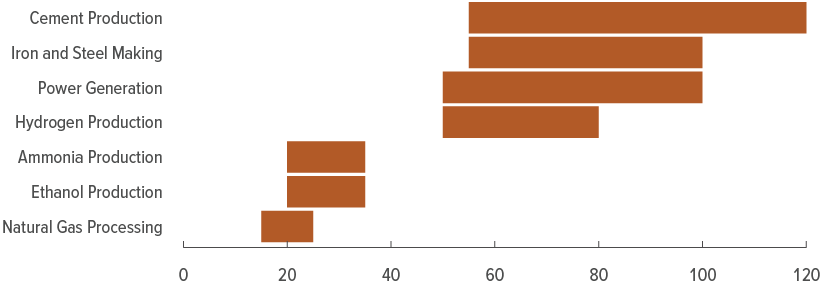
Estimates of the cost to capture a ton of CO2 vary by industry and by such factors as the amount of exhaust gas from a plant, the concentration of CO2 in that exhaust, and its pressure.
Data source: Congressional Budget Office, using data from International Energy Administration, Energy Technology Perspectives 2020—Special Report on Carbon Capture, Utilization, and Storage: CCUS in Clean Energy Transitions (September 2020), p. 101, https://tinyurl.com/2wb55rzm. See www.cbo.gov/publication/59345#data.
Estimates of capture costs include the cost to compress captured CO2 for transport.
CO2 = carbon dioxide.
The per-ton cost of capturing CO2 also varies considerably among industries. A comparison of estimates from the IEA shows industries falling into two main cost groups:
- CO2 capture is less expensive—roughly $15 to $35 per metric ton (in 2019 dollars)—in natural gas processing and ammonia and ethanol production.
- CO2 capture is more expensive—roughly $50 to $120 per metric ton—in power generation and other industrial processes, such as the production of cement, iron, steel, or hydrogen.
Differences in CO2 capture costs stem not only from the amount of a plant’s exhaust gas but also from the concentration (or purity) of the carbon dioxide in that exhaust and from its pressure. The higher the concentration of CO2 and the higher the pressure, the cheaper it is to capture a given amount of CO2.10 For example, capturing CO2 in the exhaust gas from ethanol production is relatively inexpensive because the concentration of CO2 is very high (although the exhaust stream has very low pressure). Capturing CO2 in the exhaust from natural gas processing and ammonia production is also relatively inexpensive because, although the CO2 concentrations are not as high as in ethanol production, the exhaust streams are emitted at very high pressure. In comparison, the relatively low CO2 concentration and pressure in the exhaust streams from power generation and other industrial processes make capturing CO2 more costly.
Effects of CO2 Emissions From Operating CCS Facilities. Equipment for capturing carbon dioxide emissions requires energy to operate. Depending on its source, producing that energy can generate carbon dioxide, thereby adding to CO2 emissions. Thus, when assessing the potential of CCS to reduce CO2 emissions, it is important to distinguish between the amount of carbon dioxide that use of CCS technology captures and the amount that it avoids. (For the purpose of comparing the cost of CCS with other approaches for abating CO2 emissions, the cost to avoid a ton of carbon dioxide is the relevant measure.)
CCS traps less than 100 percent of the CO2 emissions where it is applied, so if the electricity to run the capture equipment comes from a power plant that burns fossil fuels, the amount of CO2 avoided by using CCS will be less than the amount captured—even if the power plant generating that electricity also uses CCS. As a result, the cost per ton of CO2 avoided will be higher than the cost per ton of CO2 captured (the type of cost shown in Figure 1-2). For power plants that divert some of their electricity production to run CCS equipment, the cost per ton of CO2 avoided will be an estimated 20 percent to almost 40 percent higher than the cost per ton of CO2 captured.11
Transporting and Storing CO2
After it has been captured, CO2 is purified and compressed to produce a concentrated stream of pressurized liquid that can be transported, generally through pipelines, to storage sites. The United States currently has about 5,200 miles of pipelines that carry carbon dioxide. CCS facilities are typically located near major (“trunk”) pipelines and storage sites to minimize the length of the pipelines needed and to exploit economies of scale in their capacity. Increasing the diameter of a pipeline by a given amount allows a disproportionately larger amount of CO2 to be transported through it, thus reducing transport costs per unit of CO2 carried. Several other factors affect the cost to build pipelines and transport CO2 through them. For example, offshore pipeline projects are more expensive than onshore ones. And among onshore pipelines, differences in terrain—such as whether the pipeline crosses mountains or large rivers—affect costs.
Two ways currently exist for permanently storing carbon dioxide underground: enhanced oil recovery (EOR) and geologic sequestration.12 In almost all cases, U.S. facilities that capture CO2 send it to oil fields to be used for EOR, which allows those facilities to recoup some of their CCS costs. In enhanced oil recovery, CO2 is injected into underground oil reservoirs to dislodge oil that remains after the initial phases of extraction. Some of the injected CO2 returns to the surface with the dislodged oil and is recycled in the EOR process to recover more oil, until almost all of the carbon dioxide remains trapped underground. (CCS provides only about one-fifth of the carbon dioxide used for EOR; the rest is extracted from naturally occurring reservoirs.)
In geologic sequestration, by contrast, CO2 is injected into porous rock, such as a saline formation, a half mile or more below the surface to ensure that it remains trapped. With either geologic sequestration or EOR, the injected CO2 is sealed permanently underground by a layer of low-permeability rock, known as caprock, that overlays the storage formation (see Figure 1-1).
Like estimates of capture costs, estimates of transport and storage costs are often based on modeling. A study by the National Petroleum Council calculated potential transport and geologic sequestration costs for the largest 80 percent of stationary CO2 emitters in the United States in 2018.13 It estimated that CO2 transport costs for those emitters would range from $2 to $38 per metric ton, and storage costs would range from $7 to $11 per metric ton.
Those estimates are subject to several qualifications. For example, because the study covered many potential CO2 capture sites, it most likely included a sizable number for which CCS would probably not be profitable unless a very high price was placed on CO2 emissions or a large federal subsidy was offered for CO2 abatement. In addition, the study assumed that captured CO2 would be geologically sequestered, whereas virtually all current CCS facilities in the United States ship their CO2 to be used in enhanced oil recovery—for which they are paid, rather than being charged for storage. Nevertheless, if a large amount of captured CO2 is to be stored permanently, it will need to be stored through geologic sequestration (as discussed in Chapter 3).
The wide range of CO2 transport costs probably reflects their sensitivity to factors that are likely to vary significantly among capture locations, such as the distance from the CCS facility to the closest storage site, the amount of CO2 that will be transported in one pipeline (which affects economies of scale and transport costs), and the type of terrain traversed by the pipelines. Storage costs vary less. Their average, about $8 per metric ton, is determined largely by the cost of storage in the Gulf Coast and South-Central regions of the United States, which contain most of the country’s saline formations.14
CCS Facilities Currently in Operation
The use of carbon capture and storage is still rare in the United States. Only 15 facilities are currently capturing and transporting CO2 for permanent storage as part of an ongoing commercial operation (see Table 1-1). The use of CCS is generally limited to industrial processes, particularly those in which the cost to capture CO2 is low, such as processing natural gas, producing ammonia for fertilizer, and producing ethanol for vehicle fuel and other uses.
Table 1-1.
CCS Facilities Currently Operating in the United States
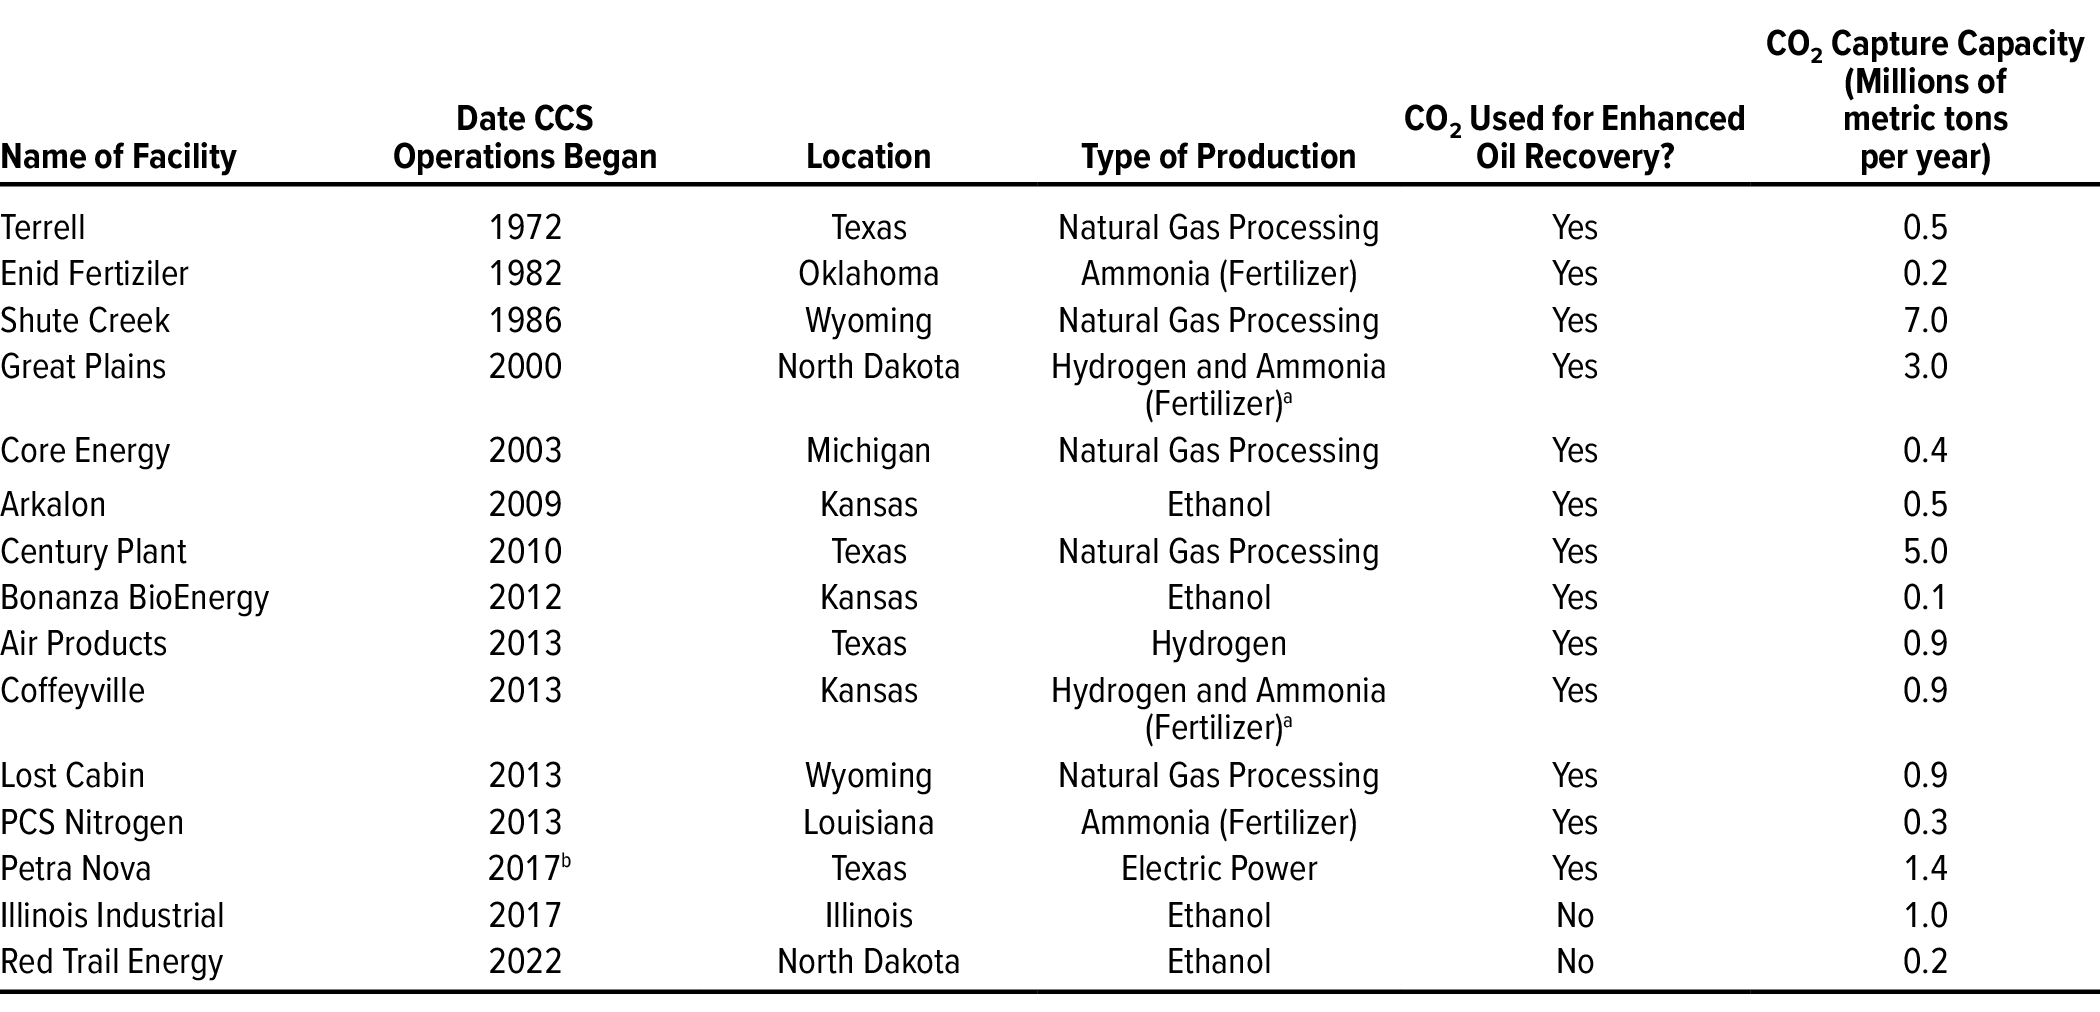
Data source: Congressional Budget Office, using data from the Global CCS Institute. See www.cbo.gov/publication/59345#data.
CCS = carbon capture and storage; CO2 = carbon dioxide.
a. Gasification of coal- or petroleum-based coke results in a mixture of hydrogen and other elements, which can be used to produce ammonia.
b. The Petra Nova CCS facility shut down in 2020 and reopened in 2023.
The industrial processes where CCS is used now tend to have relatively low CO2 emissions. For example, in 2021, natural gas processing, ethanol production, and ammonia production accounted for only 83 million, or 3.3 percent, of the 2,483 million metric tons of CO2 emissions from the major U.S. sources to which CCS can be applied (see Figure 1-3). Both the small number of CCS facilities in operation and the low CO2 emissions of their industries mean that CCS today captures only about 22 million tons, or 0.4 percent, of the nation’s total annual emissions of CO2.
Figure 1-3.
CO2 Emissions in the United States in 2021 From Sources That Are Potential Candidates for Carbon Capture and Storage
Millions of Metric Tons

Emissions sources that have low capture costs for CO2 and hence are more likely to use carbon capture and storage—such as ammonia and ethanol production and natural gas processing—are responsible for only a small share of CO2 emissions.
Data source: Congressional Budget Office, using data from Environmental Protection Agency, Inventory of U.S. Greenhouse Gas Emissions and Sinks, 1990–2021 (April 2023), https://tinyurl.com/m75czcrk; and Government Accountability Office, Decarbonization: Status, Challenges, and Policy Options for Carbon Capture, Utilization, and Storage, GAO-22-105274 (September 29, 2022), Table 4, p. 10, www.gao.gov/products/gao-22-105274. See www.cbo.gov/publication/59345#data.
The CO2 emissions shown here for the “Electric Power” and “Industrial Energy” categories are combustion emissions, which result from burning fossil fuels to generate power. The CO2 emissions shown here for the other categories are process emissions, which result from chemical reactions in the respective production processes. If a plant generates its own electricity to power an industrial process, the CO2 emissions from that plant will be included in the “Industrial Energy” category.
CO2 = carbon dioxide.
CCS Projects Under Construction or in Development
The past several years have seen a marked rise in initiatives to deploy carbon capture and storage technology in the United States. As discussed in Chapter 2, the federal government has increased its funding for CCS programs in recent years and expanded its tax credit for capturing and storing CO2. In addition to the 15 CCS facilities currently operating, 121 facilities were under construction or in various stages of development as of September 2023, with completion generally planned through the 2020s. (For some projects, especially in the electric power sector, completion dates have not yet been set.) If all 121 of those future projects were completed, they would add 134 million tons to the nation’s annual capacity to capture CO2 (see Table 1-2).
Table 1-2.
CCS Facilities in Construction or Development in the United States as of September 2023

Data source: Congressional Budget Office, using data from Global CCS Institute, Global Status of CCS 2023: Scaling Up Through 2030 (November 2023), pp. 76–92, https://tinyurl.com/3sev7ua9. See www.cbo.gov/publication/59345#data.
CCS = carbon capture and storage; CO2 = carbon dioxide.
a. Projects at the stage of advanced development are ones for which front-end engineering and design are underway or have been completed; projects at the stage of early development are ones for which a feasibility or prefeasibility study is underway.
The amount of CO2 capture capacity that comes online in the next decade could be larger or smaller than 134 million tons per year for several reasons. On the one hand, the CCS project totals in Table 1-2 may understate what will be undertaken in the near future because, for some projects, the companies that have proposed them are still evaluating their CO2 capture capacity, and that future capacity has not yet been reported.
On the other hand, the projects shown in Table 1-2 may overstate the near-term prospects for greater deployment of CCS. For example, projects that are at the early-development stage could probably be terminated or scaled back sharply without causing a significant financial loss for their companies. Those projects account for about one-third of the total CO2 capture capacity of the CCS facilities included in Table 1-2 In particular, recent increases in construction costs may have reduced the profitability of some projects in development.
The commercial expansion of CCS suggested by Table 1-2 is limited in other respects as well. For instance, one company, Summit Carbon Solutions, is the primary partner in roughly half of the projects at the advanced-development stage (accounting for 11 percent of the expected CO2 capture capacity of the projects at that stage). Thus, the number of companies implementing CCS is not as large as the total number of planned projects might suggest. Moreover, all of the companies partnering with Summit Carbon Solutions produce ethanol. In those projects, CCS would continue to be applied in the low-cost, low-emissions industrial processes that typify its use today.15
1. Carbon dioxide can be stored for long periods in other ways, such as by incorporating it into durable products, by preserving forests, and by using other techniques to manage land and crops. For a discussion of biological methods of sequestering CO2, see Congressional Budget Office, The Potential for Carbon Sequestration in the United States (September 2007), www.cbo.gov/publication/19138.
2. For more details about CO2 capture and the specific methods used in CCS facilities in the United States, see Angela C. Jones and Ashley J. Lawson, Carbon Capture and Sequestration (CCS) in the United States, Report R44902, version 17 (Congressional Research Service, October 5, 2022), https://tinyurl.com/5f5awy29; and International Energy Agency, Energy Technology Perspectives 2020—Special Report on Carbon Capture, Utilization, and Storage: CCUS in Clean Energy Transitions (September 2020), pp. 98–100, https://tinyurl.com/2wb55rzm.
3. International Energy Agency, Energy Technology Perspectives 2020—Special Report on Carbon Capture, Utilization, and Storage: CCUS in Clean Energy Transitions (September 2020), pp. 102–103, https://tinyurl.com/2wb55rzm.
4. National Petroleum Council, “CCUS Supply Chains and Economics,” Chapter 2 in Meeting the Dual Challenge: A Roadmap to At-Scale Deployment of Carbon Capture, Use, and Storage (December 2019, updated March 12, 2021), pp. 2-5 and 2-14, https://tinyurl.com/2s46ry2e.
5. The additional capital costs include equipment for compressing CO2 so it can be transported for storage as well as equipment for capturing CO2. See Edward S. Rubin, John E. Davison, and Howard J. Herzog, “The Cost of CO2 Capture and Storage,” International Journal of Greenhouse Gas Control, vol. 40 (September 2015), Tables 2–6, pp. 382–386, https://tinyurl.com/52cxst9m.
6. Ibid.
7. Peter Folger, Recovery Act Funding for DOE Carbon Capture and Sequestration (CCS) Projects, Report R44387, version 3 (Congressional Research Service, February 18, 2016), https://tinyurl.com/bddh9bnn; and Ahmed Abdulla and others, “Explaining Successful and Failed Investments in U.S. Carbon Capture and Storage Using Empirical and Expert Assessments,” Environmental Research Letters, vol. 16, no. 1 (January 2021), https://tinyurl.com/yrb4e7rb.
8. Edward S. Rubin, “Understanding the Pitfalls of CCS Cost Estimates,” International Journal of Greenhouse Gas Control, vol. 10 (September 2012), pp. 181–190, https://tinyurl.com/2r3navfv.
9. International Energy Agency, Energy Technology Perspectives 2020—Special Report on Carbon Capture, Utilization, and Storage: CCUS in Clean Energy Transitions (September 2020), p. 101, https://tinyurl.com/2wb55rzm. The estimates in Figure 1-2 are consistent with recent work on CCS by the Department of Energy; see Sydney Hughes and others, Cost of Capturing CO2 From Industrial Sources (National Energy Technology Laboratory, July 15, 2022), https://tinyurl.com/55xc5rmh; and Tommy Schmitt and others, Cost and Performance Baseline for Fossil Energy Plants, Volume 1: Bituminous Coal and Natural Gas to Electricity (National Energy Technology Laboratory, October 14, 2022), https://tinyurl.com/yckmk88a.
10. The product of CO2 concentration and air pressure in a gas stream is known as the “partial pressure”; that metric is often used as a summary measure of how readily CO2 can be captured from a gas stream. See Howard J. Herzog, Carbon Capture (MIT Press, 2018), https://tinyurl.com/3p6hvwda.
11. Edward S. Rubin, John E. Davison, and Howard J. Herzog, “The Cost of CO2 Capture and Storage,” International Journal of Greenhouse Gas Control, vol. 40 (September 2015), Tables 2–6, pp. 382–386, https://tinyurl.com/52cxst9m.
12. Although enhanced oil recovery is a form of geologic sequestration, this report—like other discussions of CCS—distinguishes between EOR and geologic sequestration as distinct ways of permanently storing CO2.
13. National Petroleum Council, “CCUS Supply Chains and Economics,” Chapter 2 in Meeting the Dual Challenge: A Roadmap to At-Scale Deployment of Carbon Capture, Use, and Storage (December 2019, updated March 12, 2021), pp. 2-13–2-15 and 2-21–2-24, https://tinyurl.com/2s46ry2e.
14. Ibid., p. 2-24.
15. Global CCS Institute, Global Status of CCS 2023: Scaling Up Through 2030 (November 2023), pp. 80–84, https://tinyurl.com/3sev7ua9.
Chapter 2Federal Financial Support for Carbon Capture and Storage
The federal government mainly subsidizes carbon capture and storage through funding for the Department of Energy (DOE) and tax credits available to companies using CCS technology. Both the amount of funding for CCS programs and the size of the tax credits have increased in recent years. Besides annual appropriations, which totaled $340 million in 2023, federal CCS programs received a total of $8.2 billion in advance appropriations for the 2022–2026 period from the Infrastructure Investment and Jobs Act (IIJA). In addition, the reconciliation act of 2022 increased the value of the tax credit for capturing and storing CO2 by 70 percent.
Federal Funding for CCS
Federal funding for CCS programs is provided annually through appropriation acts and periodically through other laws, such as the American Recovery and Reinvestment Act of 2009 (ARRA) and the IIJA in 2021. Both of those laws required DOE to carry out demonstration projects that are intended to further the deployment of CCS by demonstrating its commercial-scale viability and by allowing companies to gain experience in using CCS technology, which can lower the cost of later installations.1
Funding Through Annual Appropriations
From 2011 to 2023, lawmakers appropriated a total of $5.3 billion (in nominal dollars) to DOE for CCS research and related programs. Roughly half of that funding was directed to programs that focus on capture or storage of carbon dioxide (see Table 2-1).2 The rest went to programs that have objectives similar to those of CCS but are not exclusively dedicated to it, such as research and development (R&D) to use coal more cleanly and to improve the efficiency of turbines that generate electricity from fossil-fuel combustion. Over the past several years, the focus of those programs’ R&D has generally shifted from fossil fuels to hydrogen.
Table 2-1.
Annual Funding by the Department of Energy for CCS and Related Programs, 2011 to 2023
Millions of Dollars
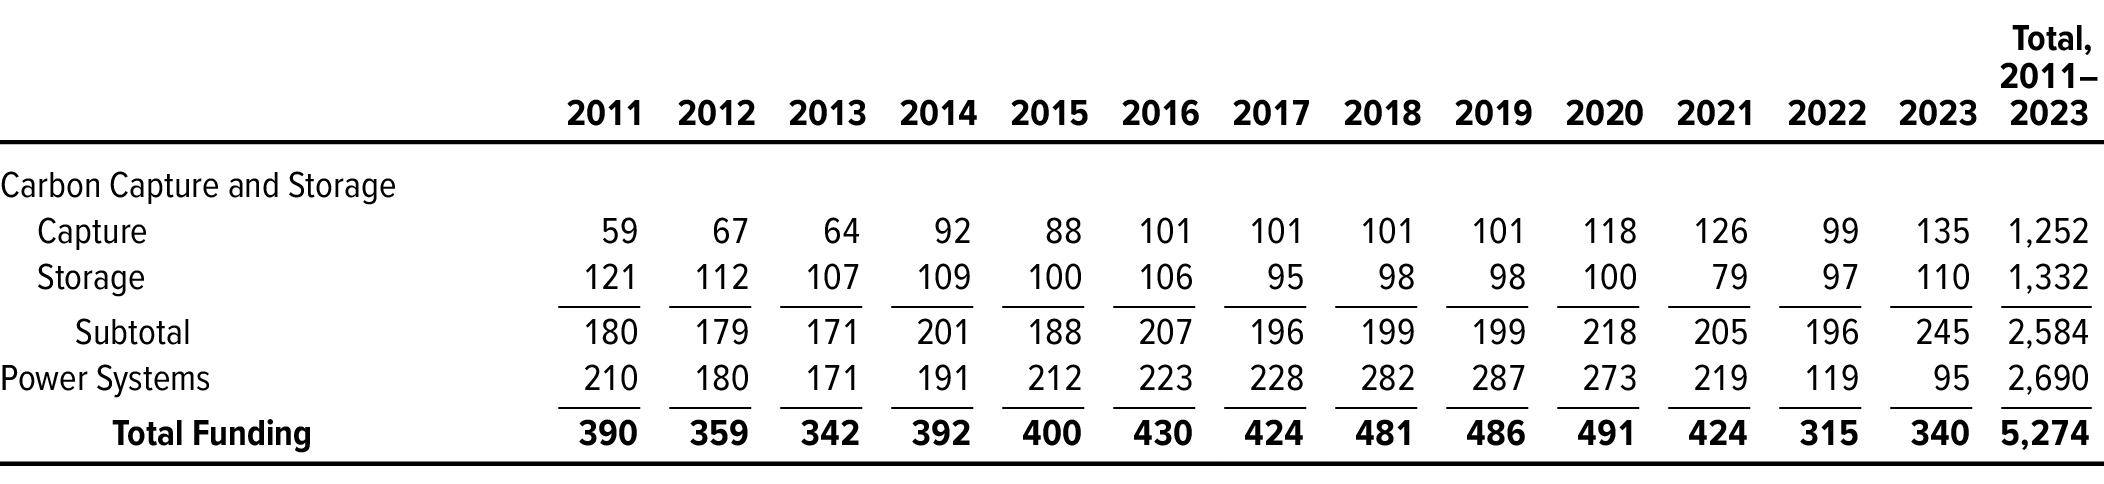
Data source: Congressional Budget Office, using budget documents from the Office of Fossil Energy and Carbon Management at the Department of Energy. See www.cbo.gov/publication/59345#data.
Funding for CCS programs shown here does not include a onetime appropriation of $3.4 billion from the American Recovery and Reinvestment Act of 2009; the unspent portions of that funding have expired. Funding also excludes $8.2 billion for CCS programs from the Infrastructure Investment and Jobs Act; details of that appropriation are shown in Table 2-2.
CCS = carbon capture and storage.
Funding Through ARRA and IIJA
In addition to annual funding, the federal government has provided financial support to CCS programs through at least two laws outside the regular appropriations process. ARRA provided $3.4 billion for CCS.3 Roughly $2.6 billion (just over three-quarters) of that total was allocated to nine large demonstration projects.4 Five of the projects were intended to demonstrate the use of CCS in coal-fired power plants and the other four in various industrial applications. The biggest project, an electric power project called FutureGen, received approximately $1 billion in federal funding to demonstrate CO2 capture, transport, and storage. Most of the large demonstration projects funded through ARRA were not completed; of the $2.6 billion, $1.2 billion was spent (see Box 2-1 for more details).5
Box 2-1.
CCS Demonstration Projects Funded by the American Recovery and Reinvestment Act of 2009
Of the funds provided in 2009 by the American Recovery and Reinvestment Act, or ARRA (Public Law 111-5), the Department of Energy allocated $2.6 billion to nine large projects to demonstrate the use of carbon capture and storage (CCS) in various settings. Those demonstration projects had mixed results; in all, about $1.2 billion of the $2.6 billion was spent.
CCS projects at electric power plants, in particular, fell well short of commercialization. Outlays for the largest electric power project, FutureGen, amounted to just 20 percent of its ARRA funding. Only the Petra Nova CCS facility spent all of its funding allocation. (After beginning operations in January 2017, that facility was shut down in May 2020 and reopened in September 2023.)1
Compared with the electric power projects, ARRA’s large demonstration projects for CCS in various industries advanced farther. Two of those projects—Air Products and Illinois Industrial—entered into service and are still operating. Only one of the industry projects did not spend all of the available federal funds.
Although most of the large CCS projects funded by ARRA did not reach the commercialization stage, they provided information that proved useful to later projects.2 In addition, by the mid-2010s, ARRA-funded projects had sequestered 10 million metric tons of carbon dioxide.
A number of explanations have been advanced for why the large CCS demonstration projects funded by ARRA, especially those at power plants, were not more successful:
- Some aspects of implementing CCS, such as obtaining approval from the Environmental Protection Agency for geologic sequestration of carbon dioxide, were being attempted for the first time. (The length of that approval process was one factor contributing to the delays encountered by FutureGen.)
- The scale of the large demonstration projects may be a proxy for their complexity, and their technical challenges may have been difficult to surmount. Together with high investment costs, those challenges led to large cost overruns that made it too expensive for some companies to complete their projects.
- For demonstrations of CCS at coal-fired power plants, some evidence suggests that unexpected economic developments, such as falling natural gas prices, negatively affected the future profitability of those plants and thus the viability of CCS projects there.
- Recent analysis has focused on the Department of Energy’s management of the large CCS demonstration projects. That research has suggested that poor project selection and bypassing of cost controls by the department were factors that increased the financial loss to the federal government.3
1. Another large CCS demonstration project at a power plant, the Kemper County Energy Facility in Mississippi, received $270 million in federal funding outside the ARRA appropriation. Like some of the projects described above, construction of the CO2 capture facility at that power plant was never completed. See Peter Folger, Recovery Act Funding for DOE Carbon Capture and Sequestration (CCS) Projects, Report R44387, version 3 (Congressional Research Service, February 18, 2016), https://tinyurl.com/bddh9bnn.
2. Ibid., p. 17.
3. Government Accountability Office, Carbon Capture and Storage: Actions Needed to Improve DOE Management of Demonstration Projects, GAO-22-105111 (December 20, 2021), www.gao.gov/products/gao-22-105111.
In addition, $0.6 billion of ARRA’s funding for CCS was allocated to 52 smaller projects to advance the use of CCS in industry. The remaining funding for CCS largely went to other activities, including surveys to identify suitable geological sites for CO2 storage.
More recently, the Infrastructure Investment and Jobs Act (Public Law 117-58) provided $8.2 billion in advance appropriations for CCS. That funding is available in various amounts each year from 2022 to 2026, mostly in 2022 and 2023 (see Table 2-2), and will remain available until it is expended. It is in addition to the annual appropriations shown in Table 2-1. As of the end of fiscal year 2023, most of that funding had not been obligated. (An obligation is a legally binding commitment by the federal government that will result in outlays, immediately or in the future.)
Table 2-2.
Annual Funding for CCS Programs in the Infrastructure Investment and Jobs Act, 2022 to 2026
Millions of Dollars

Data source: Congressional Budget Office, using data from the Infrastructure Investment and Jobs Act (Public Law 117-58), division J—Appropriations. See www.cbo.gov/publication/59345#data.
Funding shown here for 2023 to 2026 is advance appropriations; for all programs, those amounts remain available until expended.
CCS = carbon capture and storage; CIFIA = Carbon Dioxide Transportation Infrastructure Finance and Innovation Act; IIJA = Infrastructure Investment and Jobs Act.
a. The front-end engineering and design phase of a project is intended to produce engineering documents and cost estimates that will support an eventual investment decision.
Like ARRA’s, the IIJA’s funding for carbon capture and storage tends to emphasize programs that aim to implement CCS at scale. In particular, the IIJA provided $3.5 billion to carry out demonstration projects and large-scale pilot projects for CO2 capture under programs authorized by the Energy Policy Act of 2005.6
The IIJA also created and funded two programs that address CO2 transport and storage. The Carbon Dioxide Transportation Infrastructure Finance and Innovation Act (CIFIA) program, which received $2.1 billion in the IIJA, will mainly offer loans and loan guarantees for the construction of CO2 pipelines.7 Another initiative, for which the IIJA provided $2.5 billion, will award grants to develop new or expanded large-scale commercial carbon storage projects. Activities that are eligible for funding include feasibility studies, site surveying, permitting, and construction.8
Federal Tax Credit for CCS
In addition to the Department of Energy’s spending on CCS programs, the federal tax code has contained a provision since 2008 that allows companies that use CCS to apply a credit to reduce the amount of taxes they owe. The tax credit, known as the section 45Q credit after its location in the Internal Revenue Code, is assessed per metric ton of CO2 captured and stored.9 (Since 2018, the credit has also applied to carbon oxide.) A company is eligible for the credit if the amount of CO2 it captures in a year meets a threshold level. That threshold varies by whether the facility capturing the CO2 is an electric power plant, a facility for direct air capture (DAC), or another type of facility. A company can claim the credit for up to 12 years, and the value of the credit is greater if the captured CO2 is geologically sequestered than if it is used for enhanced oil recovery. According to the Treasury, a total of about $1 billion in section 45Q credits were claimed from tax years 2010 to 2019.10
Recent Changes to the Tax Credit
The reconciliation act of 2022 (P.L. 117-169) made several important changes to the section 45Q tax credit. It extended to January 1, 2033, the date by which construction must begin on a CCS facility for the CO2 that is captured and stored to count toward the tax credit. That law also made the credit more generous in various ways:
- The annual CO2 capture threshold for claiming the credit was reduced significantly—by more than 96 percent for most types of electric power plants, by 99 percent for DAC facilities, and by at least 50 percent for other facilities.
- The value of the credit for CCS was increased by 70 percent (relative to the maximum value under prior law), to $85 per metric ton for CO2 that is geologically sequestered and to $60 per metric ton for CO2 that is stored through EOR. The value of the credit for DAC was increased by more than 250 percent, to $180 per metric ton of CO2 for geologic sequestration and to $130 per metric ton for EOR. After calendar year 2026, the credit’s values will be adjusted each year to rise with inflation.11
- For-profit companies can now receive the tax credit as a direct payment during their first five years of eligibility. (Tax-exempt entities can receive direct payments over the entire 12-year period of the credit.) The credit can also be transferred to an unaffiliated third party in exchange for a cash payment.
- The amount of the credit that companies forgo if they finance their investments in CCS or DAC with qualified private activity bonds has been decreased. (The IIJA allowed companies to issue those tax-exempt bonds for carbon capture projects.)
Companies must comply with several new requirements to qualify for the expanded section 45Q tax credit. For electricity-generating facilities, the capture equipment must have “a design capacity of not less than 75 percent of the baseline carbon dioxide production” of the facility. In addition, for CCS or DAC facilities to be eligible for the increased value of the tax credit, companies must comply with stipulations about wages and apprenticeships; otherwise, the value of their credit will default to a level much lower than the amount previously available.12
Effects of the Tax Credit
Studies vary widely in their estimates of the impact that the expanded CCS tax credit will have over the next decade. Some studies project that use of CCS will increase in response to both the demonstration projects funded by the IIJA and the reduction in emissions thresholds and increase in values for the section 45Q tax credit. According to those analyses, additional CO2 capture capacity of at least 100 million tons per year will be installed by the early 2030s, and the federal government’s revenue loss from companies’ claiming CCS tax credits associated with that additional capacity will total anywhere from $30 billion to well over $100 billion.13
Other studies are less optimistic about the near-term prospects for CCS, despite the greater financial incentives for its use. In particular, they do not expect the increased value of the section 45Q credit to encourage many new CCS projects.14 The staff of the Joint Committee on Taxation projects that the credit will reduce federal revenues by about $5 billion over the 2023–2027 period.15
The section 45Q tax credit has come under several types of criticism. The Treasury’s estimate of $1 billion in section 45Q credits claimed from tax years 2010 to 2019 resulted from an investigation into whether companies claiming the credit had appropriately documented to the Environmental Protection Agency the amount of CO2 they reported capturing and storing. For almost 90 percent of the credits claimed, that was found not to be the case. The Internal Revenue Service issued rule changes intended to address that issue.16
Another criticism of the tax credit is that it compensates companies for the carbon dioxide they capture and store rather than for the CO2 they avoid. Thus, the credit does not account for the CO2 emissions produced by the manufacture and use of carbon capture technology or by the transport and storage of captured CO2. With enhanced oil recovery, in particular, both the process of injecting captured CO2 into oil reserves and the eventual use of the recovered oil produce CO2 emissions. To the extent that the oil would not have been recovered without the use of captured CO2, those additional emissions offset some of the emission reductions achieved through CO2 storage. The size of the offset depends on conditions in oil markets (which influence the demand for oil), the amount of oil supplied through EOR, the type and duration of the EOR process used, and the characteristics of the oil field.17
1. In addition, the reconciliation act of 2022 (Public Law 117-169) funded existing and new loan programs (the Advanced Fossil loan program and the Energy Infrastructure Reinvestment loan programs) that could end up subsidizing the use of CCS along with other clean energy technologies. That law also appropriated $5.8 billion for the Advanced Industrial Facilities Deployment Program, which could similarly provide financial support for CCS.
2. Before 2011, the DOE programs that provided funding for CCS from annual appropriations were organized differently than what is shown in Table 2-1, and much less detail on CCS-specific funding was available. See Congressional Budget Office, Federal Efforts to Reduce the Cost of Capturing and Storing Carbon Dioxide (June 2012), www.cbo.gov/publication/43357.
3. P.L. 111-5, div. A, tit. IV; 123 Stat. 115, 139.
4. Peter Folger, Recovery Act Funding for DOE Carbon Capture and Sequestration (CCS) Projects, Report R44387, version 3 (Congressional Research Service, February 18, 2016), Table 2, p. 7, https://tinyurl.com/bddh9bnn.
5. The rest cannot be spent. The $3.4 billion provided by ARRA for CCS programs was available to obligate through September 30, 2010; see P.L. 111-5, div. A, tit. XVI, § 1603; 123 Stat. 302. Once funding expired on September 30, 2010, remaining balances could be used for up to five years to record, adjust, and liquidate obligations properly chargeable to the account during the period of availability; see 31 U.S.C. § 1553(a). Any remaining balance was then canceled and was no longer available for any obligations or expenditures; see 31 U.S.C. § 1552.
6. That 2005 law (P.L. 109-58) also authorized federal funding for front-end engineering and design of CCS facilities, a program that the IIJA provides $0.1 billion for over the 2022–2026 period.
7. Under the Federal Credit Reform Act of 1990, the budgetary cost of federal loans or loan guarantees is measured as the present value of the future net cost expected from loans or loan guarantees made in the current budget year. (A present value is a single number that expresses a flow of current and future income or payments in terms of an equivalent lump sum received or paid at a specific time.) A net cost (recorded as outlays) can occur in two ways. First, it can result from any interest rate subsidy that the government provides on direct loans. Second, it can result from projected defaults on loans the government has made and from payouts the government expects to make when loans made by other lenders, for which the government has guaranteed the payment of principal and interest, go into default. As a result, the $2.1 billion in federal credit assistance provided under the IIJA may leverage a much larger total amount of loans.
8. The IIJA also provided $8 billion to support the development of regional clean hydrogen hubs, which can provide an opportunity for expanded use of CCS. Those hubs will consist of groups of closely located hydrogen producers, consumers, and related infrastructure that aim to demonstrate and spur hydrogen development. At least one of the hubs that has received funding under that program plans to use CCS; see Department of Energy, “Biden-Harris Administration Announces $7 Billion for America’s First Clean Hydrogen Hubs, Driving Clean Manufacturing and Delivering New Economic Opportunities Nationwide” (October 13, 2023), https://tinyurl.com/yuepvkpz.
9. For more details, see Angela C. Jones and Donald J. Marples, The Section 45Q Tax Credit for Carbon Sequestration, In Focus 11455, version 4 (Congressional Research Service, August 25, 2023), https://tinyurl.com/4fdbubpp. Smaller federal tax credits are also available for CO2 capture alone; see Council on Environmental Quality, Report to Congress on Carbon Capture, Utilization, and Sequestration (June 30, 2021), p. 48, https://tinyurl.com/mprkuyr6 (PDF).
10. J. Russell George, Inspector General, Department of the Treasury, letter to the Honorable Robert Menendez (April 15, 2020), https://tinyurl.com/36j9k5e4. Although the tax year for individuals is typically the same as the calendar year, companies can file taxes annually for a 12-month period ending in any month.
11. The inflation adjustment for the section 45Q tax credit, which will be based on the gross national product implicit price deflator, is consistent with regulations that were in place before the enactment of the 2022 reconciliation act; see 26 U.S.C. §45Q(b)(1)(A)(ii) and 26 U.S.C. §43(b)(3).
12. 26 U.S.C. §45(b)(7) and 26 U.S.C. §45(b)(8). The Treasury has issued preliminary guidance about how companies can meet those requirements; see Increased Credit or Deduction Amounts for Satisfying Certain Prevailing Wage and Registered Apprenticeship Requirements, 88 Fed. Reg. 60018 (August 30, 2023), https://tinyurl.com/36mjamvf.
13. John Bistline, Neil Mehrotra, and Catherine Wolfram, “Economic Implications of the Climate Provisions of the Inflation Reduction Act,” Brookings Papers on Economic Activity (Spring 2023), pp. 14–16, https://tinyurl.com/5fbj665f; Goldman Sachs, Carbonomics: The Third American Energy Revolution (March 22, 2023), pp. 48–52, https://tinyurl.com/2d6ahehj; and Credit Suisse, U.S. Inflation Reduction Act—A Tipping Point in Climate Action (September 28, 2022), pp. 16, 28–31, and 68–72, https://tinyurl.com/3t8ythc8. (The reconciliation act of 2022 is sometimes called the Inflation Reduction Act.)
14. Energy Futures Initiative, Turning CCS Projects in Heavy Industry and Power Into Blue Chip Financial Investments (February 2023), pp. ES-5–ES-6, 12, and 25–29, https://tinyurl.com/4rwvz37x.
15. Joint Committee on Taxation, Estimates of Federal Tax Expenditures for Fiscal Years 2023–2027, JCX-59-23 (December 7, 2023), p. 30, www.jct.gov/publications/2023/jcx-59-23.
16. Angela C. Jones, Reporting Carbon Dioxide Injection and Storage: Federal Authorities and Programs, Report R46757 (Congressional Research Service, April 13, 2021), https://tinyurl.com/yc24h8bu.
17. Vanessa Núñez-López and Emily Moskal, “Potential of CO2-EOR for Near-Term Decarbonization,” Frontiers in Climate, vol. 1 (September 27, 2019), https://tinyurl.com/4pw96vrr.
Chapter 3Factors Determining the Future Use of Carbon Capture and Storage
The extent to which carbon capture and storage becomes more widely used in the United States will depend on a variety of factors, such as the cost to capture carbon dioxide, the cost and capacity to transport and store CO2, federal and state regulatory decisions, and the development of other clean energy technologies that could reduce the demand for CCS.
The outlook varies for those different factors. As researchers work to increase the efficiency of CO2 capture, and as developers learn how best to implement the technology, the cost to capture carbon dioxide may decline. The investment necessary to build pipeline networks to transport CO2 has been estimated at several billion dollars for a regional network and several hundreds of billions of dollars for a national network. Although the United States appears to have abundant capacity to store captured CO2, the suitability of some potential storage sites, and the prospects for permanently sequestering large amounts of CO2, are still being explored. Federal and state regulations can lengthen the time required to implement a CCS project; in some cases, regulations can also boost the technology’s deployment. Advances in alternative clean energy technologies could lead to greater use of energy sources that do not produce CO2 emissions, decreasing the demand for carbon capture and storage.
CO2 Capture Cost
The cost of capturing carbon dioxide makes up the bulk of the cost of using CCS technology. Although federal subsidies for using CCS have increased significantly, a reduction in CO2 capture costs is likely to be an important factor in the future adoption of CCS. Capture costs could decline for two reasons: because of lessons learned in implementing the technology and because of research and development. As more CCS facilities begin operating, costs can fall because those projects’ experiences provide information about how to improve subsequent installations and use of CCS. The demonstration projects being funded by the Infrastructure Investment and Jobs Act may generate such learning effects.
Early deployments of CCS technology already appear to have produced large learning effects. For example, CO2 capture costs at Petra Nova, the only CCS facility running at a U.S. power plant, were estimated to be 35 percent lower than capture costs at Boundary Dam, a similar facility in Canada that was built just a few years earlier.1
The estimated cost reductions from expanding the use of CCS are often summarized by “learning curves,” which quantify the extent to which the cost of a technology declines over time as its use increases. One study suggests that a 10 percent learning curve—meaning that costs decline by 10 percent every time the total capacity doubles—is a “conservative” assumption for CCS going forward. That estimate is based on trends seen with other innovative clean energy technologies.2
Projections of learning curves for carbon capture and storage are likely to provide only a rough guide to actual cost reductions, for two reasons. First, the history of implementing new technologies suggests that costs may turn out to be higher or lower than expected. Second, there has been little or no commercial experience with using CCS in the settings with the highest CO2 capture costs, such as power generation and production of cement, iron, and steel (see Figure 1-2).
Predictions of the future state of technology are inherently uncertain, but there are indications that sizable declines in CO2 capture costs, and increases in the range of applications for CCS, may be possible. One study suggests that at power plants equipped with CCS, the levelized cost of electricity (the average cost of generating a unit of electricity over the life of a plant) could decline by anything from 10 percent to 30 percent over the next several decades because of innovations in CO2 capture processes.3 Other research finds little evidence to suggest that CO2 capture costs will fall.4
The range of applications in which CCS could profitably be used might also expand because the R&D currently being funded by the federal government focuses on improving CO2 capture from power plants fueled by natural gas as well as from industrial processes. That focus—which is a departure from an earlier emphasis on reducing CO2 emissions at coal-fired power plants—reflects the demise of coal and the rise of natural gas as the dominant energy source in the electric power sector.5
Transport and Storage Capacity
Other determinants of the future use of CCS include how widely pipeline networks will be built to transport captured CO2 and whether sufficient underground storage capacity can be developed to absorb the additional CO2 that is captured.6 Economic and technical factors will be key considerations in transport and storage projects. The attitudes of residents where such facilities are planned will also play a role. In some cases, local opposition has resulted in the cancellation of CCS projects.7 (The potential health effects of CCS on communities where facilities have been installed are discussed later in this chapter, along with regulatory issues that affect CO2 pipelines and storage sites.)
Transport
Pipeline construction can be very expensive, so cost is a key determinant of the amount of CO2 pipeline capacity that will eventually be put in place. Several studies have modeled how the cost to build a pipeline network varies with the length and dispersion of the network. (Because of economies of scale in pipeline transport, shipping CO2 over long distances through large-capacity “trunk” pipelines can be less expensive per ton transported than shipping CO2 over short distances through narrow “feeder” or “spur” pipelines from individual capture sites.)
Studies of the cost to build CO2 pipelines tend to share some common features in their modeling. First, they frequently focus on the Midwest and the South, where CCS is used the most now and where additional low-cost capture sites can readily be brought online. Second, they estimate the cost of building new pipeline networks rather than repurposing existing networks—such as pipelines that carry natural gas, which may fall into disuse as reliance on renewable energy sources increases. Although at least some of the 3 million miles of existing pipelines that carry natural gas could be reconfigured to transport CO2, their suitability for that purpose is still being explored.8 Third, the studies’ notional pipeline networks are designed to transport captured CO2 to the closest site with storage potential that is assumed to be large enough to accommodate the carbon dioxide.
One study estimated that constructing pipelines that could transport 19 million metric tons per year of captured CO2 from the upper Midwest to storage sites in the Permian Basin in western Texas would cost $4.3 billion.9 Building pipelines that could carry 28.7 million tons of captured CO2 per year to and from the same regions would cost $6.7 billion.
Another study also focused on CO2 capture by facilities mainly located in the Midwest and estimated construction costs for two potential transport networks of different sizes.10 The smaller network, which would consist of 7,000 miles of pipeline that could carry 83 million metric tons of CO2 annually, would cost $7.4 billion to build. The bigger network, which would consist of 30,000 miles of pipeline that could transport 281 million metric tons of CO2 per year, would cost approximately $31 billion to build.
That study also looked at the effects on the bigger network of incorporating large pipelines that would create excess capacity in the near term but would be fully utilized over time as additional CO2 capture sites came online. If such long-term coordination between pipeline builders and eventual shippers of captured CO2 proved to be feasible, the bigger network could transport almost 670 million metric tons of CO2 a year with an extra construction cost of about $4 billion for higher-capacity pipelines and a small addition in length.
A third study estimated the cost of building a nationwide network of CO2 pipelines by 2050.11 Depending on the exact configuration of the network, it would require 65,000 to 70,000 miles of pipeline and would transport almost 1 gigaton (1 billion metric tons) to 1.7 gigatons of captured CO2 per year. By comparison, the major U.S. emissions sources to which CCS can be applied produced 2.5 gigatons of CO2 emissions in 2019 (see Figure 1-3). The study estimated that the capital costs to build that pipeline network would total $170 billion to $220 billion in 2020 dollars (it is unclear whether those estimates include the labor costs of building the network).
Storage
Estimates of the available capacity for permanently storing carbon dioxide in the United States vary widely, but all of the estimates exceed any plausible amount of CO2 that would be captured by CCS in the future. The U.S. Geological Survey’s mean estimate of the underground storage potential for CO2 in the United States is 3,000 gigatons.12 The Department of Energy’s corresponding estimate is about 8,600 gigatons.13 Virtually all of that storage capacity is in the form of saline formations. By comparison, the United States emits a total of about 5 gigatons of CO2 per year, and the most ambitious of the CO2 transport networks described above would carry no more than 1.7 gigatons per year.
Although estimates suggest that the United States has abundant storage capacity for captured CO2, confirming the suitability of a potential storage site can be a time-consuming and costly process. Companies that receive funding from the Department of Energy’s CarbonSAFE program, which supports CO2 sequestration, spend several years satisfying various technical criteria to establish that the sites they have selected will allow carbon dioxide to be stored permanently.14 (The effects of federal regulations on the length of time needed to complete a CCS project are discussed in more detail below.)
Researchers continue to study whether large quantities of CO2 can be sequestered permanently underground and, if so, at what cost. To date, most captured CO2 has been stored in depleted oil wells through enhanced oil recovery. But saline formations are estimated to make up the vast majority of the United States’ CO2 storage capacity, so much more carbon dioxide would need to be captured and stored through geologic sequestration if CCS was to make a significant contribution to mitigating climate change.
Although initial findings on the safety of geologic sequestration have been positive, studies argue that more research is needed into potential problems, such as the possibility of leakage, the risk of inducing earthquakes, and methods for minimizing and (if necessary) managing buildups in pressure. Without such research, issues of potential liability for accidents at CO2 storage sites and the cost to insure against them will remain unresolved, and the prospects for large-scale CO2 sequestration will be limited.15
Regulation
Another factor affecting the future use of CCS is state and federal regulations, which can constrain or speed up the deployment of CCS technology. For example, before work on CO2 pipelines or storage sites can begin, it is necessary to establish where pipelines can be placed, who can claim ownership of an underground storage site, and who is liable for any damage resulting from pipeline or sequestration accidents. Unless federally owned property is involved, those activities are regulated by the states. (If a pipeline crosses federal land, the Bureau of Land Management has oversight; if it crosses water, the Army Corps of Engineers is responsible.)
One challenge that could arise from the increased deployment of CCS is the need to coordinate pipeline siting and construction among states that have different regulatory regimes. A similar challenge involves setting the terms of access to interstate pipelines. For instance, will common carriage rules apply—so that a party in any state who pays the prevailing tariff can transport captured CO2—or will the pipeline owner have discretion over who can access the pipeline and how much they must pay?16
Federal Safety and Environmental Regulation
The federal government is responsible for overseeing two other regulatory issues that have to be addressed before work on a CCS project can begin: the potential effects of CO2 transport and storage on public safety and on the environment. The Pipeline and Hazardous Materials Safety Administration (PHMSA) in the Department of Transportation regulates the safety of pipelines that carry CO2 as well as other gases and hazardous materials. (States that adopt pipeline safety regulations at least as stringent as the federal government’s can assume PHMSA’s responsibilities and be compensated for doing so.) PHMSA has started the rulemaking process to update its safety standards for CO2 pipelines; no date has been set for a final rule.17
In the environmental arena, the Environmental Protection Agency (EPA) regulates the injection of CO2 for enhanced oil recovery and for geologic sequestration—in what it calls Class II and Class VI wells, respectively—to ensure that stored CO2 does not contaminate underground sources of drinking water.18 In addition, CCS projects that receive federal funding or that are located on federal lands are subject to review under the National Environmental Policy Act (NEPA). That requirement applies to facilities that receive direct federal funding or (like pipelines) that are connected to such facilities.
Federal regulations can lengthen the time it takes to complete a CCS project. Obtaining approval for a Class VI well permit for geologic sequestration is a multiyear process. EPA has issued only two permits that have resulted in well construction (four other permits were issued for the Department of Energy’s FutureGen project, which was not completed).19 Currently, permit applications for 169 Class VI wells are pending at EPA, all for projects in the preconstruction phase.20 NEPA reviews can also take a number of years to complete.
The White House’s Council on Environmental Quality, which is responsible for implementing NEPA, has highlighted the need to take into account potential adverse environmental effects of using CCS.21 In order to work properly, some carbon capture processes require that other pollutants (such as sulfur dioxide, particulate matter, and some forms of nitrogen oxide) be removed from the exhaust gas of power plants before the solvent that captures the CO2 is introduced. Although removing those pollutants would be advantageous to communities where CCS facilities are located, research has found that the presence of other noxious gases, such as ammonia, can increase as a result of the carbon capture process.
Regulatory Changes That Could Affect the Deployment of CCS
The federal government has taken several steps in recent years to speed up its regulation of CCS:
- The Infrastructure Investment and Jobs Act provided additional funding to EPA for permitting of Class VI wells and to states that want to assume that responsibility in order to expedite permitting. (North Dakota and Wyoming have received such authority, EPA has proposed that Louisiana obtain it, and other states are seeking that authority.)
- The Utilizing Significant Emissions with Innovative Technologies (USE IT) Act made CCS infrastructure eligible for the federal permitting-review process created under the Fixing America’s Surface Transportation (FAST) Act.22 That process, called FAST-41, includes new coordination and oversight procedures to reduce the time needed for the federal government to conduct environmental reviews of proposed infrastructure projects.
- The Fiscal Responsibility Act of 2023 (P.L. 118-5) contains provisions that might expedite, or in some cases eliminate, environmental reviews by the federal government. (The final form of those regulations will be determined by the Council on Environmental Quality.)
Other federal and state regulatory actions could boost the deployment of both CCS and other clean energy technologies. For example, 31 states and the District of Columbia currently have standards mandating the use of some clean or renewable sources of energy in electricity generation.23 If more states or the federal government adopted such standards or tightened their existing standards, power companies would be compelled to make greater efforts to reduce their CO2 emissions.24 Alternatively, the federal government might choose to advance the decarbonization of the economy by taxing CO2 emissions, making such emissions costly for power companies and, by extension, their customers. Any of those measures would give businesses a greater incentive to reduce their CO2 emissions through the use of carbon capture and storage or another clean energy technology. Some analysts argue that such an incentive would be necessary to bring about widespread deployment of CCS.25
New rules proposed by EPA to limit CO2 emissions from electric power plants could also boost the use of carbon capture and storage.26 EPA has justified the rules in part by pointing to several currently available technologies, including CCS, that it believes have met the necessary criteria for EPA to impose limits on CO2 emissions.27 Those criteria include having been “adequately demonstrated” to be the “best system of emission reduction.” In addition, the “costs of [the emission] controls must be reasonable.” EPA is expected to finalize the rules by April 2024. If EPA’s proposed rules remain largely intact after the rulemaking process and withstand likely legal scrutiny, the use of carbon capture and storage could increase substantially. (Alternatively, some older power plants that would otherwise be candidates for CCS, especially plants fired by coal, might be shut down instead or might avoid adding emission-control technologies by being slated for early retirement, as the proposed rules allow.)
Advances in Other Clean Energy Technologies
The availability of clean energy technologies that could either substitute for or complement CCS is also expected to have an impact on the future use of carbon capture and storage. Improvements in sources of energy that do not emit carbon dioxide—such as wind, solar, geothermal, or nuclear power or green hydrogen (hydrogen produced using renewable sources of energy)—could reduce the demand for CCS. All of those clean energy technologies receive substantial federal support. In particular, the clean energy incentives in the reconciliation act of 2022, and the attendant increases in renewable generation, are expected to help reduce CO2 emissions in the electric power sector by more than 50 percent in the next decade.28
R&D efforts by the federal government and the private sector may have an impact on CCS use in industries other than electricity generation. For example, production of cement, iron, and steel are considered especially good candidates for carbon capture and storage because lowering the CO2 emissions of those industries requires reducing emissions from the sources of power as well as from the materials used in production.29 The federal government is currently funding R&D on alternatives to fossil fuels as power sources for industrial processes. Research is also underway to find substitutes for some inputs that emit CO2 during production processes, such as the limestone used to make cement.30
Some government-funded clean energy R&D could act as a spur to the deployment of CCS. An example is research into technologies for using captured CO2 in the manufacture of long-lived products, such as building materials. (CO2 can be used as a curing agent to harden concrete, for instance.) Such carbon utilization programs received a total of $102 million in annual appropriations from 2021 to 2023 and an additional $310 million in funding for the 2022–2026 period from the Infrastructure Investment and Jobs Act. Although geologic sequestration would be necessary to store large volumes of captured CO2, carbon utilization could provide another way of storing CO2 that, like enhanced oil recovery, would generate an economic return that could offset some of the cost of CCS. Apart from EOR, CO2 utilization is still at an early stage of development.31
Although developments in clean energy technologies could have a direct impact on the future use of CCS, federal funding for CCS could also indirectly affect the course of those technologies. Federal dollars that are spent on CCS could instead have been used to subsidize further development of clean energy sources and supporting technologies, such as types of energy storage that could reduce or eliminate the concerns about intermittency that are associated with renewable electric power. If such alternative clean energy technologies proved to be superior to CCS as ways of reducing CO2 emissions, and if spending on CCS slowed down progress on those technologies, spending on CCS could turn out to be a misallocation of federal R&D funding. Conversely, given the uncertainty inherent in technological change, funding R&D programs to develop both CCS and other clean energy technologies may be an appropriate diversification of public investment in ways to mitigate climate change.
1. International Energy Agency, Energy Technology Perspectives 2020—Special Report on Carbon Capture, Utilization, and Storage: CCUS in Clean Energy Transitions (September 2020), p. 118, https://tinyurl.com/2wb55rzm.
2. Energy Futures Initiative, Turning CCS Projects in Heavy Industry and Power Into Blue Chip Financial Investments (February 2023), pp. 28–29, https://tinyurl.com/4rwvz37x. Learning curves for CCS are also discussed in Congressional Budget Office, Federal Efforts to Reduce the Cost of Capturing and Storing Carbon Dioxide (June 2012), www.cbo.gov/publication/43357; and Peter Folger, Carbon Capture: A Technology Assessment, Report R41325, version 25 (Congressional Research Service, November 5, 2013), https://tinyurl.com/2nzytnt2.
3. IEAGHG, Further Assessment of Emerging CO2 Capture Technologies for the Power Sector and Their Potential to Reduce Costs, Technical Report 2019-09 (September 2019), https://tinyurl.com/34ne9anc; and National Petroleum Council, “Emerging CO2 Capture Technologies,” Appendix F in Meeting the Dual Challenge: A Roadmap to At-Scale Deployment of Carbon Capture, Use, and Storage (December 2019, updated March 12, 2021), https://tinyurl.com/2s46ry2e.
4. Rupert Way and others, “Empirically Grounded Technology Forecasts and the Energy Transition,” Joule, vol. 6, no. 9 (September 21, 2022), pp. 2057–2082, https://tinyurl.com/mfsc9j2t.
5. Department of Energy, Carbon Capture Opportunities for Natural Gas Fired Power Systems (2017), https://tinyurl.com/bdhn53nc (PDF).
6. Daniel C. Steinberg and others, Evaluating Impacts of the Inflation Reduction Act and Bipartisan Infrastructure Law on the U.S. Power System (Department of Energy, National Renewable Energy Laboratory, March 2023), pp. vi and 10, www.nrel.gov/docs/fy23osti/85242.pdf.
7. Government Accountability Office, Decarbonization: Status, Challenges, and Policy Options for Carbon Capture, Utilization, and Storage, GAO-22-105274 (September 29, 2022), pp. 60–61, www.gao.gov/products/gao-22-105274.
8. Energy Information Administration, “Natural Gas Explained—Natural Gas Pipelines” (November 18, 2022), https://tinyurl.com/4k63prrm; and Council on Environmental Quality, Report to Congress on Carbon Capture, Utilization, and Sequestration (June 30, 2021), pp. 27–28, https://tinyurl.com/mprkuyr6 (PDF).
9. Ryan W. J. Edwards and Michael A. Celia, “Infrastructure to Enable Deployment of Carbon Capture, Utilization, and Storage in the United States,” Proceedings of the National Academies of Sciences, vol. 115, no. 38 (September 4, 2018), https://doi.org/10.1073/pnas.1806504115.
10. Elizabeth Abramson, Dane McFarlane, and Jeff Brown, Transport Infrastructure for Carbon Capture and Storage: Whitepaper on Regional Infrastructure for Midcentury Decarbonization (Great Plains Institute, June 2020), https://tinyurl.com/vf2smhnj (PDF).
11. Eric Larson and others, Net-Zero America: Potential Pathways, Infrastructure, and Impacts (Princeton University, October 29, 2021), https://tinyurl.com/y25d8t7v.
12. U.S. Geological Survey, “How Much Carbon Dioxide Can the United States Store via Geologic Sequestration?” (accessed December 3, 2023), https://tinyurl.com/rmcu3jhj.
13. Department of Energy, “Estimates of CO2 Stationary Source Emissions and Estimates of CO2 Storage Resources for Geologic Storage Sites” (November 2014), https://tinyurl.com/ys47ebfm.
14. Department of Energy, “Carbon Storage Assurance Facility Enterprise (CarbonSAFE)” (September 2022), https://tinyurl.com/5bknefvk.
15. IEAGHG, Current State of Knowledge Regarding the Risk of Induced Seismicity at CO2 Storage Projects, Technical Report 2022-02 (January 2022), https://tinyurl.com/ynssvmaz; and Steven T. Anderson, “Risk, Liability, and Economic Issues With Long-Term CO2 Storage—A Review,” Natural Resources Research, vol. 26, no. 1 (January 2017), pp. 89–112, https://tinyurl.com/e9xa2prh.
16. This discussion of regulatory issues draws heavily on Council on Environmental Quality, Report to Congress on Carbon Capture, Utilization, and Sequestration (June 30, 2021), https://tinyurl.com/mprkuyr6 (PDF); and Energy Futures Initiative, Turning CCS Projects in Heavy Industry and Power Into Blue Chip Financial Investments (February 2023), https://tinyurl.com/4rwvz37x.
17. Paul W. Parfomak, Carbon Dioxide (CO2) Pipeline Development: Federal Initiatives, Insight 12169 (Congressional Research Service, June 2, 2023), https://tinyurl.com/37k3d3tv (PDF).
18. EPA approves the construction, operation, permitting, and closure of wells that are used to place fluids underground for storage or disposal. It regulates six classes of injection wells, which differ by depth and by the type of liquid being injected. For more details, see Environmental Protection Agency, “Protecting Underground Sources of Drinking Water From Underground Injection (UIC)” (September 29, 2023), https://tinyurl.com/452yf96u.
19. Bob Van Voorhees, Sallie Greenberg, and Steve Whittaker, Observations on Class VI Permitting: Lessons Learned and Guidance Available, Special Report 9 (Illinois State Geological Survey, 2021), p. 3, https://tinyurl.com/ykfsfktw.
20. Multiple Class VI well applications can result from the same project, which is location- and company-specific. The 169 pending applications represent 58 different projects. See Environmental Protection Agency, “Current Class VI Projects Under Review at EPA” (November 9, 2023), https://tinyurl.com/5fe35tdc.
21. Council on Environmental Quality, Report to Congress on Carbon Capture, Utilization, and Sequestration (June 30, 2021), pp. 40–41, https://tinyurl.com/mprkuyr6 (PDF); and Carbon Capture, Utilization, and Sequestration Guidance, 87 Fed. Reg. 8808 (February 16, 2022), https://tinyurl.com/2nnwhxzk.
22. See the Utilizing Significant Emissions with Innovative Technologies Act, section 102 of division S of the Consolidated Appropriations Act, 2021 (P.L. 116-260); and division D, title XLI of the Fixing America’s Surface Transportation Act (P.L. 114-94).
23. Energy Information Administration, “Five States Updated or Adopted New Clean Energy Standards in 2021” (February 1, 2022), https://tinyurl.com/2p9ydpfb. A clean energy standard specifies the share of electricity for retail customers that must be generated by sources with low or no CO2 emissions. A renewable energy standard (or renewable portfolio standard) requires that a given share of all electricity be generated from renewable sources.
24. The federal government already requires that within the next few decades (by midcentury at the latest), the energy and materials used in government operations and procurement projects be produced with sources of clean energy. See the White House, “President Biden Signs Executive Order Catalyzing America’s Clean Energy Economy Through Federal Sustainability” (fact sheet, December 8, 2021), https://tinyurl.com/5bdwe427.
25. Department of Energy, Pathways to Commercial Liftoff: Carbon Management (April 2023), pp. 24–26, https://liftoff.energy.gov/carbon-management; and Energy Futures Initiative, Turning CCS Projects in Heavy Industry and Power Into Blue Chip Financial Investments (February 2023), pp. ES-7, 35–36, and 45–49, https://tinyurl.com/4rwvz37x.
26. New Source Performance Standards for Greenhouse Gas Emissions From New, Modified, and Reconstructed Fossil Fuel–Fired Electric Generating Units; Emission Guidelines for Greenhouse Gas Emissions From Existing Fossil Fuel–Fired Electric Generating Units; and Repeal of the Affordable Clean Energy Rule, 88 Fed. Reg. 33240 (May 23, 2023), https://tinyurl.com/3hkzrw6v.
27. EPA’s action was spurred by the Supreme Court’s decision in West Virginia v. EPA, which restricted the federal government’s regulation of emissions to plant-level measures that are “source-specific”—in other words, that are applied with respect to individual plants’ emissions rather than shifting energy production from groups of high- to low-emitting plants, as EPA initially proposed. See West Virginia et al. v. Environmental Protection Agency et al., 597 U.S. ___ (2022).
28. Energy Information Administration, Annual Energy Outlook 2023, “Table 18: Energy-Related Carbon Dioxide Emissions by Sector and Source” (accessed March 23, 2023), www.eia.gov/outlooks/aeo/tables_ref.php. As a possible parallel, the prospects for greater use of natural gas contributed to the cancellation of some of the large CCS demonstration projects at coal-fired plants that were funded by the American Recovery and Reinvestment Act of 2009 (see Box 2-1).
29. Sergey Paltsev and others, “Hard-to-Abate Sectors: The Role of Industrial Carbon Capture and Storage (CCS) in Emission Mitigation,” Applied Energy, vol. 300 (October 15, 2021), https://tinyurl.com/y3ns7u4e.
30. See, for example, Department of Energy, Office of Energy Efficiency and Renewable Energy, “Industrial Heat Shot” (accessed September 7, 2023), https://tinyurl.com/38t3e8vz; and Paul Fennell and others, “Cement and Steel—Nine Steps to Net Zero,” Nature, vol. 603 (March 23, 2022), pp. 574–577, https://tinyurl.com/mjr9uawt.
31. National Academies of Sciences, Engineering, and Medicine, Carbon Dioxide Utilization Markets and Infrastructure: Status and Opportunities—A First Report (National Academies Press, 2023), https://tinyurl.com/47vb6shm.
About This Document
This report was prepared to enhance the transparency of the work of the Congressional Budget Office. In keeping with CBO’s mandate to provide objective, impartial analysis, the report makes no recommendations.
Nathan Musick prepared the report with guidance from Joseph Kile. Ann E. Futrell, Aaron Krupkin, Kevin Laden, Joseph Rosenberg, Robert Shackleton (formerly of CBO), and Molly Sherlock offered comments. Caroline Nielsen fact-checked the report.
Chris Consoli and Joey Minervini of the Global CCS Institute, Donald J. DePaolo of the Lawrence Berkeley National Laboratory, and Howard J. Herzog of the Massachusetts Institute of Technology commented on an earlier draft. The assistance of external reviewers implies no responsibility for the final product; that responsibility rests solely with CBO.
Jeffrey Kling and Robert Sunshine reviewed the report. Christian Howlett edited it, and R. L. Rebach created the graphics, illustrated the cover, and prepared the text for publication. The report is available at www.cbo.gov/publication/59345.
CBO seeks feedback to make its work as useful as possible. Please send comments to communications@cbo.gov.

Phillip L. Swagel
Director
December 2023