
At a Glance
The Congressional Budget Office regularly analyzes household income in the United States. This report presents the distributions of household income, means-tested transfers, and federal taxes in 2020 and explores how they differ from the distributions in 2019.
Largely because of the economic disruption caused by the coronavirus pandemic, 2020 was an unusual year. To mitigate that disruption, the federal government implemented an unprecedentedly large amount of fiscal stimulus. The policies enacted in response to the pandemic affected household income throughout the distribution—unlike the usual means-tested transfers, which are typically targeted at households toward the bottom of the income distribution.
Those policies altered household income through their effects on wages, employment, transfers, and taxes. Some policies (such as recovery rebate credits) provided direct benefits to households, whereas other policies (such as the Paycheck Protection Program) provided financial support to other entities, such as businesses, nonprofit organizations, and state and local governments. This report focuses on the effects of policies that provided direct benefits.
The main findings from CBO’s analysis of the distribution of household income in 2020 are these:
- Income before transfers and taxes was more skewed toward the top of the income distribution in 2020 than in 2019. Income from labor decreased among low-income households, and income from capital gains increased among high-income households. In 2020, the average income among households in the highest quintile (or fifth of the distribution) was roughly 16 times the average income of households in the lowest quintile.
- Means-tested transfers were larger in 2020 and federal taxes were lower. Those changes stemmed in large part from policies that provided direct payments to households in all income groups—in particular, recovery rebate credits and expanded unemployment compensation. The benefits from those two policies were broadly dispersed among households across the income distribution: More than half of the benefits attributable to those policies accrued to households in the three highest income quintiles in 2020, whereas about one-quarter of means-tested transfers accrued to households in those quintiles in 2019.
- Income after transfers and taxes was more evenly distributed than income before transfers and taxes. Larger means-tested transfers and lower federal taxes boosted income for low-income households by a greater percentage than they increased it for other households.
- Transfers and taxes reduced income inequality by more in 2020 than in any other year in CBO’s analysis. Although inequality before transfers and taxes was higher in 2020 than in any year since at least 1979, inequality after transfers and taxes was lower than in any year since 2009.
Notes
Numbers may not add up to totals because of rounding.
Unless this report indicates otherwise, all years referred to are calendar years.
All dollar amounts are expressed in 2020 dollars and are rounded to the nearest hundred. To convert dollar amounts to 2020 dollars, the Congressional Budget Office used the price index for personal consumption expenditures from the Bureau of Economic Analysis.
One figure in this report uses shaded vertical bars to indicate the duration of recessions. A recession extends from the peak of a business cycle to its trough.
Unless this report indicates otherwise, “income” refers to household income including social insurance benefits but before means-tested transfers and federal taxes are accounted for, “transfers” refers to means-tested transfers, and “taxes” refers to federal taxes. (For additional definitions, see Appendix D.) Specific colors have been used in the graphics to represent certain income concepts: Green denotes income before transfers and taxes, blue denotes means-tested transfers, orange denotes federal taxes, and purple denotes income after transfers and taxes.
Supplemental data, additional data for researchers, and an interactive tool that allows users to create customized tables are posted along with this report at www.cbo.gov/publication/59509. The supplemental data and the additional data for researchers present detailed information about income, means-tested transfers, federal taxes, and household types.
A companion slide deck examines trends in the distribution of household income from 1979 through 2020. It is available at www.cbo.gov/publication/59510.
For more than 30 years, the Congressional Budget Office has reported on the distribution of household income and federal taxes. This report focuses on the distribution of household income in 2020, the most recent year for which relevant data from tax returns are available. It also examines how the distribution of household income in 2020 differed from that in 2019, before the onset of the coronavirus pandemic in the United States.
The roughly 129 million households in the United States in 2020 received a total of about $16 trillion in annual income, CBO estimates.1 That income was distributed unevenly among the quintiles (or fifths) of the income distribution: The average income of households in the highest quintile was about $357,800, CBO estimates, roughly 16 times the average income of households in the lowest quintile, which was $21,900.
Many households experience changes in their income, transfers, taxes, or household composition from year to year. As a result, the households in any given group of the income distribution in 2020 are not the same households that were in that group in 2019. Therefore, this analysis focuses on the changes in the overall distribution of household income rather than the experiences of particular households.
Overview of Changes in Income
The pandemic had a significant effect on the U.S. economy in 2020. The unemployment rate rose from 3.5 percent in February 2020 to a peak of 14.7 percent in April 2020, the highest level since the Great Depression. By the end of 2020, the unemployment rate had declined to 6.7 percent, but both employment and labor force participation remained significantly lower than before the pandemic.
As a result, labor income per household decreased for households in the four lower quintiles, on average, and those decreases were larger (in percentage terms) for lower-income households. The Paycheck Protection Program (PPP) and other federal policies mitigated some of those decreases by helping businesses retain their employees. In contrast to labor income, income from realized capital gains grew by about 29 percent in 2020, to $1.1 trillion. Most of that income accrued to households in the highest quintile. In combination, those changes to labor income and income from capital gains increased income inequality.
In terms of its contribution to income inequality over the long run, 2020 was an unusual year. According to CBO’s estimates, income inequality before transfers and taxes was higher in 2020 than in any year since 1979, and inequality after transfers and taxes was lower in 2020 than in any year since 2009—in large part because of new temporary policies enacted in response to the pandemic. Although the benefits of those policies were broadly dispersed across the income distribution, they constituted a larger share of income for low-income households. CBO has produced a complementary analysis (available at www.cbo.gov/publication/59510) that examines trends in the distribution of household income, means-tested transfers, and federal taxes from 1979 to 2020.
Overview of the Effects of Transfers and Taxes on Household Income
Federal fiscal policies greatly affect the economic resources available to U.S. households. In 2020, average income among all households before means-tested transfers and federal taxes were taken into account was $123,400, CBO estimates. The net effect of those transfers and taxes was to decrease household income by $10,700, on average, bringing average household income to $112,700. Means-tested transfers provided households with an additional $9,600 in income, on average, in that year. Federal taxes reduced household income by $20,300 per household, on average.2
Those averages obscure a large amount of variation in household income and in how transfers and taxes affect income. Typically, transfers and taxes reduce income inequality because low-income households receive a larger share of their income as means-tested transfers than high-income households do and because high-income households pay a larger share of their income in federal taxes than low-income households do.
In 2020, new policies were enacted that provided households with financial support and had significant effects on the distribution of household income.3 The two largest policies—recovery rebate credits and expanded unemployment compensation—together increased income by more than $800 billion, or more than $6,000 per household, on average (see Appendix B for more details about those policies). In this report, recovery rebate credits are considered refundable tax credits, and expanded unemployment compensation is considered a means-tested transfer.
Both programs provided benefits to households across the income distribution. A little more than half of those benefits went to households in the three highest quintiles in 2020. By contrast, 23 percent of means-tested transfers went to households in those quintiles in 2019.
Legislation also expanded existing means-tested transfer programs—such as Medicaid and the Supplemental Nutrition Assistance Program (SNAP)—and reduced the taxes households owed by expanding or introducing tax credits, exclusions, and deductions.
In addition, the federal government implemented policies that provided support to other entities. The Paycheck Protection Program, for example, supported businesses and nonprofit organizations, and the Coronavirus Relief Fund supported state and local governments. The effects of those policies are included in this analysis to the extent that they indirectly affected household income (by altering wages and employment, for example). Other effects of such policies—for example, PPP benefits that ultimately boosted businesses’ profits—are not included in this analysis. Also excluded are policies that did not increase household income but that nevertheless increased the resources available to households, such as the suspension of student loan payments.
Even without policy changes, transfers and taxes would have lessened some of the increase in inequality because of the effect of budget mechanisms known as automatic stabilizers, which take effect when economic conditions deteriorate. As income and employment decreased in 2020 in response to the pandemic, more people became eligible for means-tested transfers and unemployment insurance because their income fell below certain thresholds. Also, more people were pushed into lower tax brackets, which reduced their individual income tax rate.
Transfers and Taxes Produced a More Even Distribution of Income
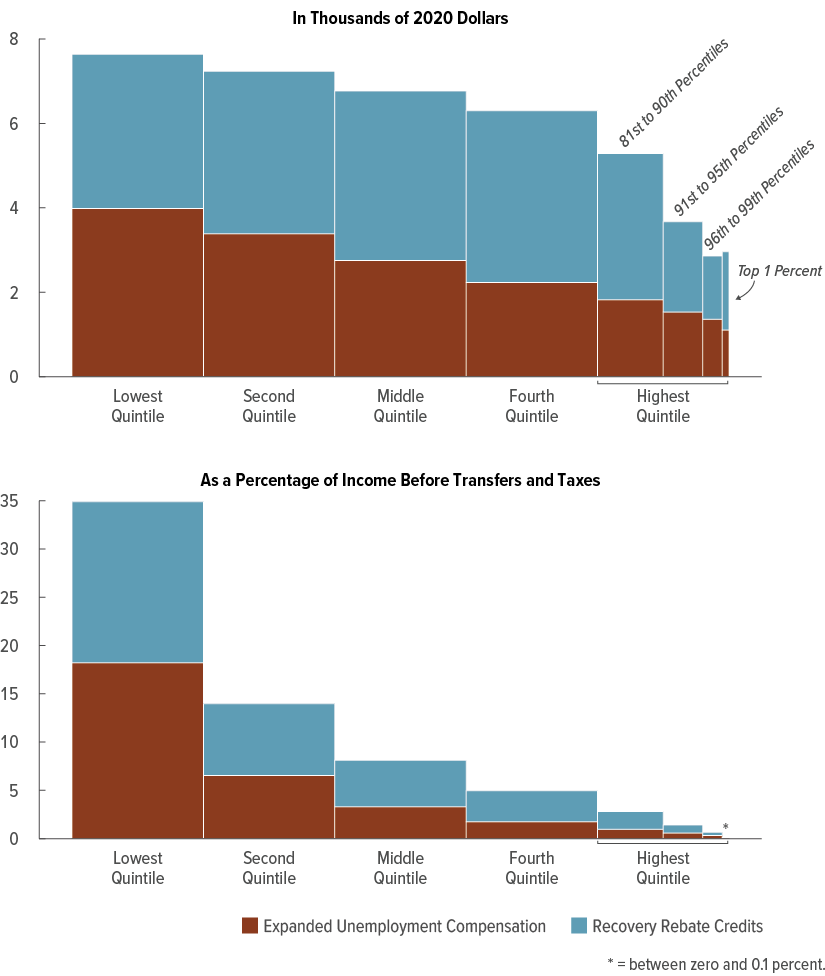
In 2020, means-tested transfers and federal taxes increased income among households in the lowest quintile by $23,900 (or 110 percent), on average, to $45,800. Among households in the highest quintile, income decreased by $82,100 (or 23 percent), on average, to $275,700, as a result of transfers and taxes.
In 2019, the effects of transfers and taxes were smaller among low-income households but similar among high-income households. In that year, transfers and taxes increased average income among households in the lowest quintile by $15,700 (or 65 percent) to $39,900 (in 2020 dollars) and decreased income among households in the highest quintile by $81,000 (or 24 percent), on average, to $256,500.
Average Real Income, Means-Tested Transfers, and Federal Taxes in 2020
Thousands of 2020 Dollars
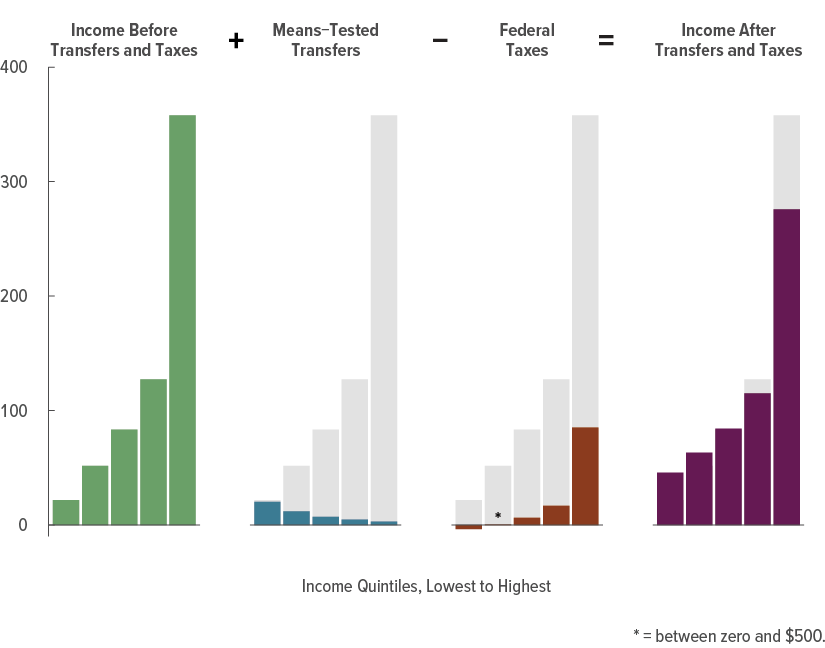
Household income in 2020 was more evenly distributed—that is, the height of the lowest bar was closer to the height of the highest bar—when the effects of means-tested transfers and federal taxes are accounted for.
Income Before Transfers and Taxes Grew Only for Higher Income Groups, but Income After Transfers and Taxes Grew Across the Distribution
In 2020, income before transfers and taxes decreased for households at the bottom of the distribution and increased for households at the top of the distribution. Among households in the lowest quintile, income declined by 10 percent, on average; among households in the top 1 percent, income increased by 14 percent. Income was nearly unchanged among households in the middle quintile.
By boosting income, means-tested transfers and federal taxes significantly altered the distribution of household income from 2019 to 2020. The gains in income were spread throughout the distribution but were largest as a percentage of income for low-income households. Income after transfers and taxes increased by nearly 15 percent, on average, among households in the lowest quintile, by 11 percent among households in the middle quintile, and by 14 percent among households in the top 1 percent. The overall increase for the top quintile was smaller than those for the other income groups.
Changes in Average Household Income, 2019 to 2020
Percent
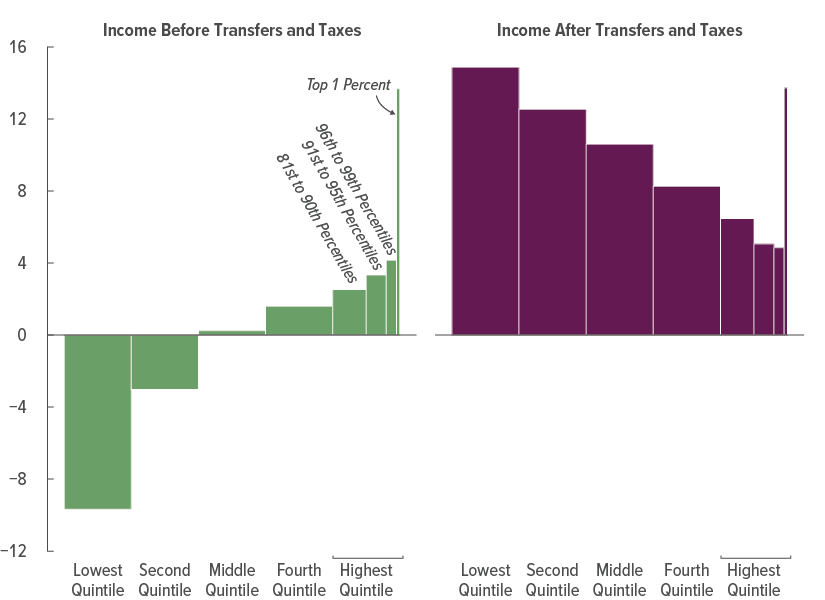
In 2020, income before transfers and taxes decreased for low-income households and increased for high-income households, on average. By contrast, income after transfers and taxes increased for all income groups, and the largest percentage increases accrued to households in the lowest quintile.
Income Before Transfers and Taxes
CBO’s measure of income before transfers and taxes consists of market income plus social insurance benefits. Market income comprises wages and other forms of labor income (including cash wages, employers’ contributions for health insurance premiums, and payroll taxes paid by employers), business income, capital gains, and other income sources. Social insurance benefits include Social Security and Medicare benefits, regular unemployment insurance (but not expanded unemployment compensation, which is considered a means-tested transfer), and workers’ compensation. Notably, income before transfers and taxes excludes the effects of government policies carried out through means-tested transfer programs or the federal tax system.
The composition of income before transfers and taxes varies across the distribution. For most households, labor income makes up the bulk of their income. But among households at the top of the distribution, capital gains constitute a greater portion of income before transfers and taxes than they do for other households. Additionally, as income rises, social insurance benefits tend to decline as a share of income.
Overall Income Growth Was Largely Attributable to Increases in Capital Gains and Social Insurance Benefits
The income of the average household grew by 1.6 percent in 2020 (after adjustments for inflation), from $121,500 to $123,400. Capital gains increased by $1,900, on average, and social insurance benefits increased by $1,700. Labor income, by contrast, decreased by $700, largely as a result of pandemic-related job losses. Average business income declined by $100, and all other income decreased by $900, on average.
Changes in Average Household Income Before Transfers and Taxes From 2019 to 2020
2020 Dollars
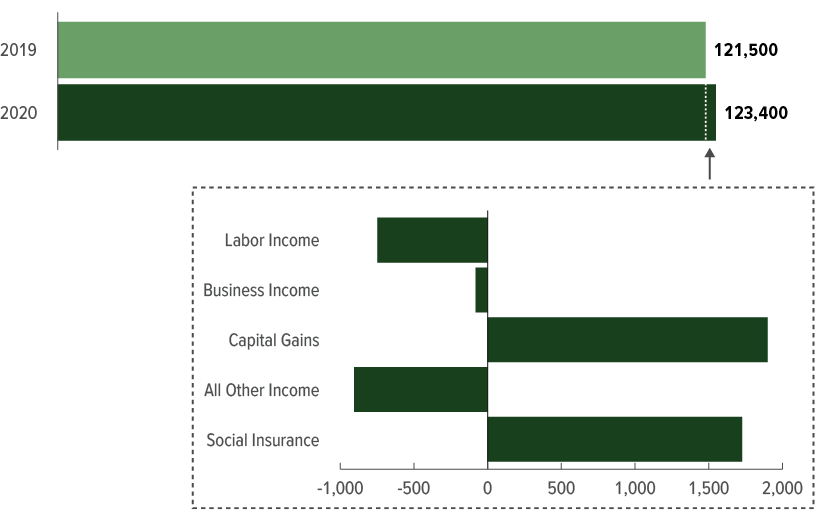
Average household income grew by $1,900 in 2020. Increases in capital gains and social insurance benefits were partially offset by decreases in labor income, business income, and all other income (including interest, dividends, and pension income).
Income Increased at the Top of the Distribution and Decreased at the Bottom
The distribution of household income was uneven across the five quintiles in 2019—and became more uneven in 2020 because the quintiles’ income grew at different rates. For example, the average income before transfers and taxes of households in the lowest quintile decreased from $24,200 to $21,900, whereas that of households in the highest quintile increased from $337,400 to $357,800.
Average Household Income Before Transfers and Taxes in 2019 and 2020, by Income Group
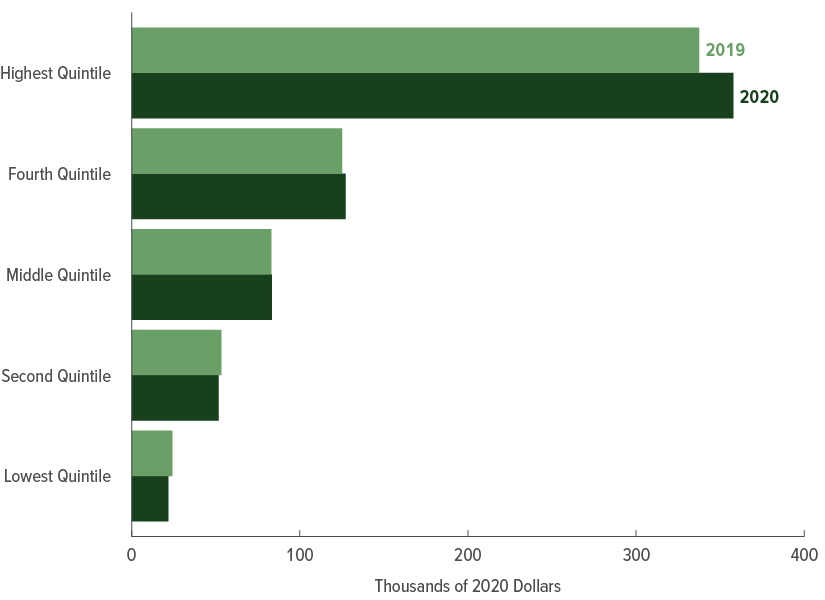
Income decreased among households in lower quintiles in 2020, whereas it increased among households in higher quintiles.
Income Grew Unequally Because of Differing Changes in Its Components
For households in the highest quintile, income increased more in 2020 than it grew per year, on average, between 1979 and 2020. Those increases in 2020 were largely attributable to larger capital gains and higher business and labor income. By contrast, income among households in the lowest quintile decreased from 2019 to 2020, driven primarily by a decline in labor income arising from pandemic-related job losses.
Changes in Components of Average Household Income Before Transfers and Taxes Between 2019 and 2020, by Income Group
Percent
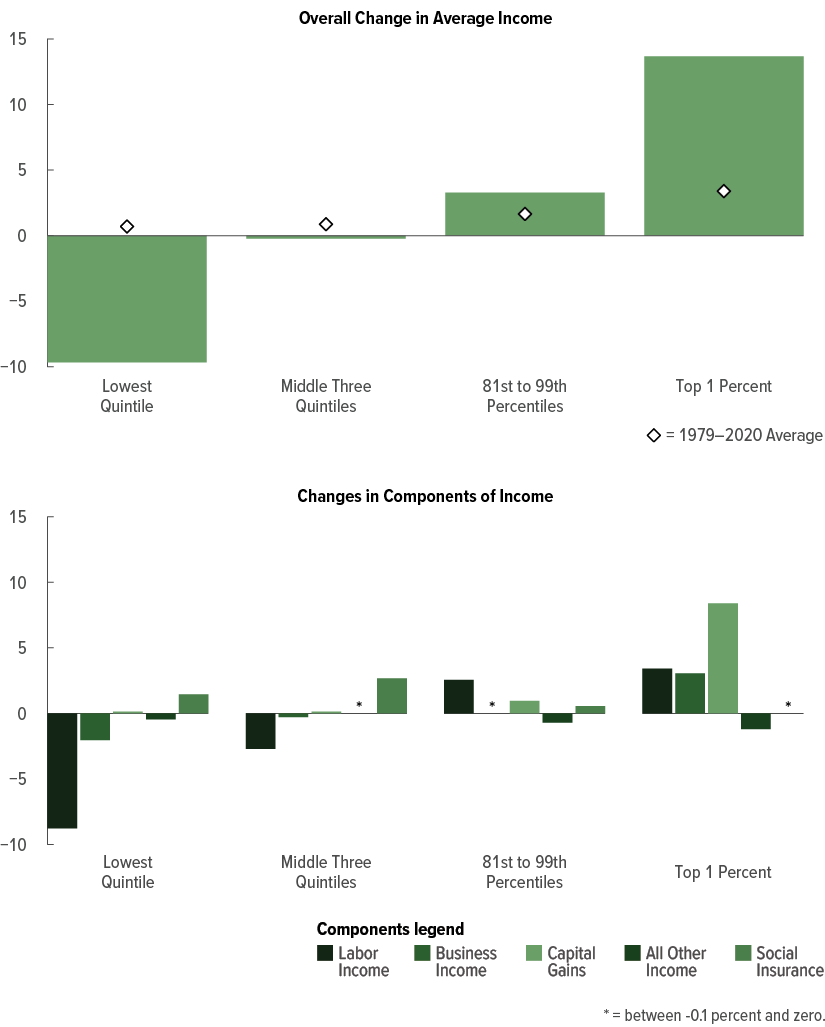
Capital gains and labor income increased among households in the top 1 percent, which led to a higher overall rate of income growth (14 percent) than the average rate between 1979 and 2020 (3 percent).
Labor income decreased among households in lower income groups, which suppressed their overall income growth.
Means-Tested Transfers and Federal Taxes
Means-tested transfers are cash payments and in-kind benefits from federal, state, and local governments that are typically designed to assist individuals and families who have low income and few assets.4 Those transfers go largely to households near the bottom of the income distribution.5
In 2020, means-tested transfers were particularly large, mainly because of three key factors. First, in this analysis, that category includes the temporary expansion of unemployment compensation (whereas regular unemployment insurance is still included in income before transfers and taxes). Second, legislative changes temporarily expanded SNAP and Medicaid.6 Third, reductions in income, especially for households at the bottom of the distribution, increased the number of people eligible for means-tested transfers.
In this analysis, federal taxes consist of individual income taxes, payroll taxes, corporate income taxes, and excise taxes.7 Taken together, those taxes accounted for over 90 percent of all federal revenues collected in 2020. Among the sources of revenues, individual income taxes and payroll taxes are the largest, followed by corporate taxes and excise taxes.8
High-income households generally pay a larger share of federal taxes. In 2020, for example, households in the highest income quintile received about 56 percent of all income and paid 81 percent of federal taxes. (In 2019, households in that quintile received 55 percent of all income and paid 69 percent of federal taxes.) For households across the income distribution, federal taxes were lower in 2020 in large part because recovery rebate credits—which are counted as refundable tax credits in this analysis—reduced the taxes households owed.
Federal Legislation Lessened the Pandemic’s Economic Disruption
The federal government enacted several major laws in 2020 to lessen the pandemic-related economic disruption for households, businesses, and state and local governments.
Among the policies put in place by that legislation were two temporary programs that provided direct payments to households in 2020. The first, recovery rebate credits, provided payments of up to $1,800 per person to those with income below specified limits. The second, expanded unemployment compensation, combined several policies that temporarily expanded the amount of, duration of, and eligibility for unemployment benefits. Eligible unemployed people (including previously self-employed people) received weekly payments of up to $600 through July in addition to their regular unemployment insurance benefits. (For more details about those policies and how CBO estimated their effects, see Appendix B.) CBO estimates that about half of the total benefits from those two programs accrued to households in the three highest quintiles.
Pandemic-related legislation also expanded the two largest means-tested transfer programs—Medicaid and SNAP—in 2020. The federal government required states to maintain coverage for all Medicaid enrollees regardless of any changes in their income or circumstances that would otherwise have caused them to become ineligible for the program. The government also allowed states to provide households with the maximum SNAP benefits for their household size and to provide benefits to replace meals that children would otherwise have received at school. CBO estimates that benefits were larger for those two programs in 2020 than in 2019—by 10 percent for Medicaid and the Children’s Health Insurance Program, or CHIP, and by over 50 percent for SNAP—in part because of those changes. As those programs expanded, slightly larger shares of their benefits (compared with shares in 2019) accrued to households that were higher in the income distribution.
Some temporary changes were made to the tax system as a result of the legislation. For example, unemployment compensation was made partially exempt from individual income taxes for people with income below $150,000 (regardless of filing status), and limits on a tax filer’s total deductions for charitable contributions were relaxed.
Some policies put in place by pandemic-related legislation in 2020 provided financial support to businesses and state and local governments. Although those policies did not directly benefit households, they altered household income through their effects on the economy. The largest such policy was the Paycheck Protection Program, which provided over $500 billion in funds to businesses in 2020.9
Other policies did not directly increase household income but did increase the resources available to households. For example, the government suspended federal student loan payments through legislative and executive action in 2020, which was equivalent to a transfer to households. Although CBO has not explicitly analyzed the distributional effects of that policy, more than half of student loan debt is typically held by households in the two highest quintiles of the income distribution.10 In CBO’s assessment, even if the agency had included the benefits attributable to that policy as a transfer, those benefits would have had little effect on the overall distribution of household income.
New Federal Policies Increased Household Income Across the Distribution
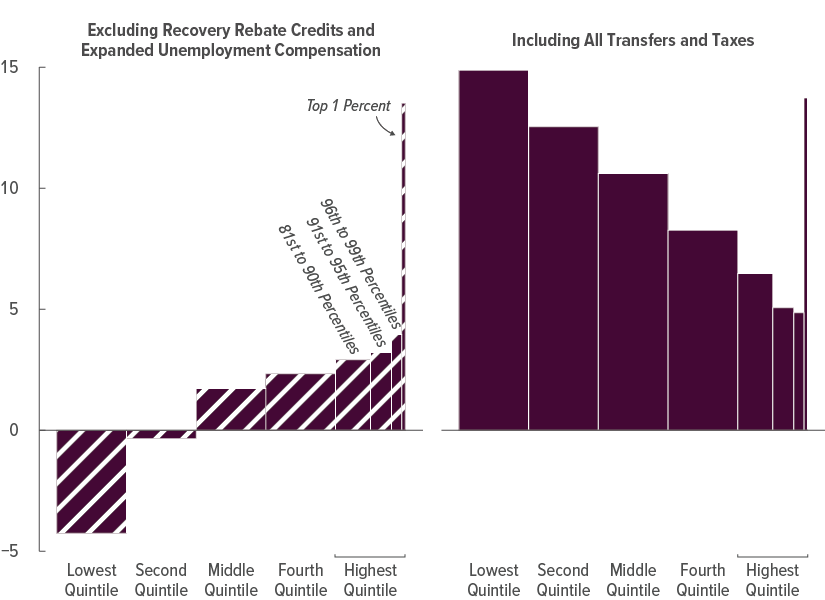
According to CBO’s estimates, households in each of the four lower quintiles received an average of about $7,000 in payments from two temporary programs—recovery rebate credits and expanded unemployment compensation—in 2020. For households in the lowest quintile, those payments amounted to $7,600 per household, on average, which was roughly evenly split between the two policies. The payments amounted to about one-third of the income of those households before transfers and taxes. In contrast, households in the top 1 percent received an average of about $3,000, which was equal to about 0.1 percent of their income.
Average Amount of Recovery Rebate Credits and Expanded Unemployment Compensation per Household in 2020, by Income Group
On average, households in all income groups received about $6,300 in benefits from two pandemic-related policies. Lower-income households received larger payments, on average, and those payments were a substantially larger proportion of their income before transfers and taxes.
Means-Tested Transfer Rates Increased Significantly for Low-Income Households
From 2019 to 2020, means-tested transfer rates (that is, transfers as a share of income) increased for every quintile. For households in the lowest quintile, that rate increased the most—by 27 percentage points, from 65 percent to 93 percent. In other words, total means-tested transfers received by households in that quintile equaled 93 percent of all their income before transfers and taxes. For households in the second quintile, that rate increased by 9 percentage points, and for those in the middle quintile, it rose by 4 percentage points. If this analysis had not included expanded unemployment compensation as a means-tested transfer, those increases would have been smaller. The transfer rate in the lowest quintile would have increased by 9 percentage points—of which 6 percentage points would have been attributable to increases in Medicaid and CHIP and 3 percentage points to increases in SNAP.
Average Means-Tested Transfer Rates in 2019 and 2020, by Income Group
Means-tested transfers increased relative to income for all income groups in 2020. The gain was largest for those in the lowest quintile. For all groups, most of the increase was attributable to expanded unemployment compensation.
Tax Rates Decreased Across the Distribution Because of Recovery Rebate Credits
For all income groups in 2020, recovery rebate credits accounted for most of the decreases in average federal tax rates. The average rate was reduced by at least 4 percentage points for households in each of the four lower quintiles. For households in the lowest quintile, the rate decreased by 17 percentage points from 2019 to 2020 and became negative. (A tax rate can be negative because of refundable tax credits, which can result in net payments from the federal government that offset other taxes paid by those households.)11 Among households in the second quintile, the rate declined by 8 percentage points. In contrast, the average federal tax rate among households in the highest quintile changed very little—by less than half a percentage point.
Average Federal Tax Rates in 2019 and 2020, by Income Group
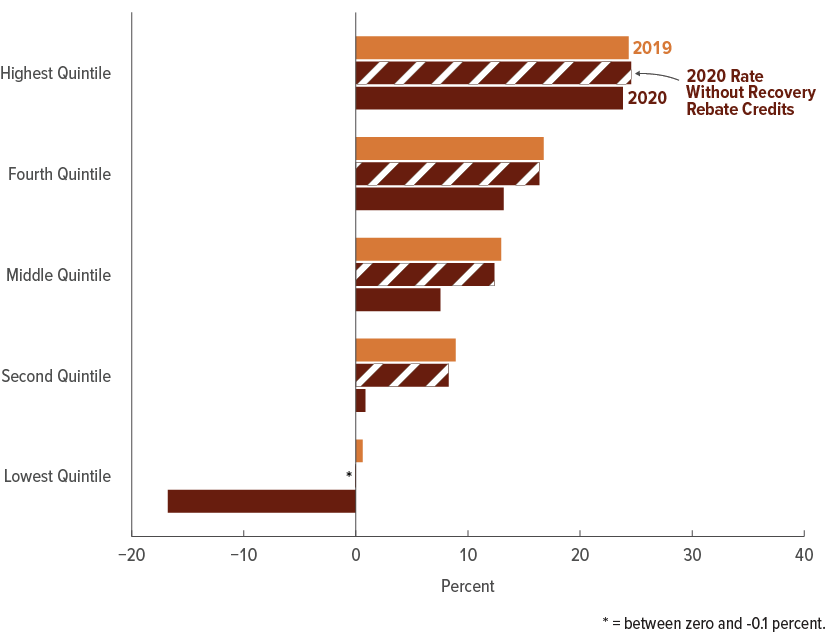
Average federal tax rates fell for all income groups, largely because of recovery rebate credits. They decreased by the largest amount among households in the lowest quintile. Without recovery rebate credits, those rates would have remained roughly the same as in 2019.
Income After Transfers and Taxes
Income after transfers and taxes includes the addition of means-tested transfers and the subtraction of federal taxes. As income rises, means-tested transfer rates decrease, and federal tax rates increase. As a result, income after transfers and taxes is less skewed toward the top of the distribution than is income before transfers and taxes.
Means-tested transfers and federal taxes played a larger role in 2020 than in 2019 in reducing the extent to which income was skewed toward the top of the distribution. That is mainly because of the introduction of recovery rebate credits and expanded unemployment compensation. To a lesser extent, the automatic stabilizer effects of transfers and taxes, as well as legislative changes (such as those affecting Medicaid and SNAP), also played a role.
Income After Transfers and Taxes Increased for All Income Groups
On average, income after transfers and taxes increased for households in all income quintiles in 2020. The distribution was more even than in 2019 (in percentage terms) because income grew at higher rates for households in the lower quintiles than for those in the higher quintiles. For households in the lowest quintile, average income after transfers and taxes increased from $39,900 to $45,800 (or by 15 percent). For households at the other end of the distribution, average income increased from $256,500 to $275,700 (or by 7 percent).
Average Income After Transfers and Taxes in 2019 and 2020, by Income Group
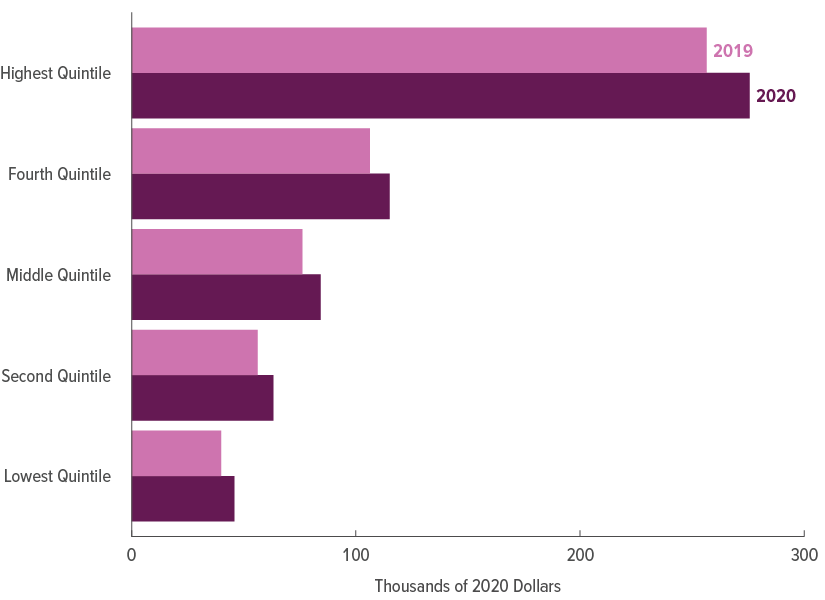
Income after transfers and taxes grew for all income groups in 2020. As a percentage, the increase was largest for households in the lowest quintile.
Growth Rates in Income After Transfers and Taxes Were Highest at the Top and Bottom of the Distribution
Benefits from recovery rebate credits and expanded unemployment compensation were similar in dollar terms across the majority of the income distribution in 2020, although low-income households received the largest benefits measured as a share of their income. Without those two policies, the changes in income after transfers and taxes would have resembled the changes in income before transfers and taxes—that is, income would have decreased for households at the bottom of the distribution (by 4 percent among those in the lowest quintile) and increased for households at the top of the distribution (by 14 percent among those in the top 1 percent).
However, including recovery rebate credits and expanded unemployment compensation in the income measure caused income after transfers and taxes to rise for all income groups. The increase was 15 percent among households in the lowest quintile, 11 percent among those in the middle quintile, and 14 percent among those in the top 1 percent.
Changes in Average Income After Transfers and Taxes Between 2019 and 2020, by Income Group
Percent
Recovery rebate credits and expanded unemployment compensation significantly altered the distribution of income after transfers and taxes.
Because of those policies, the percentage increase in income after transfers and taxes among households in the lowest quintile was larger than that among households in the top 1 percent of the income distribution.
Income Inequality
As the distribution of income shifts each year in the United States, so does the degree of income inequality. A standard statistical measure of income inequality is the Gini coefficient, which summarizes an entire distribution in a single number that ranges from zero to one. At the theoretical extremes, a value of zero means that income is distributed equally among all households, whereas a value of one indicates that all income is received by a single household (and none is received by any other households).12 This analysis compares Gini coefficients based on income before transfers and taxes and on income after transfers and taxes.
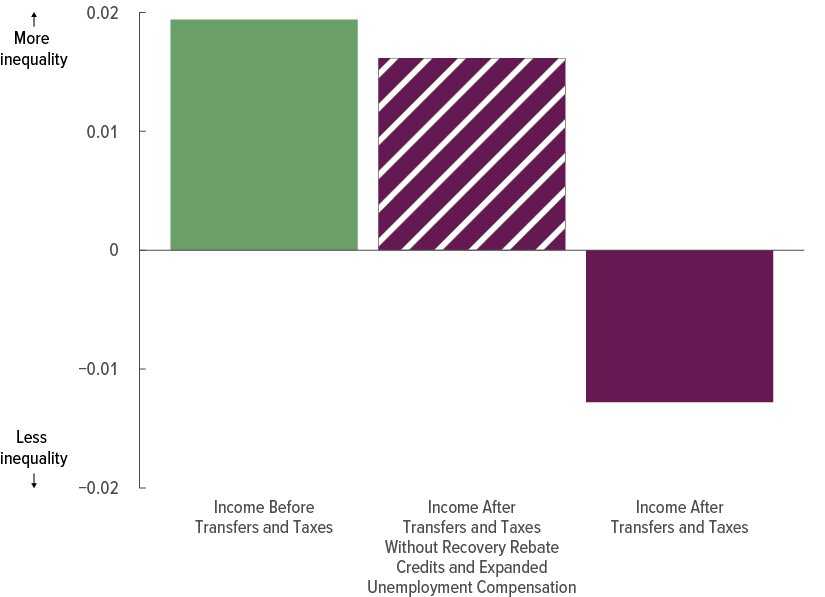
Transfers and Taxes Reversed the Growth of Income Inequality
When calculated using income before transfers and taxes, the Gini coefficient rose by 0.019 in 2020—that is, inequality increased from its measure in 2019. In contrast, the Gini coefficient based on income after transfers and taxes fell by 0.013. If recovery rebate credits and expanded unemployment compensation had been excluded from the calculation, the Gini coefficient would have risen by 0.016 in 2020.
Change in Income Inequality Between 2019 and 2020 As Measured by the Gini Coefficient
Inequality based on income before transfers and taxes increased in 2020.
Without recovery rebate credits and expanded unemployment compensation, transfers and taxes would have lessened that increase only slightly. Those policies caused inequality to decrease.
Transfers and Taxes Took Inequality From an All-Time High to a 14-Year Low
When calculated using income before transfers and taxes, the Gini coefficient—at 0.533—was higher in 2020 than in any other year since 1979, the earliest year in CBO’s sample. Before 2020, the Gini coefficient was highest in 2014 (when it reached 0.525).
But when calculated using income after transfers and taxes, the Gini coefficient was 0.417 in 2020—lower than in any year since 2009, when it reached 0.413. If recovery rebate credits and expanded unemployment compensation had not been included, the 2020 Gini coefficient would have been 0.446—higher than in any year since 2007 (when it was 0.455).
Income Inequality As Measured by the Gini Coefficient, 1979 to 2020
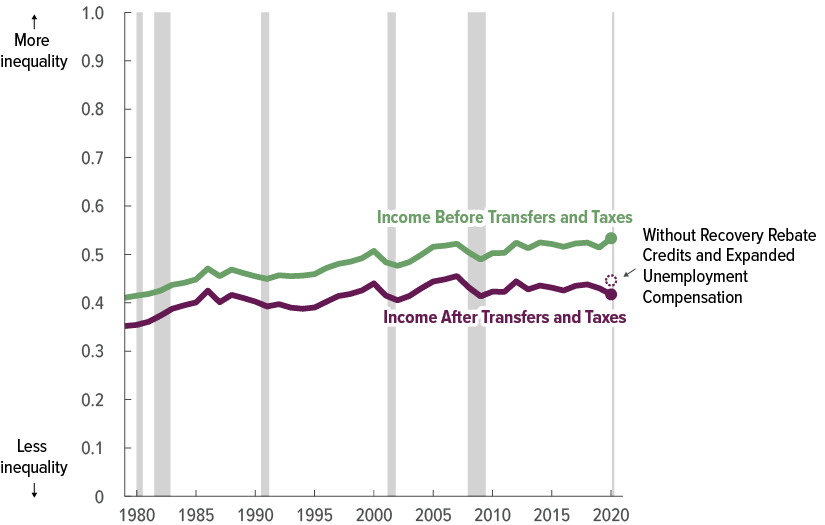
In 2020, inequality based on income before transfers and taxes was the highest it has ever been in CBO’s analyses.
Inequality based on income after transfers and taxes was at its lowest point in over a decade in 2020. If recovery rebate credits and expanded unemployment compensation had not been included in this analysis, inequality would have been at its highest point in over a decade.
1. CBO estimates that 317 million people lived in those households. The agency’s estimate of the U.S. population excludes members of the armed forces on active duty and people in institutions (such as prisons or nursing homes).
2. Not all households receive means-tested transfers, but virtually all households pay federal taxes in some form (individual income taxes, payroll taxes, corporate taxes, or excise taxes).
3. For a comprehensive list of legislated changes to federal policies implemented in response to the pandemic in 2020, see Congressional Budget Office, The Budgetary Effects of Laws Enacted in Response to the 2020 Coronavirus Pandemic, March and April 2020 (June 2020), www.cbo.gov/publication/56403, and The Budgetary Effects of Major Laws Enacted in Response to the 2020–2021 Coronavirus Pandemic, December 2020 and March 2021 (September 2021), www.cbo.gov/publication/57343.
4. For this analysis, CBO analyzed these means-tested transfer programs (which are listed from largest to smallest): expanded unemployment compensation, Medicaid and the Children’s Health Insurance Program, the Supplemental Nutrition Assistance Program, Supplemental Security Income, housing assistance, low-income subsidies for Part D of Medicare (which covers prescription drugs), Temporary Assistance for Needy Families, child nutrition, the Low Income Home Energy Assistance Program, and state and local governments’ general assistance programs.
5. Although means-tested transfers are designed to assist people with low income, data indicate that some high-income households receive benefits from the transfer programs. That may happen for several reasons. For example, some people have income that varies during the year and may therefore qualify for benefits on the basis of low monthly income even though their annual income is high. In addition, some people who qualify for benefits because their own income is low live in high-income households. Moreover, a portion of the benefits reported as going to high-income households probably reflects some misreporting of income, program participation, and benefit amounts in the survey data that underlie CBO’s estimates. Finally, expanded unemployment compensation, which is included in this analysis as a means-tested transfer, was available to all unemployed people (including previously self-employed people), regardless of their income.
6. The value of benefits provided through Medicaid (and the Children’s Health Insurance Program) that are allocated to households is based on the government’s average cost of providing those benefits.
7. The remaining federal revenue sources not allocated to U.S. households are states’ deposits for unemployment insurance, estate and gift taxes, net income earned by the Federal Reserve System, customs duties, and miscellaneous fees and fines. Because of the complexity of estimating state and local taxes for individual households, this report considers federal taxes only. For estimates of the distribution of state and local taxes, see Meg Wiehe and others, Who Pays? A Distributional Analysis of the Tax Systems in All 50 States, 6th ed. (Institute on Taxation and Economic Policy, October 2018), https://itep.org/whopays/; and Gerald Prante and Scott Hodge, The Distribution of Tax and Spending Policies in the United States, Special Report 211 (Tax Foundation, November 2013), https://tinyurl.com/roj9t2g (PDF). Researchers’ conclusions about the distributional effects of state and local taxes differ.
8. Federal taxes allocated to households in this analysis are based on tax liabilities incurred in calendar year 2020.
9. The Paycheck Protection Program was created to provide loans to businesses with fewer than 500 employees. Nearly all those loans were ultimately forgiven, though, so the program’s benefits were, in effect, grants to businesses.
Although the PPP resembled other programs that provided benefits to entities other than households and that therefore are not explicitly accounted for in this analysis, it was the largest new program created in response to the pandemic. As a result, allocating its benefits to households could alter CBO’s analysis of the overall distribution of household income.
The PPP was intended to help employers continue to pay their employees through the economic disruption caused by the pandemic. Some studies have estimated the program’s effectiveness at meeting that goal—for example, see Michael Faulkender, Robert Jackman, and Stephen Miran, The Job-Preservation Effects of Paycheck Protection Program Loans (February 2023), https://tinyurl.com/3du5wtvc. Program payments were made directly to employers, who used some portion of the funds for that purpose and other portions to pay providers of intermediate goods and services. Those effects are included in this analysis as part of income before transfers and taxes. The remainder of those funds may have accrued as direct benefits to employers.
Determining the extent to which employers used the funds for each of those purposes is difficult, in large part because the benefits were not taxable and therefore cannot be observed in CBO’s data. The ultimate incidence of the PPP—that is, the share of program dollars that was allocated to workers versus employers—is also difficult to determine. The distribution of PPP payments depends heavily on those shares because the employees who would have lost their jobs if not for the program tend to be lower in the income distribution than the business owners and shareholders who also benefited from the program.
Some studies have estimated the incidence and distributional effects of the PPP and the program’s effectiveness at mitigating job losses, with varying results. In one study, for example, David Autor and others (David Cho, Leland D. Crane, Mita Goldar, Byron Lutz, Joshua Montes, William B. Peterman, David Ratner, Daniel Villar, and Ahu Yildirmaz) estimate that between 23 percent and 34 percent of PPP dollars in 2020 were used to preserve jobs. The authors allocated the program’s benefits to households, estimating that around 3 percent of the benefits accrued to households in the lowest quintile and 72 percent accrued to households in the highest quintile. In another study, David Splinter and others (Eric Heiser, Michael Love, and Jacob Mortenson) estimate that about 61 percent of PPP dollars went toward employee retention costs (including nonwage payroll costs). According to their allocations, about 10 percent of the benefits accrued to households in the lowest quintile, and a little over 40 percent accrued to households in the highest quintile.
Those studies used different data, methods, allocation rules, and income measures and thus attributed very different distributional consequences to the benefits of the PPP when measured as a percentage of household income. David Autor and others find that PPP benefits were regressive—that is, households toward the bottom of the distribution received less as a share of their income than did households toward the top of the income distribution—whereas David Splinter and others find the program to be progressive.
Because of the size of the PPP, any allocation of its benefits would alter the overall distribution of household income—and, as the results from those two analyses show, determining the appropriate allocation would entail a great deal of uncertainty. This analysis does not attempt to separately allocate the effects of the PPP and probably excludes the portion of PPP funds that accrued directly to employers.
For more information, see David Autor and others, “The $800 Billion Paycheck Protection Program: Where Did the Money Go and Why Did it Go There?” Journal of Economic Perspectives, vol. 36, no. 2 (Spring 2022), pp. 55–80, https://tinyurl.com/2983ywh8; and David Splinter and others, The Paycheck Protection Program: Progressivity and Tax Effects (August 2023), www.davidsplinter.com/ppp.pdf.
10. Sandy Baum and Adam Looney, “Who Owes the Most in Student Loans: New Data From the Fed” (Brookings, October 2020), https://tinyurl.com/ycy8d5u7.
11. In the federal budget, the portion of refundable tax credits that reduces the amount of taxes owed is typically counted as a reduction in revenues, and the portion that exceeds a filer’s tax liability is typically treated as an outlay. In this analysis, CBO treated the refundable and nonrefundable portions of the credit jointly and treated the entire portion of recovery rebate credits as an outlay. For more details about the history and economic effects of refundable tax credits, see Congressional Budget Office, Refundable Tax Credits (January 2013), www.cbo.gov/publication/43767.
12. The Gini coefficient can also be interpreted as a measure of one-half of the average difference in income between every pair of households in the population, divided by the average income of the total population. For example, the Gini coefficient based on income before transfers and taxes—which was 0.533 in 2020—indicates that the average difference in income before transfers and taxes between pairs of households in that year was equal to 106.6 percent (twice 0.533) of average household income, or about $85,600 (adjusted to account for differences in household size).
Appendix AData and Methods Used in This Analysis
The Congressional Budget Office has released its analyses of the distribution of household income and federal taxes for more than 30 years.1 This appendix provides additional details about CBO’s analytic method and its most important underlying assumptions. The estimates in this report were produced using the agency’s framework for analyzing the distributional effects of both means-tested transfers and federal taxes.2 That framework uses income before transfers and taxes, which consists of market income plus social insurance benefits. That measure is used to rank households when creating income groups and serves as the base income measure when calculating average means-tested transfer rates and average federal tax rates.3
The supplemental data posted along with this report include additional distributional data that rank households according to alternate income measures, such as income after transfers and taxes. Those supplemental data, available at www.cbo.gov/publication/59509#data, also include data for three types of households: households headed by elderly people (defined as those age 65 or older); households with children (defined as those under age 18); and nonelderly, childless households. The additional data, broken out by household type, are reported for each income group.
In this report, CBO assesses the distribution of annual income, which is one measure of economic well-being. CBO does not examine other measures of economic well-being, such as household income measured over a longer period, household consumption, or household wealth. Nor does this report analyze the considerable variation in income, taxes paid, and tax rates within each income group, which cannot be captured by calculating averages alone.
In addition, this report does not explicitly or comprehensively assess the economic mobility of households—that is, their movement among income groups from one year to the next. In developing its estimates that compare the distribution of household income in 2020 to that in 2019, though, CBO examined the movement of households among quintiles (or fifths of the distribution) between those two years and found that the amount and patterns resembled those in recent years. Other researchers have analyzed economic mobility more fully.4
Finally, this report focuses on the effects of the federal government’s fiscal (tax and spending) policies. The government’s monetary, regulatory, and trade policies also affect the distribution of household income, but the direct distributional effects of those other federal policies are not examined in this report. Most state and local governments’ fiscal policies also are not examined here, except for some state-level means-tested transfers (the largest of which are provided through Medicaid and the Children’s Health Insurance Program).
Unit of Analysis
CBO uses households as the unit of analysis in its distributional reports. A household consists of the people who share a housing unit regardless of their relationship.5 A household can consist of more than one tax-filing unit, such as a married couple and their adult child.
The data used in CBO’s analyses come from the Internal Revenue Service (IRS), which provides data on tax-filing units, and from the Census Bureau, which provides household-level data. To incorporate data on tax-filing units into its analysis, CBO creates tax-filing units from the household-level data on the basis of the information (on relationships and income) collected by household surveys. After both data sources are organized using the same unit of analysis (tax-filing units), they are statistically matched to create a database with information from both sources. For the final presentation of distributional results, data for those statistically matched tax-filing units are combined and represented at the household level.
Data
The core data used in CBO’s distributional analyses come from the Statistics of Income (SOI), a nationally representative sample of individual income tax returns collected by the IRS. That sample of tax returns becomes available to CBO approximately two years after the returns are filed. Data on household income are systematically and consistently reported in the SOI. The sample is therefore considered a reliable resource to use when analyzing the effects of fiscal policy on income. However, certain types of income are not reported in the SOI. In 2020, for example, the portion of payments from the Paycheck Protection Program that was not used to pay for employees’ wages was not taxable and therefore not available in the SOI data.
SOI data include information about tax filers’ family structure and age, but they do not include certain demographic information or data on people who do not file taxes. For that information, CBO uses data from the Annual Social and Economic Supplement of the Census Bureau’s Current Population Survey (CPS), which has data on the demographic characteristics and income of a large sample of households.6
CBO combines the two data sources, statistically matching each SOI record to a corresponding CPS record on the basis of demographic characteristics and income. Each pairing results in a new record that takes on some characteristics of the CPS record and some characteristics of the SOI record.7
Statistical Matching
The first step in the statistical matching process is to align the unit of analysis by constructing tax-filing units from CPS households. A tax-filing unit is a single person or a married couple plus any dependents. In CBO’s analyses, the heads of CPS households (and their spouses, if present) are designated as tax-filing units. Tax rules are used to determine whether other members of the household can be claimed as dependents on the basis of their age, relationship with the primary tax-filing unit, and income.8 People who meet those criteria are classified as dependents; those who do not are classified as separate tax-filing units within the household. When multiple people could claim one member of a household as a dependent, CBO assumes that the household chooses the arrangement that results in the most advantageous tax situation—for example, two unmarried, cohabitating partners with two children might each claim one child and file as a head of household if doing so lowered their combined taxes.
Next, CBO divides the tax-filing unit records in each file into 15 demographic groups on the basis of marital status (married or single); number of dependents (zero, one, or two or more); whether the tax-filing unit can be claimed as a dependent (yes or no); and whether the tax filer and his or her spouse (if applicable) are 65 or older (neither, one, or both). Records from the two files are matched within the same demographic groups, with certain exceptions. Because the CPS file contains fewer head-of-household tax-filing units (single parents with dependent children) than the SOI file does, some SOI head-of-household tax-filing units are matched with single tax-filing units without children and married tax-filing units from the CPS. The deficit in head-of-household filers in the CPS data probably reflects some combination of misreporting of filing status in the SOI and a shortcoming of the algorithm that creates tax units for the CPS in accounting for complex living arrangements.
Within each demographic group, CBO estimates an ordinary least squares (OLS) regression model of total income as a function of all the sources of income that are common to both the SOI and the CPS—such as wages, interest, dividends, rental income, business income and losses, pension income, and unemployment insurance. The OLS models are estimated using the SOI data. CBO applies the coefficients estimated from the regression models to the records in both files to construct a predicted total income variable. CBO then sorts tax-unit records in both files (independently within each demographic cell) in descending order by predicted total income.
Because the SOI and CPS data come from samples, each record from both files has a sample weight associated with it. The sum of all the sample weights in the SOI file represents the total number of tax units that filed taxes in a given year. The sum of all the weights in the CPS file represents all the tax units in the United States—those that filed a tax return as well as those that did not. The SOI file contains many more records than the CPS file, yet it represents fewer total tax units. Therefore, the average sample weight in the SOI file is lower than the average sample weight in the CPS file (see Table A-1).
Table A-1.
Weighted and Unweighted Sample Sizes in the Data CBO Used to Analyze the Distribution of Household Income, by Income Group, 2020
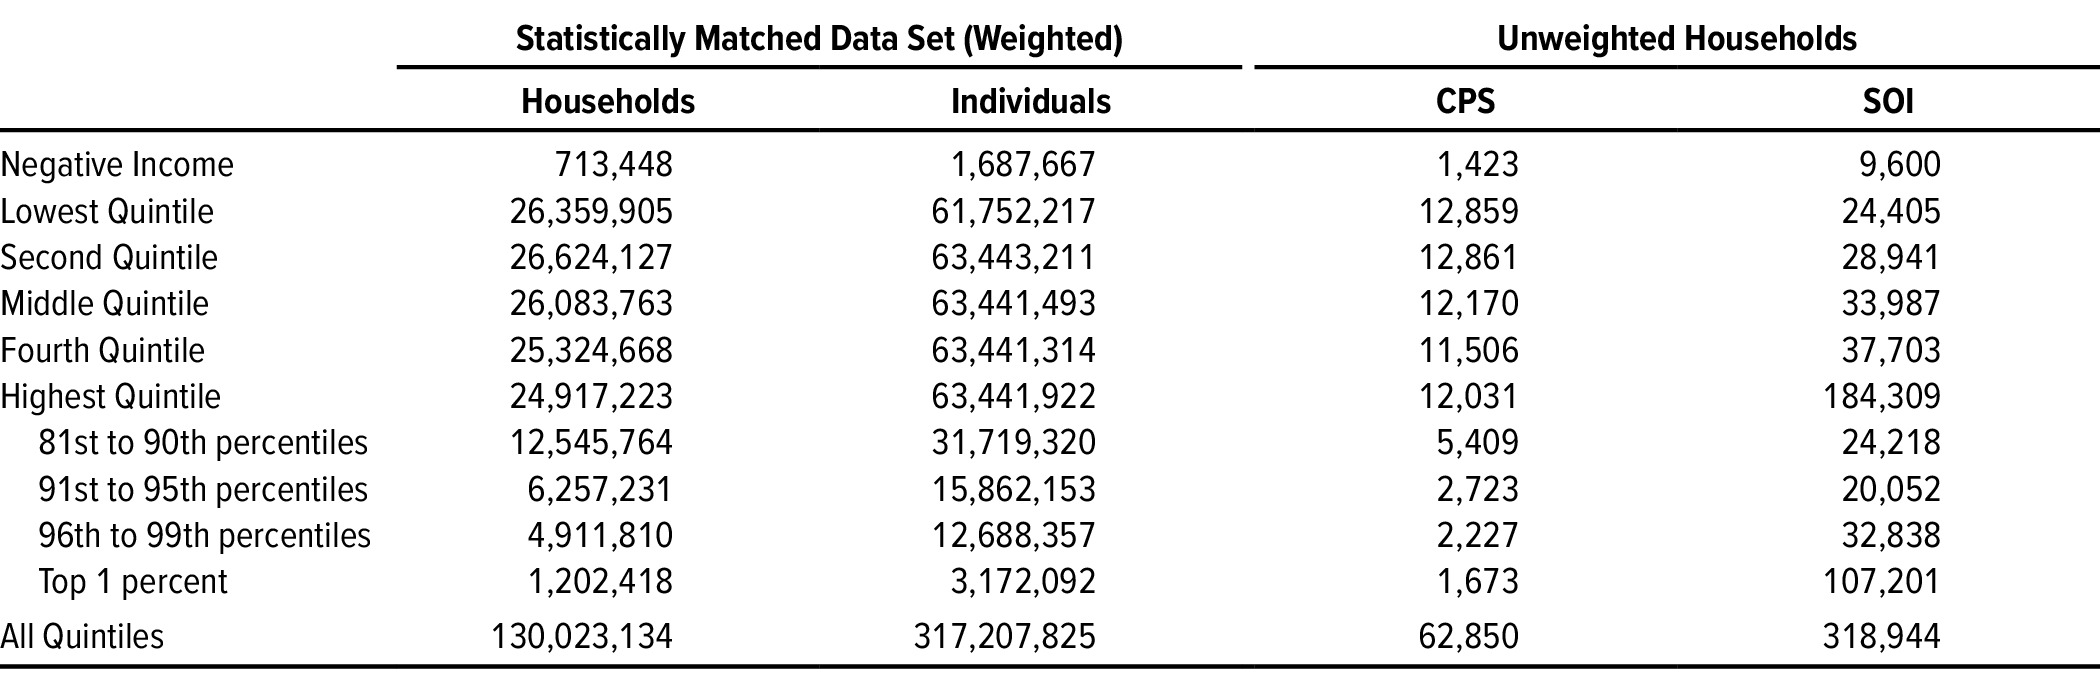
Data source: Congressional Budget Office. See www.cbo.gov/publication/59509#data.
Each quintile (one-fifth of the distribution) and each percentile (one-hundredth of the distribution) contains approximately the same number of people but different numbers of households.
CPS = Current Population Survey; SOI = Statistics of Income (a nationally representative sample of individual income tax returns collected by the Internal Revenue Service).
Those differences in sample weights mean that SOI and CPS records cannot be matched one to one. Instead, within each demographic group, matching begins with the record from each file that represents the highest predicted total income. Of the two records, the one with the lower sample weight is matched to only one corresponding record from the other file. The record with the higher weight is “split” and is available (with its weight reduced) to be matched to the next record in the other file. (In practice, the highest-income SOI records have very low sample weights, so the matching algorithm matches the top CPS record to many SOI records.)
That process is repeated until all SOI records are exhausted. Each matched pairing results in a new record with the demographic characteristics of the CPS record and the income reported in the SOI. Some types of income, such as certain types of transfer payments and in-kind benefits, appear only in the CPS records; values for those items are drawn directly from that survey. Income values for CPS records that represent nonfiling tax units are taken directly from the CPS. Residual CPS records (those with the lowest predicted income) are assumed to represent tax-filing units that did not file a tax return.
Finally, households are reconstructed from tax-filing units on the basis of relationships reported in the CPS. In general, CPS tax-filing units will have been matched to multiple SOI tax-filing units. When CPS tax-filing units are combined at the household level, multiple replications of a given household are created to cover all possible combinations of the matched SOI–CPS tax units. Each household replication is appropriately weighted so that the sum of all the replications equals the original CPS household-level sample weight.9
Measures of Income, Federal Taxes, and Means-Tested Transfers
Most distributional analyses rely on a measure of annual income as the metric for ranking households. In CBO’s analyses of the distribution of household income, information about taxable income sources for tax-filing units that file individual income tax returns comes from the SOI, whereas information about nontaxable income sources and income for tax-filing units that do not file individual income tax returns comes from the CPS. Among households at the top of the income distribution, the majority of income data are drawn from the SOI. In contrast, among households in the lower and middle quintiles, a larger portion of income data is drawn from the CPS (see Table A-1).
Most measures of income are drawn from federal tax returns, and those income measures are not adjusted to match the Bureau of Economic Analysis’s (BEA’s) national income and product accounts. This analysis does not capture income that is underreported or misreported to the IRS as a result of tax noncompliance.10 Underreported income that is excluded from this analysis may affect the distribution of income.11
Income before transfers and taxes has five main categories: labor income, business income, capital income (including capital gains), other income, and social insurance. (For more information about each category, see Appendix B.) Those categories largely reflect how income is reported on individual income tax returns.
In this report, CBO’s measures of federal taxes are based on tax liabilities incurred in a calendar year, regardless of when those liabilities are paid. By contrast, federal receipts measure taxes paid to the government in that year, regardless of when those liabilities are incurred. The measures of individual income taxes (including taxes on pass-through business income) and payroll taxes are calculated on the basis of the income and characteristics of each tax-filing unit in the underlying dataset. Those calculated values align closely with the reported values. The measure of excise taxes is drawn from data on tax liabilities and collections from the IRS. The measure of corporate taxes comes from BEA’s estimate of taxes on corporate income plus CBO’s estimate of repatriation tax payments due.12
The measures of transfers used in this report are mostly drawn from the agencies that administer the relevant programs. For example, the measure of benefits from the Supplemental Nutrition Assistance Program comes from the Food and Nutrition Service in the Department of Agriculture. CBO then adjusts those data to align them with the CPS’s sampling frame and reporting period.13
Incidence of Federal Taxes
CBO allocates individual income taxes and the employee’s share of payroll taxes directly to the households paying those taxes. CBO also allocates the employer’s share of payroll taxes to employees because employers appear to pass on their share of payroll taxes to employees by paying them lower wages than they otherwise would.14 The incidence of those taxes could differ from CBO’s allocation, though. Research literature suggests that many factors could cause that outcome, especially in the short term.15
CBO’s approach is to allocate those taxes to households according to their consumption of taxed goods and services. Excise taxes on intermediate goods, which are paid by businesses, are allocated to households in proportion to their overall consumption. CBO assumes that household spending patterns among income and demographic groups in the CPS are similar to those observed in the Bureau of Labor Statistics’ Consumer Expenditure Survey.
Researchers disagree about how to allocate corporate income taxes (and taxes on capital income generally). CBO’s approach is to allocate 75 percent of corporate income taxes to owners of capital in proportion to their income from interest, dividends, rents, and adjusted capital gains. That measure excludes some forms of capital income that are more difficult to measure, such as investment earnings in tax-preferred retirement accounts and unrealized capital gains.16 For the purposes of that allocation, CBO adjusts capital gains by scaling them to their long-term historical level given the size of the economy and the applicable tax rate; that method reduces the effects of large annual variations in the total amount of gains realized. CBO allocates the remaining 25 percent of corporate income taxes to workers in proportion to their income from labor.17
Adjustments for Household Size
Households with identical income can differ in ways that affect their economic status. For example, a larger household generally needs more income to support a given standard of living than a smaller one does. However, economies of scale in some types of consumption—housing, in particular—can mean that two people generally do not need twice the income to live as well as one person who lives alone. For that reason, household income is an imperfect measure of economic status.
To rank households in a way that better accounts for economies of scale, CBO adjusts the income measure, dividing household income by an adjustment factor known as an equivalence scale. Various equivalence scales are in use today, and a significant, if somewhat dated (though still useful), body of literature explores why and how alternative equivalence scales should be calculated for the purpose of setting public policy parameters—specifically, parameters related to measuring poverty and setting eligibility criteria for means-tested programs.18
To account for households’ economies of scale, the equivalence scale should have a value between one and the number of people in the household. An equivalence scale equal to one would make no change to the income measure and would not account for the greater needs of larger households. An equivalence scale equal to the number of people in the household, by contrast, would imply that each person requires the same resources, which would not capture the benefits of shared consumption—most significantly, housing expenses—within the household.
A generalized formula for calculating an equivalence scale can be expressed as follows:
ES = nc
where n is the number of people in the household and e is an elasticity parameter for household size that ranges from zero to one, with larger values implying smaller economies of scale.19 To adjust household income for differences in household size, CBO uses an equivalence scale known as the square root scale. Using that method, CBO calculates adjusted household income by dividing household income by the square root of the number of people in the household.
Calculating the equivalence scale as the square root of the number of people in the household is the same as setting the elasticity parameter for household size to 0.5 because √n = n0.5. Using 0.5 as the elasticity parameter for household size is convenient for several reasons:
- It is the midpoint in the range of possible values for the parameter (n0 < n0.5 < n1).
- It implies that each additional person increases the household’s needs but at a decreasing rate.
- The resulting household-size adjustment is similar to the family-size adjustments the Census Bureau uses in setting U.S. poverty thresholds.
- It is transparent and relatively easy to understand.
Applying the square root equivalence scale to adjust income for differences in household size means that some households with higher income but more people living in them may be considered equivalent in income to households with lower income but fewer people living in them.
CBO adjusts income for household size only for the purpose of ranking households and assigning them to income groups. (All other income measures in the agency’s distributional analyses are unadjusted.) The highest quintile is broken down into smaller, percentile-based groupings (the 81st through 90th percentiles, the 91st through 95th percentiles, the 96th through 99th percentiles, the 99th to 99.9th percentiles, the 99.9th to 99.99th percentiles, and the top 0.01 percent) to provide additional detail. Each quintile contains approximately 20 percent of the civilian noninstitutionalized U.S. population, and each full percentile (that is, a percentile expressed as a whole number) contains approximately 1 percent of the population. However, because household sizes vary, the adjusted household income quintiles contain slightly different numbers of households (see Table A-1).
1. For links to reports in this series going back to 2001, see Congressional Budget Office, “Major Recurring Reports,” https://go.usa.gov/xF8ht.
2. For more details about CBO’s current framework and how it differs from the agency’s previous approach to distributional analyses, see Kevin Perese, CBO’s New Framework for Analyzing the Effects of Means-Tested Transfers and Federal Taxes on the Distribution of Household Income, Working Paper 2017-09 (Congressional Budget Office, December 2017), www.cbo.gov/publication/53345.
3. Social insurance benefits consist of benefits provided through Social Security (Old Age, Survivors, and Disability Insurance); Medicare (measured as the average cost to the government of providing those benefits, net of offsetting receipts); regular unemployment insurance (that is, not the temporary expansions to unemployment benefits that were enacted in response to the coronavirus pandemic); and workers’ compensation. Although those social insurance benefits are often considered forms of government transfers, they are included in the base measure of income that CBO uses to rank households. The distributional effects of those benefit programs are not directly examined in this report, however. Social Security and Medicare, in particular, provide substantial resources to retirees and significantly affect the distribution of household income. In CBO’s estimation, when analyzing the distributional effects of those programs, it is more appropriate to use lifetime measures of income earned, payroll taxes paid, and benefits received. The framework used to analyze the distribution of household income in this report is based on annual income data and, therefore, is less suitable for analyzing the distributional effects of those retirement benefit programs.
4. For an overview of research on economic mobility, see Federal Reserve Bank of St. Louis and the Board of Governors of the Federal Reserve System, Economic Mobility: Research and Ideas on Strengthening Families, Communities, and the Economy (2016), https://tinyurl.com/ycykrhbv. See also Katharine Bradbury, Family Characteristics and Macroeconomic Factors in U.S. Intragenerational Family Income Mobility, 1978–2014, Opportunity and Inclusive Growth Institute System Working Paper 19-08 (Federal Reserve Bank of Minneapolis, October 2019), https://tinyurl.com/y2wrztu6 (PDF).
5. The Treasury Department’s Office of Tax Analysis uses family units in its distributional analyses. Family units are similar to household units but exclude unrelated people who live together. The Internal Revenue Service, the Joint Committee on Taxation, and the Urban–Brookings Tax Policy Center all use tax-filing units as the unit of analysis for their distributional analyses.
6. The CPS sampling frame seeks to represent the civilian noninstitutionalized population in the United States. The scope of CBO’s analysis is therefore limited to that population. People living in correctional facilities, in nursing homes, and on military bases are not included in this analysis. However, members of the armed forces living in civilian housing units on a military base or in a household not on a military base are included. In 2014, the Census Bureau split the CPS sample into two groups to test new income and health insurance questions on a smaller subsample. For this report, CBO used the data corresponding to survey questions that were consistent with those used in prior years.
7. For a general description and evaluation of statistical matching, see Marcello D’Orazio, Marco Di Zio, and Mauro Scanu, Statistical Matching: Theory and Practice (John Wiley & Sons, 2006), http://dx.doi.org/10.1002/0470023554; and Michael L. Cohen, “Statistical Matching and Microsimulation Models,” in Constance F. Citro and Eric A. Hanushek, eds., Improving Information for Social Policy Decisions: The Uses of Microsimulation Modeling—Volume II: Technical Papers (National Academies Press, 1991), pp. 62–86, http://dx.doi.org/10.17226/1853.
8. A dependent may be considered a tax-filing unit if he or she received income above a certain threshold in a given tax year.
9. For a graphical presentation of the statistical matching algorithm, see Kevin Perese, “Statistically Matching Administrative Tax Data With Household Survey Data” (presentation at a Washington Center for Equitable Growth workshop on distributional national accounts, July 21, 2017), www.cbo.gov/publication/52914.
10. For a description of tax noncompliance, see Internal Revenue Service, Federal Tax Compliance Research: Tax Gap Estimates for Tax Years 2014–2016, Publication 1415 (October 2022), www.irs.gov/pub/irs-pdf/p1415.pdf.
11. Other researchers have found that as a result of tax noncompliance, tax data may understate income. See Andrew Johns and Joel Slemrod, “The Distribution of Income Tax Noncompliance,” National Tax Journal, vol. 63, no. 3 (September 2010), pp. 397–418, www.jstor.org/stable/41791058; and John Sabelhaus and Somin Park, U.S. Income Inequality Is Worse and Rising Faster Than Policymakers Probably Realize (Washington Center for Equitable Growth, May 2020), https://tinyurl.com/ybquz5ac.
12. CBO uses BEA’s series from the national income and product accounts, Table 3.2, “Federal Government Current Receipts and Expenditures,” line 8 (Taxes on Corporate Income). Repatriation tax payments reflect a provision of the 2017 tax act that imposed a onetime tax on foreign profits that had not been previously taxed by the United States. Corporations can make those payments in installments over an eight-year period starting in 2018.
13. For more details about how CBO develops administrative totals for transfer programs, see Bilal Habib, How CBO Adjusts for Survey Underreporting of Transfer Income in Its Distributional Analyses, Working Paper 2018-07 (Congressional Budget Office, July 2018), www.cbo.gov/publication/54234.
14. In theory, if payroll taxes did not exist, an employee’s salary or wages would be higher by approximately the amount of the employer’s share of the payroll tax. Therefore, CBO adds the employer’s share of payroll taxes to a household’s earnings when calculating income before transfers and taxes.
15. Dorian Carloni, Revisiting the Extent to Which Payroll Taxes Are Passed Through to Employees, Working Paper 2021-06 (Congressional Budget Office, June 2021), www.cbo.gov/publication/57089.
16. For a discussion of alternative methods for allocating corporate income to individuals, see the online appendix to Matthew Smith and others, “Capitalists in the Twenty-First Century,” The Quarterly Journal of Economics, vol. 134, no. 4 (November 2019), pp. 1675–1745, https://doi.org/10.1093/qje/qjz020.
17. For a more detailed discussion about how CBO allocates corporate taxes, see Congressional Budget Office, The Distribution of Household Income and Federal Taxes, 2008 and 2009 (July 2012), www.cbo.gov/publication/43373.
18. See, for example, OECD Project on Income Distribution and Poverty, “What Are Equivalence Scales?” (accessed April 27, 2021), https://tinyurl.com/y62frerd (PDF); Constance F. Citro and Robert T. Michael, eds., Measuring Poverty: A New Approach (National Academies Press, 1995), http://dx.doi.org/10.17226/4759; and Patricia Ruggles, Drawing the Line: Alternative Poverty Measures and Their Implications for Public Policy (Urban Institute Press, 1990).
19. Some equivalence scales have additional parameters to differentiate between the needs of additional adults and additional children, in which case the formula would be ES = 1 + (α na + γ nc), where α and γ are weights between zero and one applied to the additional number of adults and children (na and nc) in the household, respectively.
Appendix BDetails About Recovery Rebate Credits and Expanded Unemployment Compensation
The distribution of household income in 2020 was greatly affected by federal policies put in place temporarily in response to the coronavirus pandemic. The Congressional Budget Office has examined two of those policies in detail—recovery rebate credits and expanded unemployment compensation—because they had a particularly large impact.
Recovery Rebate Credits
Two recovery rebate credits were paid to households in 2020. The first credit, issued in April 2020, was up to $1,200 per qualifying adult and $500 per qualifying child for taxpayers with income below specified limits. The second credit, issued in December 2020 and January 2021, was up to $600 per qualifying adult and child. (Even though the issuance in some cases did not occur in calendar year 2020, the second credit is included in this analysis because the amount of the credit was based on the recipient’s income in 2020.) Although the federal budget counted the credits as outlays, CBO included them as part of refundable tax credits in this analysis because they were administered through the tax system.
The amount of each taxpayer’s credit was determined according to a formula. Taxpayers with adjusted gross income (AGI) below certain limits were eligible for the maximum credit. (Those limits were $75,000 for single filers, $150,000 for joint filers, and $112,500 for head-of-household filers.) The maximum credit was reduced by 5 percent of the amount by which AGI exceeded those limits.
To quickly obtain information about taxpayers’ income to determine the credit amount for which they qualified, the federal government used each taxpayer’s most recent tax return—in most cases, from 2018 or 2019. Many taxpayers who experienced changes in their income between 2018 or 2019 and 2020 received a different amount than what they would have qualified for on the basis of their 2020 income. Taxpayers who were eligible on the basis of their 2020 income but not on the basis of their prior-year income could file to receive a payment later (known as a plus-up payment). Conversely, taxpayers who were eligible on the basis of their prior-year income but not their 2020 income received a payment but were not obligated to return it—that is, they had safe harbor from repayment.
The amount of the recovery rebate credit that went to each household was not available in the underlying data CBO used for this analysis. To compute those amounts, CBO used its microsimulation tax model, which applies the rules of the tax system to calculate the tax owed by each member of a representative sample of taxpayers. That model allowed CBO to apply the eligibility formula for recovery rebate credits to the income associated with each member of its data sample for 2020.1
Expanded Unemployment Compensation
In 2020, lawmakers enacted legislation to temporarily expand unemployment compensation. The expansion took three forms.
- Pandemic Unemployment Assistance (PUA) expanded the eligibility guidelines to include people who did not qualify for regular unemployment insurance, such as self-employed workers.
- Pandemic Emergency Unemployment Compensation (PEUC) provided 13 additional weeks of compensation to people who exhausted their regular unemployment insurance benefits.
- Federal Pandemic Unemployment Compensation (FPUC) increased the benefit amount for people already receiving regular unemployment insurance or expanded benefits through PUA or PEUC by $600 per week through July 2020.
All of those benefits were funded in full by the federal government.
This analysis accounts for expanded unemployment compensation as a means-tested transfer program, even though regular unemployment insurance is accounted for as a social insurance benefit (and is therefore included in income before transfers and taxes). CBO allocated those types of unemployment benefits separately for three reasons. First, expanded unemployment compensation was the result of new legislation enacted in response to the pandemic. Second, its benefit amounts and eligibility criteria differed from those of regular unemployment insurance. Third, it was federally funded, whereas regular unemployment insurance is funded mainly by taxes collected from employers.
The payments made to households for unemployment benefits were recorded in both the Current Population Survey (CPS) and the Statistics of Income (SOI) data, which constitute the dataset that CBO uses for its distributional analyses. For this analysis, CBO made three adjustments to those data when allocating those benefits to households.
First, CBO adjusted the data to match the total unemployment benefits that were paid out according to administrative records. Although the SOI data contain information about which taxpayers received those benefits, those data cover only people who filed taxes. For people who did not file taxes, CBO used information about unemployment benefits from the CPS with a further adjustment: Because unemployment benefits were underreported in the CPS in 2020, CBO adjusted the data to allocate unemployment benefits to those nonfilers until the total in CBO’s data matched the administrative total.2
Second, CBO reduced the total amount of unemployment benefits by about 10 percent to account for improper claims, including fraudulent claims, such as those made by individuals outside the United States using stolen identities. To determine the size of that adjustment, CBO assessed the existing literature on the eligibility and receipt of unemployment claims in 2020.3
Finally, after CBO had allocated total unemployment benefits to each household in its dataset, the agency used a rule to allocate those benefits to one of two programs: pandemic-related expanded unemployment compensation or regular unemployment insurance. To make that allocation, CBO used the weekly earnings and employment data in the basic monthly versions of the CPS. Using those data, CBO simulated the rules of the two programs to estimate benefits under them for each affected individual. The agency then used those results to compute the average proportion of total unemployment benefits that came from each program according to individuals’ total earnings and applied those averages to beneficiaries in its merged dataset. In general, individuals with lower earnings received a smaller share of their unemployment benefits in regular unemployment insurance than did those with higher earnings. That is because regular unemployment insurance benefits rise with earnings, whereas a large portion of expanded unemployment compensation benefits (specifically those provided through FPUC) were the same for all recipients. On average, about three-quarters of total unemployment benefits were allocated to expanded unemployment compensation in CBO’s analysis.
1. To account for both safe-harbor payments and plus-up payments, CBO used the lesser of 2019 and 2020 income to determine the size of the credit for each taxpayer.
2. For a detailed discussion, see Jeff Larrimore, Jacob Mortenson, and David Splinter, “Unemployment Insurance in Survey and Administrative Data,” FEDS Notes (Board of Governors of the Federal Reserve System, July 2022), https://tinyurl.com/555398ke.
3. For example, see Government Accountability Office, Unemployment Insurance: DOL Needs to Address Substantial Pandemic UI Fraud and Reduce Persistent Risks, GAO-23-106586 (February 2023), www.gao.gov/products/gao-23-106586; and Eliza Forsythe, “Unemployment Insurance Recipiency During the COVID-19 Pandemic,” National Tax Journal, vol. 76, no. 2 (June 2023), pp. 367–391, https://tinyurl.com/mrx7wud7. Although some unemployment insurance benefits are paid out improperly each year, CBO usually does not adjust for those because the overall benefits are relatively small. CBO decided to adjust its total to account for improper claims in 2020 because the amount of unemployment benefits was much larger in that year than in prior years.
Appendix CDetails About Income, Transfers, and Taxes
This appendix provides details about the average household income, means-tested transfers, and federal taxes for each income group in 2019 and 2020 in the Congressional Budget Office’s analysis of the distribution of household income (see Table C-1). Those measures are shown for each quintile, or one-fifth of the distribution, as well as for smaller groups. This appendix also provides data on tax and transfer rates and on each group’s share of total income, transfers, and taxes (see Table C-2 and see Table C-3).
Table C-1.
Average Household Income, Means-Tested Transfers, and Federal Taxes, by Income Group, 2019 and 2020
2020 Dollars
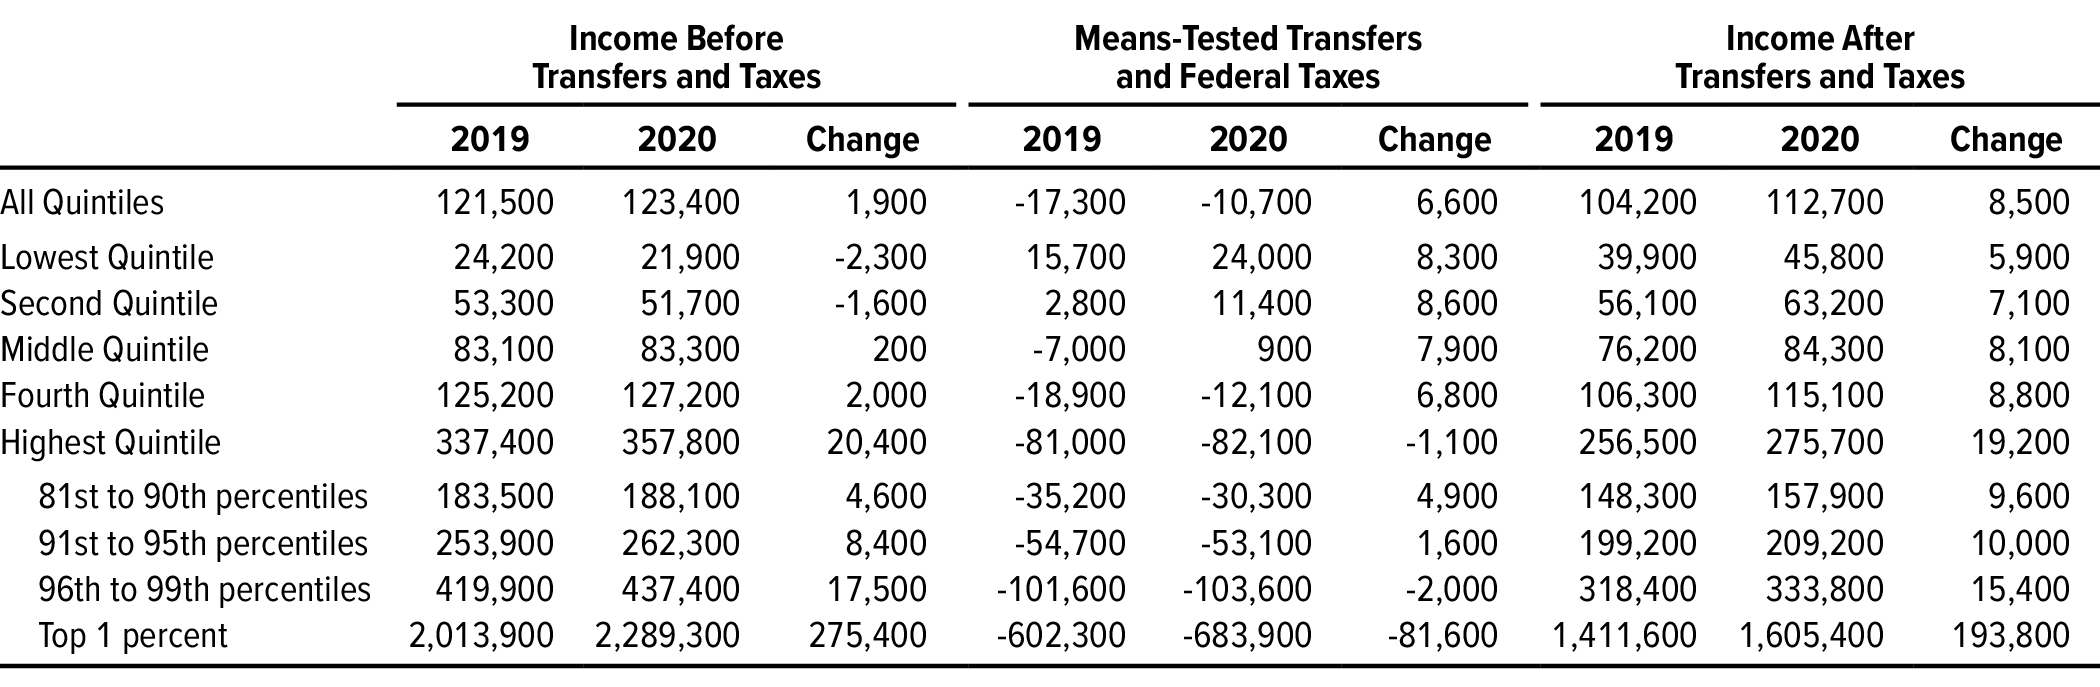
Data source: Congressional Budget Office. See www.cbo.gov/publication/59509#data.
Income before transfers and taxes is market income plus social insurance benefits. Means-tested transfers are cash payments and in-kind services provided through federal, state, and local government assistance programs for which eligibility is based primarily on income. Federal taxes consist of individual income taxes, payroll (or social insurance) taxes, corporate income taxes, and excise taxes. Income after transfers and taxes is income before transfers and taxes plus means-tested transfers minus federal taxes.
Income groups are created by ranking households by their size-adjusted income before transfers and taxes. Each quintile (one-fifth of the distribution) and each percentile (one-hundredth of the distribution) contains approximately the same number of people but different numbers of households. For information about the methods underlying this analysis, see Appendix A. For detailed definitions of income measures, see Appendix D.
Table C-2.
Average Means-Tested Transfer Rates and Federal Tax Rates, by Income Group, 2019 and 2020
Percent
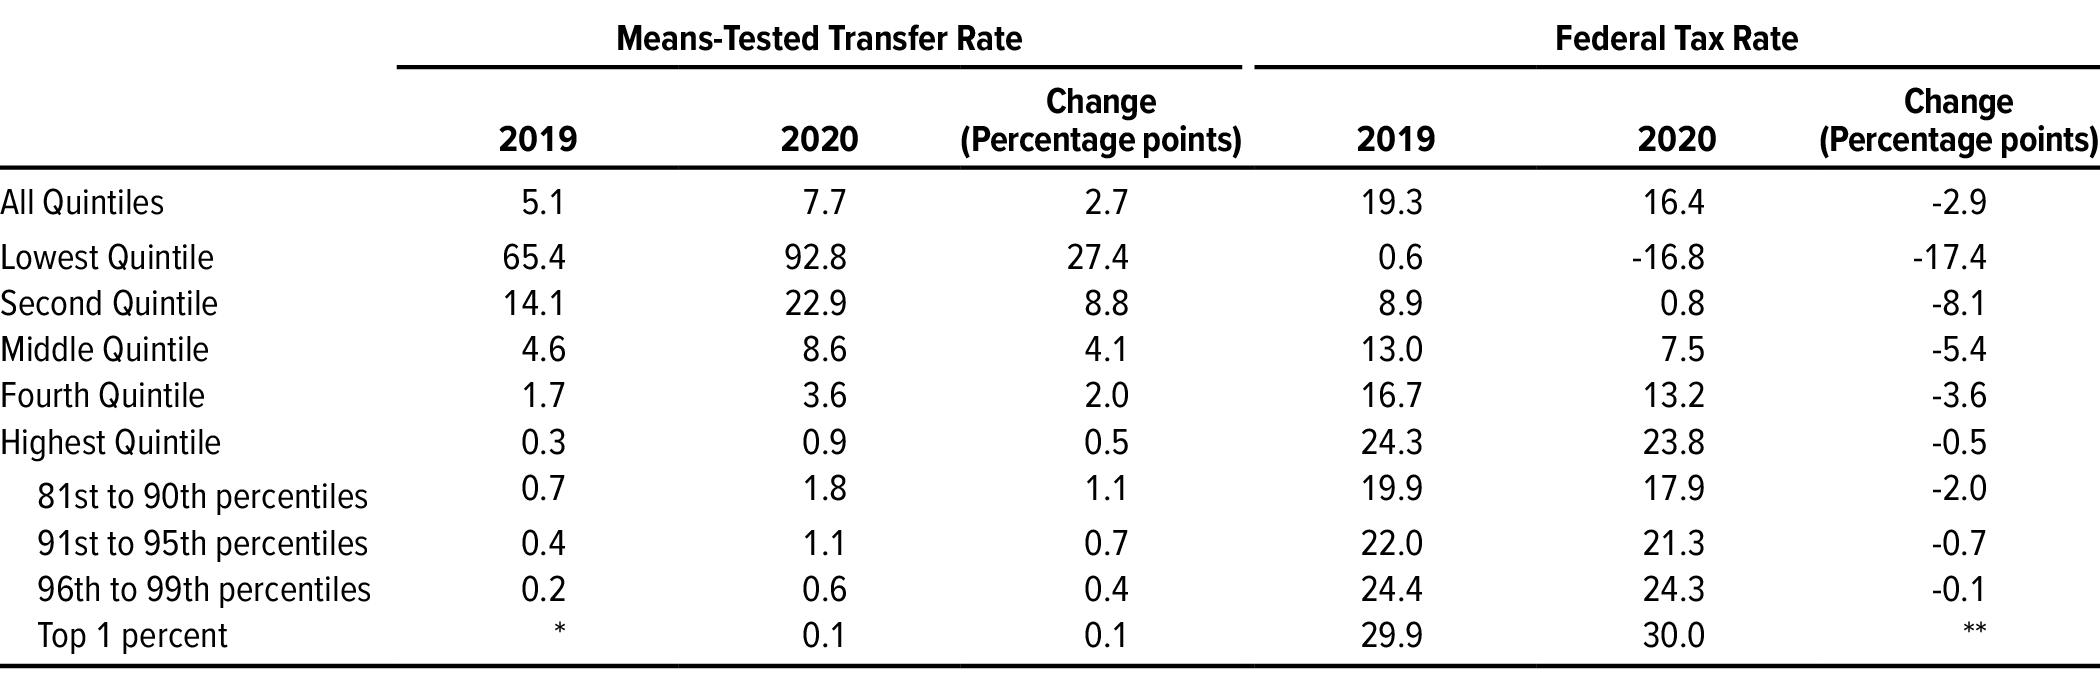
Data source: Congressional Budget Office. See www.cbo.gov/publication/59509#data.
Means-tested transfers are cash payments and in-kind services provided through federal, state, and local government assistance programs for which eligibility is based primarily on income. Average means-tested transfer rates are calculated by dividing the total means-tested transfers of each group by the total income before transfers and taxes (that is, market income plus social insurance benefits) of that group. Federal taxes consist of individual income taxes, payroll (or social insurance) taxes, corporate income taxes, and excise taxes. Average federal tax rates are calculated by dividing the total federal taxes of each group by the total income before transfers and taxes of that group.
Income groups are created by ranking households by their size-adjusted income before transfers and taxes. Each quintile (one-fifth of the distribution) and each percentile (one-hundredth of the distribution) contains approximately the same number of people but different numbers of households. For information about the methods underlying this analysis, see Appendix A. For detailed definitions of income measures, see Appendix D.
* = between zero and 0.05 percent; ** = between zero and 0.05 percentage points.
Table C-3.
Shares of Total Income, Means-Tested Transfers, and Federal Taxes, by Income Group, 2019 and 2020
Percent
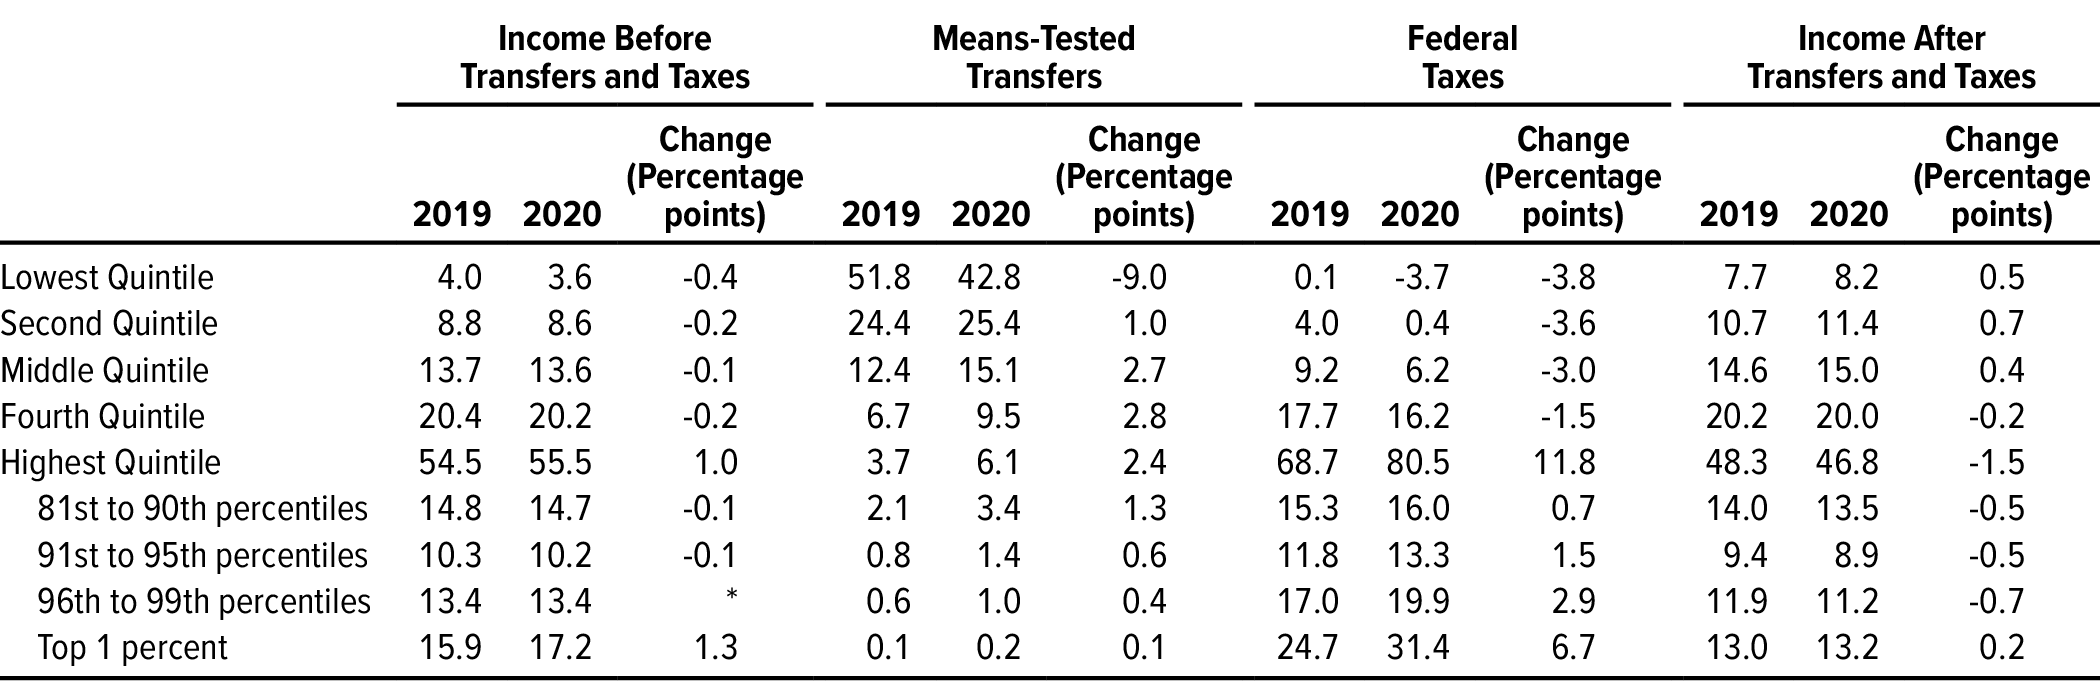
Data source: Congressional Budget Office. See www.cbo.gov/publication/59509#data.
Income before transfers and taxes is market income plus social insurance benefits. Means-tested transfers are cash payments and in-kind services provided through federal, state, and local government assistance programs for which eligibility is based primarily on income. Federal taxes consist of individual income taxes, payroll (or social insurance) taxes, corporate income taxes, and excise taxes. Income after transfers and taxes is income before transfers and taxes plus means-tested transfers minus federal taxes.
Income groups are created by ranking households by their size-adjusted income before transfers and taxes. Each quintile (one-fifth of the distribution) and each percentile (one-hundredth of the distribution) contains approximately the same number of people but different numbers of households. For information about the methods underlying this analysis, see Appendix A. For detailed definitions of income measures, see Appendix D.
* = between −0.05 percentage points and zero.
Appendix DTerms Used in This Analysis
This appendix defines the many terms used in this analysis. The terms are listed according to the formulas used to compute the various measures. Within each category, the items are ordered from largest to smallest.
Household income, unless otherwise indicated, refers to income before the effects of means-tested transfers and federal taxes are accounted for. Throughout this report, that income concept is called income before transfers and taxes. It consists of market income plus social insurance benefits.
Market income consists of the following five elements:
- Labor income. Wages and salaries, including those allocated by employees to 401(k) and other employment-based retirement plans; employer-paid health insurance premiums (as measured by the Census Bureau’s Current Population Survey); the employer’s share of payroll taxes for Social Security, Medicare, and federal unemployment insurance; and the share of corporate income taxes borne by workers.
- Business income. Net income from businesses and farms operated solely by their owners, partnership income, and income from S corporations.
- Capital gains. Net profits realized from the sale of assets (but not increases in the value of assets that have not been realized through sales).
- Capital income. Taxable and tax-exempt interest, dividends paid by corporations (but not dividends from S corporations, which are considered part of business income), rental income, and the share of corporate income taxes borne by capital owners.
- Other income sources. Income received in retirement for past services and other nongovernmental sources of income.
Social insurance benefits consist of benefits from Social Security (Old Age, Survivors, and Disability Insurance), Medicare (measured by the average cost to the government of providing those benefits), regular unemployment insurance (but not expanded unemployment compensation), and workers’ compensation.
Means-tested transfers are cash payments and in-kind services provided through federal, state, and local government assistance programs. Eligibility to receive such transfers is determined primarily on the basis of income, which must be below certain thresholds. Means-tested transfers are provided through the following programs: Medicaid and the Children’s Health Insurance Program (measured by the average cost to the federal government and state governments of providing those benefits); the Supplemental Nutrition Assistance Program (formerly known as the Food Stamp program); housing assistance programs; Supplemental Security Income; Temporary Assistance for Needy Families and its predecessor, Aid to Families With Dependent Children; child nutrition programs; the Low Income Home Energy Assistance Program; and state and local governments’ general assistance programs. For 2020, CBO included expanded unemployment compensation in means-tested transfers.
Average means-tested transfer rates are calculated as means-tested transfers (totaled within an income group) divided by income before transfers and taxes (totaled within an income group).
Federal taxes consist of individual income taxes, payroll (or social insurance) taxes, corporate income taxes, and excise taxes. Those four sources accounted for 94 percent of federal revenues in fiscal year 2020. Revenue sources not examined in this report include states’ deposits for unemployment insurance, estate and gift taxes, net income of the Federal Reserve System that is remitted to the Treasury, customs duties, and miscellaneous fees and fines.
In this analysis, taxes for a given year are the amount a household owes on the basis of income received in that year, regardless of when the taxes are paid. Those taxes comprise the following four categories:
- Individual income taxes. Individual income taxes are levied on income from all sources, except those excluded by law. Individual income taxes can be negative because they include the effects of refundable tax credits (including recovery rebate credits), which can result in net payments from the government. Specifically, if the amount of a refundable tax credit exceeds a filer’s tax liability before the credit is applied, the government pays that excess to the filer. Statutory marginal individual income tax rates are the rates set in law that apply to the last dollar of income.
- Payroll taxes. Payroll taxes are levied primarily on wages and salaries. They generally have a single rate and few exclusions, deductions, or credits. Payroll taxes include those that fund the Social Security trust funds, the Medicare trust fund, and unemployment insurance trust funds. The federal portion of the unemployment insurance payroll tax covers only administrative costs for the program; state-collected unemployment insurance payroll taxes are not included in the Congressional Budget Office’s measure of federal taxes (even though they are recorded as revenues in the federal budget). Households can be entitled to future social insurance benefits, including Social Security, Medicare, and unemployment insurance, as a result of paying payroll taxes. In this analysis, average payroll tax rates capture the taxes paid in a given year and do not capture the benefits that households may receive in the future.
- Corporate income taxes. Corporate income taxes are levied on the profits of U.S.–based corporations organized as C corporations. In this analysis, CBO allocated 75 percent of corporate income taxes in proportion to each household’s share of total capital income (including capital gains) and 25 percent to households in proportion to their share of labor income.
- Excise taxes. Sales of a wide variety of goods and services are subject to federal excise taxes. Most revenues from excise taxes are attributable to the sale of motor fuels (gasoline and diesel fuel), tobacco products, alcoholic beverages, and aviation-related goods and services (such as aviation fuel and airline tickets).
Average federal tax rates are calculated as federal taxes (totaled within an income group) divided by income before transfers and taxes (totaled within an income group).
Income after transfers and taxes is income before transfers and taxes plus means-tested transfers minus federal taxes.
Income groups are created by ranking households by their size-adjusted income before transfers and taxes. A household consists of people sharing a housing unit, regardless of their relationship. The income quintiles (or fifths of the distribution) contain approximately the same number of people but slightly different numbers of households (see Appendix A). Similarly, each full percentile (or hundredth of the distribution) contains approximately the same number of people but a different number of households. If a household has negative income (that is, if its business or investment losses exceed its other income), it is excluded from the lowest income group but included in totals.
About This Document
This report was prepared at the request of the Chairman of the Senate Committee on Finance. In keeping with the Congressional Budget Office’s mandate to provide objective, impartial analysis, the report makes no recommendations.
Bilal Habib wrote the report with guidance from Edward Harris, John McClelland, and Joseph Rosenberg. Brooks Pierce, Kurt Seibert, Naveen Singhal, and Ellen Steele contributed to the analysis. Eshika Kaul and Omar Morales fact-checked the report.
Helpful comments were provided by Christina Hawley Anthony, Meredith Decker, Richard DeKaser, Justin Falk, Jennifer Gray, Rebecca Heller, Robert Stewart, Julie Topoleski, and Chapin White (all of CBO) as well as the staff of the Joint Committee on Taxation. The assistance of external reviewers implies no responsibility for the final product; that responsibility rests solely with CBO.
Mark Doms, Jeffrey Kling, and Robert Sunshine reviewed the report. Christine Bogusz edited it, and Casey Labrack created the graphics and prepared the text for publication. The report is available at www.cbo.gov/publication/59509.
CBO seeks feedback to make its work as useful as possible. Please send comments to communications@cbo.gov.

Phillip L. Swagel
Director
November 2023