
At a Glance
As the climate continues to change, flood damage to homes in the United States is expected to increase. Many of those homes have mortgages that are guaranteed by a government-sponsored enterprise or backed by the Department of Veterans Affairs or the Federal Housing Administration. When homes sustain flood damage, homeowners may change their decisions about if and when to repay their mortgage, and the federal government is exposed to those changes through its mortgage guarantee programs.
In this report, the Congressional Budget Office estimates how much flood damage homes with federally backed mortgages are expected to face in two multiyear projection periods, one centered on 2020 and the other centered on 2050. Unless otherwise noted, CBO’s damage estimates use a central climate change projection. The key conclusions are the following:
- Expected Annual Damage (EAD). In the 2020 projection period (which generally captures current climate conditions), homes with federally backed mortgages face EAD of $9.4 billion, CBO estimates. That amount would rise by about one-third to $12.8 billion (in 2020 dollars) in the 2050 projection period if all factors other than the climate remained unchanged. Under a lower climate change projection, EAD in the 2050 period is $10.2 billion; under a higher one, EAD is $16.1 billion.
- Total Expected Damage Over a 30-Year Period. To illustrate how expected flood damage over many years of ownership would compare with the property value, CBO calculated the present value of experiencing EAD each year for 30 years. The total expected damage over a 30-year period to homes with federally backed mortgages rises from $190 billion (in present-value terms) in the 2020 period to $258 billion in the 2050 period.
- Flood Damage and Property Values. Properties accounting for about 7 percent of the total value of properties with federally backed mortgages face a risk of flood damage each year in the 2020 period. Among those homes, the total expected damage over 30 years is about 14 percent of the total property value. Among all homes with federally backed mortgages, that share is 1 percent.
- Location of Flood Damage. In both periods, about 40 percent to 50 percent of flood damage occurs outside of areas designated as special flood hazard areas by the Federal Emergency Management Agency, CBO estimates. More than half of all expected damage to homes with federally backed mortgages is in coastal areas. The top 10 counties in terms of EAD account for more than one-quarter of EAD nationwide.
Expected flood damage is small relative to total property value, but the potential exposure of mortgages to flood risk varies significantly within the country. Expected damage is concentrated in certain geographic areas, such as the Atlantic and Gulf Coasts, where it may be large relative to property values. Almost half of expected damage to homes with federally backed mortgages is located in areas where homeowners are not required to carry flood insurance. Moreover, fees for mortgage guarantees do not vary by the amount of flood risk.
Notes
All years referred to in this report are calendar years.
Numbers in the text and exhibits may not add up to totals because of rounding.
Unless otherwise noted, estimates of flood damage use a projection of climate change that is in the center of a distribution of possible outcomes.
All values are expressed in 2020 dollars.
The flood model used in this report generates projections of flood risk in two different projection periods, one centered on 2020 and one on 2050. For the 2050 period, estimates of flood damage account only for changes in flood risk. The underlying housing stock, housing values, flood protection infrastructure, insurance prices, population, and economic variables are fixed at their 2020 levels. For more details on terminology, see Appendix A; for details on the data and CBO’s method, see Appendix B.
As a result of climate change’s effects on sea levels, storms, and precipitation patterns, the risk of flood damage—that is, the monetary damage to structures caused by flooding—is expected to increase in the United States. In this report, the Congressional Budget Office examines the extent of flood damage to single-family homes—typically, detached properties with one to four residential dwelling units, excluding condominium units in multifamily structures—under projected flood risk in two different periods. (Flood risk is the likelihood that a given property will flood to any depth.) The agency also analyzed where that damage is concentrated.
When homes are damaged by flooding, homeowners with mortgages may change their repayment behavior, resulting in changes to defaults, foreclosures, and early repayments, collectively referred to as mortgage performance. The federal government supports most of those mortgages through guarantees offered by Fannie Mae and Freddie Mac, which are government-sponsored enterprises (GSEs); the Federal Housing Administration (FHA); and the Department of Veterans Affairs (VA). In doing so, the federal government is exposed to changes in mortgage performance. Estimates of flood damage do not quantify the extent of that exposure—households would shoulder much of the cost through uninsured repairs and insurance deductibles. However, by reflecting the overall risk of flood damage to properties with federally backed mortgages, the estimates provide a broad picture of the exposure the federal government could face if homeowners changed their repayment behavior in response to flood damage.
The model used in this report to project flooding generates projections for time periods rather than specific years, and each projection period is centered on a year. Those projections are centered on 2020 and 2050 and were generated for a single emissions scenario that corresponds to a median increase in global average temperature of 1.2 degrees Celsius and a median increase in average sea level of 23 centimeters (or about 9 inches) by 2050 relative to the averages over the 1986–2005 period.1 The 2020 projection period generally captures current climate conditions. For the 2050 period, CBO’s estimates account only for changes in flood risk. The underlying housing stock, housing values, flood protection infrastructure, insurance prices, population, and economic variables are fixed at their 2020 levels. (For explanations of the terminology used in this report, see Appendix A; for details about the data and CBO’s method, see Appendix B.)
Federal Mortgage Programs
The federal government supports housing finance in a variety of ways. One way is by guaranteeing home mortgages through programs such as FHA’s mutual mortgage insurance program, which mainly serves low-income participants, and VA’s mortgage guarantee program, which is generally available to veterans. (By guaranteeing mortgages, the federal government insures lenders against borrowers’ default.) Those programs do not require a large down payment. A second way is by backing GSEs that take on the risk of mortgage default so that the Treasury effectively covers the costs of worsened mortgage performance. (Fannie Mae and Freddie Mac are in federal conservatorships and are controlled by the Federal Housing Finance Agency, their conservator, and by the Treasury, which has ownership rights to a majority of their stock.) Other smaller federal programs back mortgages, such as the one operated by the Department of Agriculture’s Rural Housing Service, but CBO did not include them in this analysis because data for those programs are limited. Among the GSEs, FHA, and VA, the federal government backed $7.5 trillion of mortgage debt in 2020.
The major federal guarantors earn income by charging guarantee fees to lenders, and they make payments to lenders when guaranteed mortgages are foreclosed or modified. The programs differ in amounts of outstanding mortgage debt, lending practices, eligible homebuyers, and the nature of support; as a result, the geographic distribution of their portfolios differs.
Mortgages in the programs also differ in the typical size of the loan as a percentage of the total sale price, which is known as the loan-to-value ratio (LTV). If borrowers with higher LTV mortgages experience flood damage or another negative economic event, the value of the home is more likely to fall below the amount of debt owed, potentially leading to default.
Mortgages for Single-Family Homes in 2020
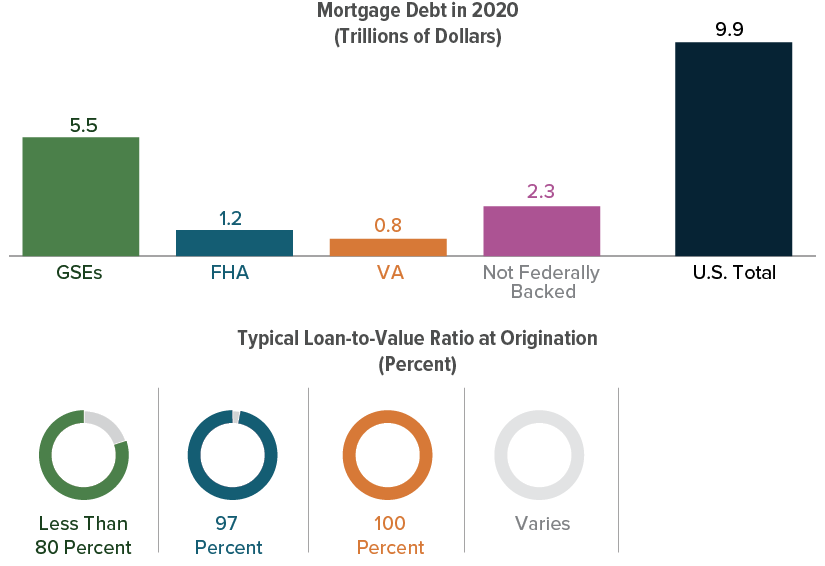
Overall, federally backed mortgages accounted for about three-quarters of outstanding mortgage debt for single-family homes in 2020. GSEs backed more than half of that debt.
Loans backed by the GSEs tend to have a lower LTV ratio at origination than do FHA and VA loans because the former require a larger down payment. Thus, borrowers with GSE guarantees are less likely to default as a result of having negative equity after incurring flood damage.
How Natural Disasters Affect the Performance of Federally Backed Mortgages
The performance of mortgages might change in the aftermath of natural disasters, such as floods. The damage and the economic disruption, as well as any insurance claims and aid associated with the disaster, could affect borrowers’ ability or willingness to remain current on or prepay their mortgages.2 Mortgage lenders and guarantors often offer forbearance and loan modification programs after major disaster declarations. They might also institute a moratorium on foreclosures.
Changes in mortgages’ performance affect the payments and receipts of guarantors. When mortgages are foreclosed or, in some cases, modified, the guarantor must pay the claims of the lender or servicer if that lender or servicer adhered to the guarantor’s terms. When borrowers pay off their mortgages early, the GSEs and FHA lose a future stream of income from guarantee fees, but they also avoid potential future costs of nonperformance. (The guarantee fee for a VA mortgage is a onetime payment made when the mortgage is originated, so it is unaffected by prepayment.)
But guarantors of federally backed mortgages in areas facing a greater risk of flood damage do not charge guarantee fees that reflect the cost of flood-related changes in performance. Guarantee fees compensate the guarantor for assuming risk. Those fees are paid by lenders and passed on to borrowers through higher interest rates. However, because guarantors do not vary those fees on the basis of flood or other disaster risk, any difference in the expected cost of default will not be borne by borrowers through interest rates if their loans are likely to be federally backed. The resulting lower interest rates encourage home purchases in riskier areas.
Flood insurance reduces the exposure of guarantors to risk from flood damage, but many homes do not have coverage. Outside of the Federal Emergency Management Agency’s (FEMA’s) Special Flood Hazard Areas (SFHAs), flood insurance is uncommon. Additionally, although homeowners with federally backed loans in SFHAs are required to carry flood insurance, it is not clear how well that requirement is enforced.3 (If a borrower in an SFHA defaults and the servicer did not enforce the insurance requirement, the servicer is liable.)4
As climate change raises the risk of flood damage in the United States, the federal government’s exposure to that risk through its mortgage guarantees is likely to increase as well. To the extent that it currently affects mortgage performance, flood damage is reflected in the average losses caused by defaults in federal mortgage programs. However, if increased exposure to flood risk further affected performance of federally backed mortgages, the associated programs would either absorb the costs or adjust guarantee fees accordingly.
In the long run, the full extent of flood damage (or the cost of insuring against that damage) could be reflected in housing values if risk awareness and perceptions changed accordingly. Borrowers could face rapid reductions in the value of their homes; those reductions could outpace growth in housing values that would otherwise occur, leading some homeowners’ equity to become negative, which would increase their likelihood of default.
Expected Annual Damage From Flooding to Homes With Federally Backed Mortgages
CBO estimated expected annual damage (EAD) from flooding to homes with outstanding mortgage debt (as of the end of 2020) given their flood risk in each of the projection periods. EAD is the monetary damage—including that covered by insurance—that a home would incur in a year, on average, over many years of exposure to a given profile of flood risk. (See Appendix B for more details about how CBO calculated EAD.) In addition to estimating EAD under a central climate change projection, the agency estimated it under more and less severe projections of climate change.
Expected Annual Damage
The total EAD for all mortgaged homes is estimated to increase by more than one-third between the two projection periods because of changes in flood risk. That increase only reflects the effects of climate change on flooding; all other relevant factors are fixed at their 2020 condition.
Expected Annual Damage From Flooding
Billions of 2020 Dollars
The EAD from flooding to homes with mortgages backed by the GSEs, FHA, and VA totals $9.4 billion in 2020. It is projected to increase by 36 percent to $12.8 billion in the 2050 period.
Expected Annual Damage Under Different Climate Change Projections
CBO’s main estimates in this report use projections of flood risk from the First Street Foundation (FSF).5 CBO’s estimates incorporate median flood risk—that is, the 50th percentile of flood risk—projected on the basis of the International Panel on Climate Change’s (IPCC’s) 21 global climate models analyzing an intermediate emissions scenario known as representative concentration pathway (RCP) 4.5.
If the climate responded differently to that emissions scenario, flood risk would probably be different as well. Therefore, CBO also estimated damage under the 25th and 75th percentile of projected flood risk. For flood risk projections through 2050, the 25th and 75th percentile of projections under RCP 4.5 are similar to the median projections under RCP 2.6 (a low-emissions scenario) and RCP 8.5 (a high-emissions scenario).
FSF’s flood model combines historical data on observed water levels in recent decades with a model of climate conditions as of 2020. Thus, the estimated EAD in the 2020 period is sensitive to the climate model used to estimate those conditions.
Total Expected Annual Damage to Homes With Federally Backed Mortgages Under Different Climate Projections
Billions of 2020 Dollars
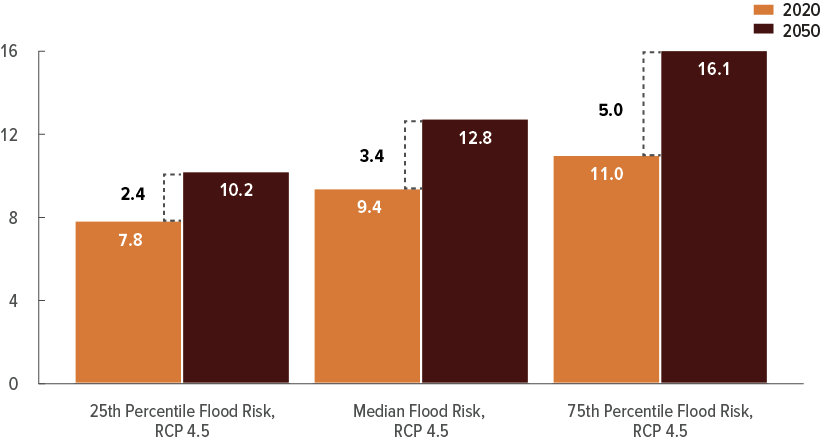
If the climate responded differently to the emissions scenario, precipitation patterns, tropical cyclone activity, and sea levels would also be different. As a result, relative to the main estimates, EAD in 2050 is about 20 percent lower in the 25th percentile case and roughly 25 percent higher in the 75th percentile case.
Change in Expected Annual Damage Under Different Climate Change Projections
Although EAD under the 2020 and 2050 climate conditions moves in the same direction as the climate projection varies, the difference in EAD between the two years is larger for the more severe climate projections.
Change in Expected Annual Damage Under Different Climate Projections
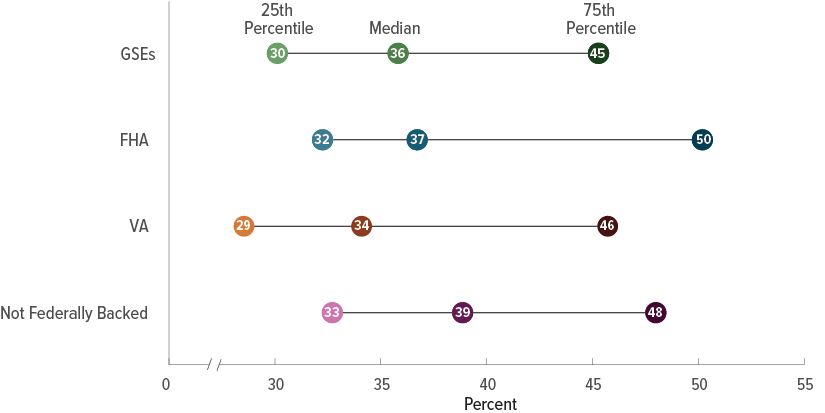
The change in EAD from 2020 to 2050 under all three climate outcomes is similar for the different sources of federal mortgage guarantees.
The increase in EAD from 2020 to 2050 ranges from 29 percent to 33 percent under the 25th percentile outcome, from 34 percent to 39 percent under the median outcome, and from 45 percent to 50 percent under the 75th percentile outcome.
Present Value of Expected Damage From Flooding
EAD is incurred annually, like maintenance costs or property taxes. By contrast, expected flood damage accrued over many years is more easily compared with a home’s market valuation at a point in time. To illustrate how expected flood damage over many years of ownership would compare with the property value, CBO calculated the present value of experiencing the EAD each year for 30 years.6 The present value was calculated using a market-based discount rate of 3 percent to convert future dollars of damage into present-day dollars; the 30 years of damage were then totaled. (See Appendix B for more discussion of the discount rate.) CBO’s comparisons of the present value of damage under 2050 climate conditions with property values do not reflect potential reactions to changes in flood risk in the housing or insurance markets.
Present Value of Damage to Homes
Billions of 2020 Dollars
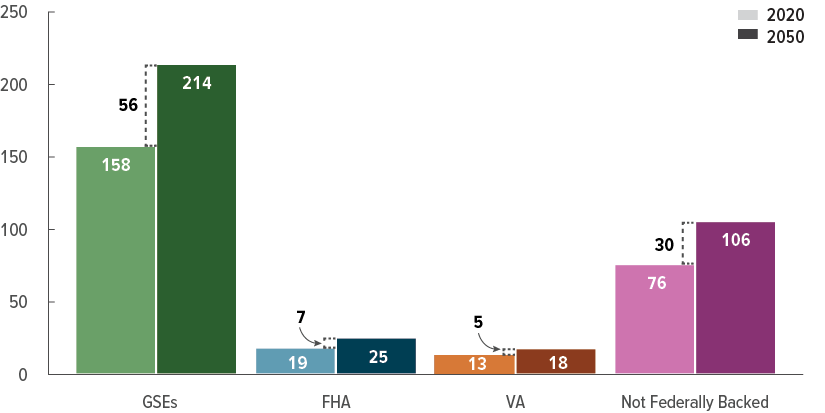
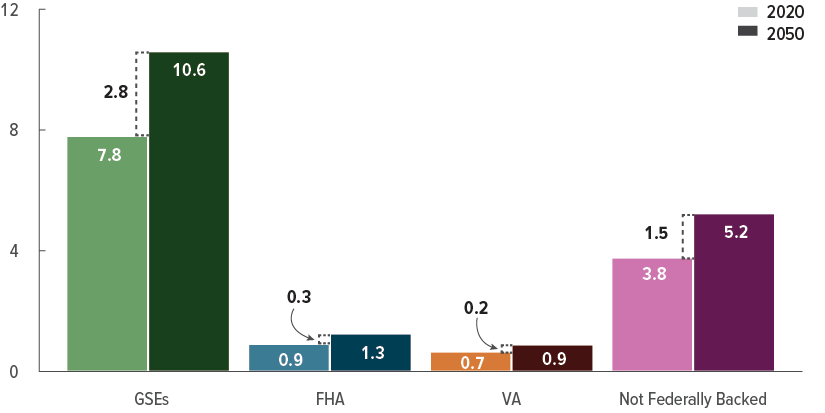
The present value of 30 years of expected flood damage for homes with mortgages backed by the GSEs, FHA, or VA totals $190 billion in the 2020 period. That value increases by 36 percent, to $258 billion, in the 2050 period.
Most of the present value of expected damage in both periods is attributable to homes with mortgages backed by the GSEs.
Increasing Flood Risk and Housing Markets
Changes in flood risk or perceptions of flood risk can affect housing markets, but research has found that house prices reflect only some of the expected cost of future flood damage.7 Some analysts have raised the concern that as flood risk evolves, perceptions of that risk will not increase at the same rate. That is, in the aftermath of a major flood, homeowners in surrounding areas could make decisions that were more responsive to flood risk even though the underlying risk remained the same. If they did, or if the cost and availability of hazard insurance abruptly changed in response to increased flood risk brought about by climate change, some homes could face rapid devaluation. However, recent increases in property values have lowered existing borrowers’ loan-to-value ratios, which would make those borrowers more resilient to a flood event or broader decrease in housing values.
Present Value of Damage Compared With Property Value
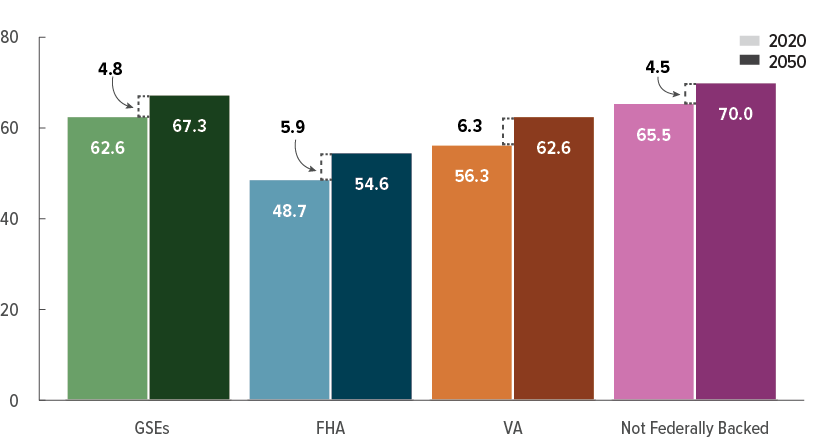
The risk of flood damage is concentrated in a subset of mortgages, and the present value of expected damage is relatively small when compared with total property value. CBO estimates that in the 2020 period, roughly 7 percent of the total property value associated with federally backed mortgages faces a 1 in 500 chance or greater of flood damage each year. Among those homes, the present value of expected damage is about 14 percent of the total property value. By comparison, the present value of damage is about 1 percent of the total property value among all homes with federally backed mortgages.
Present Value of Damage as a Share of Property Value for Homes at Risk of Flood Damage
Percent

Of the federal programs, mortgages guaranteed by VA face the greatest exposure relative to property value among homes with risk of flood damage.
Among homes that are exposed to some risk of flood damage, the present value of expected damage as a share of property value increases by between 3 percentage points and 4 percentage points from the 2020 period to the 2050 period.
Special Flood Hazard Areas and Flood Damage
SFHAs, which FEMA defines as areas that have an annual chance of flooding of at least 1 percent, directly affect housing and mortgage markets in several ways. First, any home with a federally backed mortgage in those areas is legally required to carry flood insurance. However, compliance is imperfect, as some homeowners let their coverage lapse over time, and some homes may be underinsured. Second, SFHAs are used to manage floodplains and define building codes. Third, many states require that sellers disclose whether their property lies in an SFHA when an offer is made.
Not all areas at risk of flood damage are located within an SFHA. SFHAs do not include areas with an annual chance of flooding of less than 1 percent, nor do they account for flooding from heavy precipitation or incorporate future changes in flood risk. They may also have outdated boundaries. (Those boundaries will probably change as the climate continues to change, but the estimates in this report use current SFHA boundaries.)
Relative to people who own homes inside an SFHA, people with homes outside the SFHAs are much less likely to carry flood insurance, and those homes may be less resilient to flooding. Additionally, those people may be less aware of flood risk because the risk was not disclosed or because they mistakenly thought that only homes in SFHAs were at risk of flooding.
Share of Expected Annual Damage Accounted for by Homes Outside Special Flood Hazard Areas
Percent

Homes not within current SFHAs account for about 40 percent to 50 percent of expected annual damage in both projection periods.
A larger share of EAD is located outside current SFHAs for FHA and VA loans than for GSE-backed loans and non-federally backed loans.
The Geographic Distribution of Damage to Homes With Federally Backed Mortgages
Projected flood damage is different for properties in coastal areas than it is for those located inland because those in coastal areas are exposed to different sources of flooding, such as storm surge and tidal flooding. Because the locations of mortgaged properties vary between the different mortgage programs, their share of damage incurred in coastal areas also varies. For example, the share of damage to homes with mortgages backed by the GSEs in coastal areas is larger than the share of damage to homes with FHA-guaranteed mortgages in those areas.
Flood risk increases for both coastal and inland areas over the two projection periods. Expected damage in coastal areas increases by a greater percentage, so the share of damage in those areas is larger in the later projection period.
Share of Expected Annual Damage Accounted for by Homes in Coastal Areas
Percent
In the 2020 projection period, homes in coastal areas account for much of the damage to homes with mortgages. The share ranges from 49 percent for homes with FHA-guaranteed mortgages to 66 percent for homes with mortgages that are not federally backed.
For federally backed mortgages, that share increases by roughly 5 or 6 percentage points in the 2050 period because increases in coastal flood risk outweigh smaller increases inland.
Expected Annual Damage by County
EAD to homes with federally backed mortgages is concentrated in a small set of counties. Many of those counties have large total property value, and they tend to be located on or near the coasts. The 100 counties (out of more than 3,000 counties) with the greatest EAD face a larger-than-average risk of flood damage relative to property value: They account for 72 percent of total EAD but only 38 percent of total property value.
Expected Annual Damage From Flooding to Homes With Federally Backed Mortgages in the 2020 Period
2020 Dollars
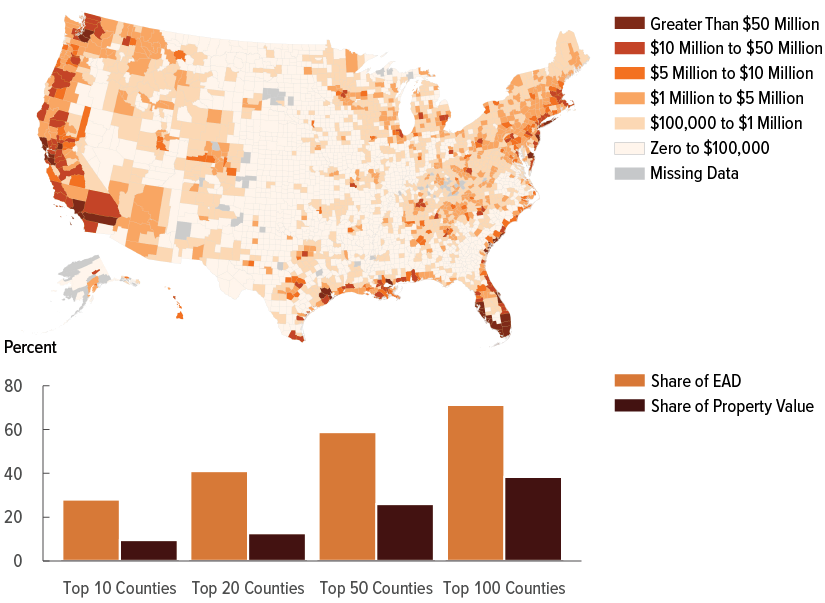
Damage is concentrated in coastal areas with large populations, high housing values, and moderate to high risk of flood damage.
The 10 counties with the most expected damage account for more than one-quarter of the EAD associated with federally backed mortgages but only 10 percent of total property value with federally backed mortgages.
Present Value of Damage Compared With Property Value by County
Some counties face a high risk of flood damage as a share of property value. Some of those are counties located in coastal areas; others are counties with small populations located in flood-prone inland areas. For instance, flood damage as a share of property value is high in the Appalachian region because property values are relatively low, the hilly terrain concentrates flooding in small waterways, and many homes are built on relatively narrow floodplains.
A county containing many homes with no expected flood damage could have a low ratio of damage to property value, even if some individual homes faced high expected flood damage.
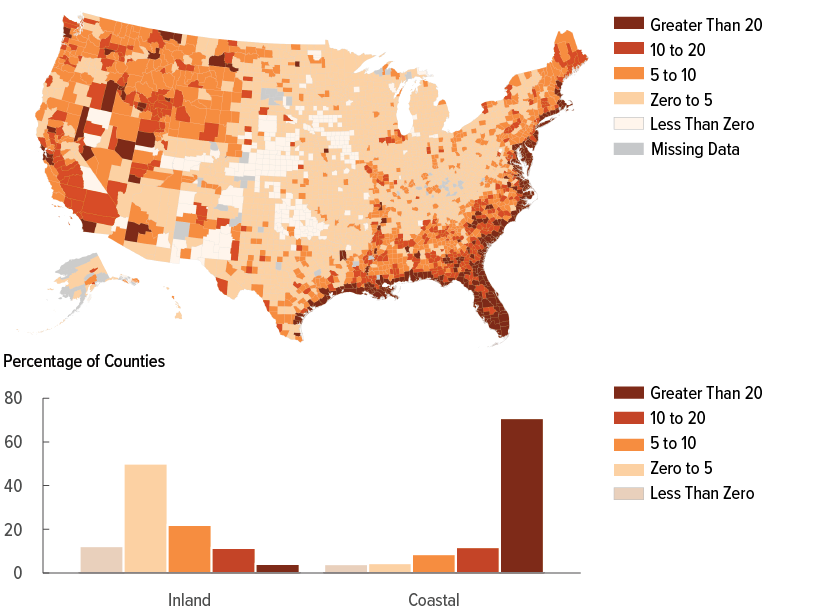
Present Value of Flood Damage to Homes With Federally Backed Mortgages as a Percentage of Total Property Value in the 2020 Period
Percent
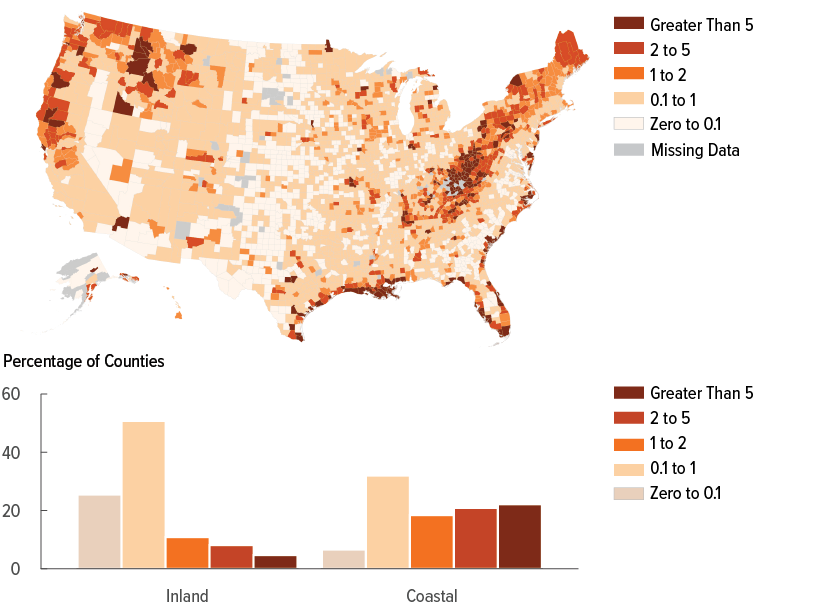
The present value of flood damage as a percentage of total property value among homes with federally backed mortgages is highest in some coastal counties and in inland counties in Idaho and Appalachia.
Over 20 percent of coastal counties face a present value of flood damage to property with a federally backed mortgage that is greater than 5 percent of the total value of that property.
Change in Expected Annual Damage by County
The change in EAD between the two projection periods varies by location. The increases are concentrated in the southern and eastern parts of the United States and are primarily driven by the increased intensity of tropical cyclones and the slower speed at which they will cross the Gulf of Mexico and Southeast Atlantic coast in the 2050 projection period.
Total Increase in Expected Annual Damage to Homes With Federally Backed Mortgages, by County
Percent
Homes with federally backed mortgages near the Gulf of Mexico or the Atlantic Ocean are expected to see the largest increases in damage.
Over three-quarters of coastal counties are expected to see EAD increase by 20 percent or more.
Uncertainty in and Limitations of CBO’s Estimates
CBO’s estimates are subject to three main sources of uncertainty. First, projections of flood risk and flood damage contain several uncertain elements. Modeling flood risk at fine spatial scales is difficult.8 The depth-damage models that translate flood depths into monetary damage necessarily summarize a wide range of observed and modeled outcomes.9 The relationships between global climate change and smaller-scale changes in sea level rise, precipitation patterns, and tropical cyclone activity are also uncertain. Additionally, current flood risk is based on a combination of historical event data and modeling that depends on current climate conditions.
Second, there is great uncertainty about how the climate will change over the next 30 years. Estimates of damage in the 2050 projection period depend on the expected trajectory of global temperatures. That trajectory is determined by future trends in greenhouse gas emissions as well as climate models that translate those trends into changes in climate. The amount of emissions depends on many factors, such as population growth, economic growth, future policies of the United States and other nations, and technological change, all of which are difficult to project.
Climate models also differ in how they translate greenhouse gas emissions into changes in climate. The three climate scenarios presented in this report illustrate some of the uncertainty in temperature change and sea level rise by considering different climate models under the same emissions pathway, but they do not reflect the full range of possible, though less likely, outcomes.
Third, uncertainty exists in how the 2020 distribution of mortgages is modeled. CBO modeled the geographic distribution of mortgage debt across census tracts using data on mortgage performance from the National Mortgage Database (NMDB) and mortgage originations from the Home Mortgage Disclosure Act (HMDA). (See Appendix B for more information about how CBO modeled mortgage distribution.) Because the NMDB and the HMDA do not reflect the precise location of mortgages, the associated expected flood damage is imperfectly measured. (The NMDB reports data by county, whereas the HMDA reports data for census tracts.) In CBO’s modeling approach, homes within each census tract face the same average risk of flood damage regardless of whether the home has a mortgage backed by any particular federal program. Homes with mortgages could face systematically higher or lower risks of flood damage than the average home in the corresponding census tracts. Further, while the HMDA data include the vast majority of mortgage originations, coverage is more complete in urban and suburban areas than in rural areas.10
In addition, the estimates of damage in the 2050 projection period hold many factors—economic, demographic, and behavioral—constant at their 2020 levels, even though they most likely will change over time. For example, future growth in population and in coastal development will be important drivers of total damage in the future.11 Housing prices could fall in areas with high flood risk, which would discourage additional risky investment, but the opposite could also happen. Further, lenders and guarantors could change their underwriting practices. Adaptation through investment in protection infrastructure or retreat from risky areas could reduce the damage. Flood risk modeling suggests that the current boundaries underestimate the areas subject to a 1 percent annual chance of flooding, and the boundaries of and policies connected to SFHAs could change if FEMA addressed those underestimations.
1. T. F. Stocker and others, eds., Climate Change 2013: The Physical Science Basis, Contribution of Working Group I to the Fifth Assessment Report of the Intergovernmental Panel on Climate Change (Cambridge University Press, 2013), Annex II: Climate System Scenario Tables, Tables AII.7.5 and AII.7.7, www.ipcc.ch/report/ar5/wg1/. CBO did not have access to flood risk modeling based on the most recent IPCC climate scenarios; see Appendix B for more discussion.
2. A growing number of studies examining outcomes following hurricanes find this to be the case. See, for example, Carolyn Kousky, Mark Palim, and Ying Pan, “Flood Damage and Mortgage Credit Risk: A Case Study of Hurricane Harvey,” Journal of Housing Research, vol. 29, no. S1 (November 2020), pp. S86–S120, https://doi.org/10.1080/10527001.2020.1840131.
3. Evidence on enforcement is mixed. See, for example, Department of Housing and Urban Development, Office of Policy Development and Research, Flood Insurance Coverage of Federal Housing Administration Single-Family Homes (prepared by 2M Research, November 2020), https://tinyurl.com/ybrfm734; and Government Accountability Office, National Flood Insurance Program: Congress Should Consider Updating the Mandatory Purchase Requirement, GAO-21-578 (July 30, 2021), www.gao.gov/products/gao-21-578.
4. Because the National Flood Insurance Program limits building coverage to $250,000 and the market for private supplemental coverage is limited, some homes that meet the requirement may still be underinsured. The federal programs would be liable for any resulting default costs.
5. First Street Foundation, First Street Foundation Flood Model (FSF-FM): Technical Methodology Documentation, version 3.0 (July 31, 2023), https://firststreet.org/methodology/flood/.
6. A present value is a single number that expresses a flow of current and future income or payments in terms of an equivalent lump sum received or paid at a specific time.
7. Jesse D. Gourevitch and others, “Unpriced Climate Risk and the Potential Consequences of Overvaluation in US Housing Markets,” Nature Climate Change, vol. 13 (2023), pp. 250–257, https://doi.org/10.1038/s41558-023-01594-8.
8. Congressional Budget Office, Communities at Risk of Flooding (September 2023), www.cbo.gov/publication/58953.
9. Oliver E. J. Wing and others, “New Insights Into US Flood Vulnerability Revealed From Flood Insurance Big Data,” Nature Communications, vol. 11 (March 2020), https://doi.org/10.1038/s41467-020-15264-2.
10. Kevin Johnson and Richard M. Todd, The Value of HMDA Coverage of Home Lending in Rural Areas and Indian Country, Center for Indian Country Development Working Paper 2019-04 (Federal Reserve Bank of Minneapolis, July 2019), https://tinyurl.com/5ysf5c7v; and Neil Bhutta, Steven Laufer, and Daniel R. Ringo, “Residential Mortgage Lending in 2016: Evidence From the Home Mortgage Disclosure Act Data,” Federal Reserve Bulletin, vol. 103, no. 6 (November 2017), www.federalreserve.gov/publications/2017-bulletin.htm.
11. Congressional Budget Office, Potential Increases in Hurricane Damage in the United States: Implications for the Federal Budget (June 2016), www.cbo.gov/publication/51518.
Appendix AGlossary
Average annual loss (AAL). The expected damage to a property in any given year from flooding, expressed as a percentage of the value of the structures on that property.
Census block group. A statistical subdivision of a census tract. It generally contains between 600 and 3,000 people living in 240 to 1,200 residential units. A block group is the smallest geographic unit for which the Census Bureau tabulates sample data. Block groups reflect largely homogeneous economic, demographic, and housing characteristics.
Census tract. A statistical subdivision of a county. Tract boundaries normally follow visible features, but in some cases may follow legal geographic boundaries and other nonvisible features. Census tracts generally contain between 1,200 and 8,000 people living in 480 to 3,200 housing units.
Coastal area. Located within a census tract that meets two criteria: One, the tract is in a county on the country’s saltwater coast; and two, it consists partly of water. Thus, coastal areas in this analysis either lie on one of the country’s saltwater coasts or are located in a county on the coast and contain at least part of another body of water, such as a river or a lake.
Expected annual damage (EAD). The yearly damage to structures on a given property when averaged over many years for a given profile of flood risk, measured in dollars.
Expected flood damage. The flood damage to structures on a given property over a given period of time, when averaged over many years, measured in dollars.
Flood damage. The monetary damage to structures on a property caused by flooding.
Flood risk. The likelihood that a property will experience a flood. A given likelihood is tied to a specific depth of flooding; combined, those likelihoods make up the property’s profile of flood risk.
Government-sponsored enterprises (GSEs). Certain corporate entities created by the Congress; in this report, they refer specifically to Fannie Mae and Freddie Mac. They have been in federal conservatorship since September 2008. The Congressional Budget Office treats the two GSEs as government entities in in its budget estimates because, under the terms of the conservatorships, the federal government retains operational control and effective ownership of Fannie Mae and Freddie Mac.
Home or single-family home. A detached property with one to four residential dwelling units, excluding condominium units within larger multifamily structures.
Loan-to-value ratio (LTV). The mortgage amount divided by the appraised value of a property.
Special Flood Hazard Area (SFHA). An area with a 1 percent or higher annual chance of flooding to any depth as defined by the Federal Emergency Management Agency.
Structure value. The value of the physical structure of a home. It does not include the value of the underlying land.
Appendix BAnalytic Methods
The Congressional Budget Office estimated the expected flood damage to homes with federally backed mortgages by combining data on mortgage originations, mortgage performance, land value, locations of residential structures, and the expected flood damage as a share of structure value. Expected annual damage (EAD) was computed by applying the average exposure to flood damage of properties within a census tract to the value of structures with federally backed mortgages within that tract.
Modeling Flood Risk and the Effects of Climate Change
The Intergovernmental Panel on Climate Change (IPCC) identified several warming scenarios known as representative concentration pathways (RCPs) in its fifth assessment report.1 First Street Foundation (FSF) generated flood risk projections for one of those scenarios, RCP 4.5, which is an intermediate warming scenario. In that scenario, the median global average temperature increase was 1.2 degrees Celsius by 2050 relative to the average over the 1986–2005 period, or 1.9 degrees Celsius relative to the average over the 1850–1900 period. (The median average temperature increase was determined by the IPCC using the 21 climate models in its report.)2
FSF combines historical data on observed water levels from 1980 to 2017 with climate modeling from the IPCC’s fifth assessment to project flood depths for 144 million properties, each of which is matched to its block group in the census. Its flood projections cover two multiyear periods, one centered on 2020 and one on 2050. (Flood projections are not generated for specific years but rather for ranges of years; the projection period is identified by the year that falls in the middle of the period.) CBO had access to three different projections of flood risk based on RCP 4.5. They represent the 25th, 50th (median), and 75th percentile of flood risk outcomes among the 21 climate models.
Unless otherwise specified, the estimates presented in this report are based on the median flood risk under RCP 4.5. The climate projections underlying FSF’s flood model reflect changes in sea level, precipitation patterns, and tropical cyclone patterns. The flood damage estimates reflect tidal flooding, storm surge, riverine flooding, and flooding caused by heavy precipitation but not by an overflowing body of water. They also incorporate a large, though still incomplete, database of protective infrastructure.
CBO’s estimates of flood damage in the 2050 projection period reflect changes in flood risk. The underlying housing stock, housing values, flood protection infrastructure, insurance prices, population, and economic variables are held constant at their 2020 levels.
Estimating the Locations of Properties With Federally Backed Mortgages
CBO used several data sources to model the 2020 portfolios of single-family mortgage programs and their distribution across census tracts. Mortgage programs and data sources typically classify single-family homes as detached properties with one to four residential dwelling units.3 In 2020, debt associated with mortgages for single-family homes represented 90 percent of mortgage debt back by the Federal Housing Administration (FHA) and 93 percent of mortgage debt backed by Fannie Mae and Freddie Mac (government-sponsored enterprises, or GSEs).4 The Department of Veterans Affairs (VA) does not guarantee loans for properties with more than four units.5
CBO analyzed those data sources in four steps:
- First, CBO extracted data from the Home Mortgage Disclosure Act (HMDA) data on mortgage originations by census tract and origination cohort for three types of mortgages: conventional, FHA, and VA.
- Second, CBO computed the share of originated debt still outstanding in 2020 (according to the National Mortgage Database, or NMDB) for each type of mortgage by county, and then it applied that ratio to the HMDA data to estimate the amount of outstanding debt in 2020 by census tract, mortgage type, and year the mortgage was originally funded. The originated debt was then scaled to match the national total for each mortgage program in 2020 derived from the NMDB. Conventional loans were divided into GSE and non-GSE loans using shares of outstanding debt in each county.
- Third, the agency estimated the current property value associated with each cohort of mortgage type in each census tract by dividing outstanding debt by the average current loan-to-value ratio for the mortgage type–cohort by county. The NMDB estimates current value using a quarterly county-specific house price index from the Federal Housing Finance Agency to update the original value of the home.
- Fourth, CBO multiplied the current total property value by average non-land value shares from the Federal Housing Finance Agency to estimate the value of the structures for each mortgage type–cohort by census tract.
Estimating the Expected Annual Damage to Homes with Federally Backed Mortgages
Expected annual damage is the yearly damage to a given home when averaged over many years for a given profile of flood risk. “Expected” refers to the averaging process; it does not mean that homeowners should necessarily anticipate their home flooding. In any given year, most homes have little chance of facing any flood damage. The probability is not zero, however, and some homes face a chance of major flood damage.
Average annual loss (AAL) is a percentage—the average share of the value of a property’s structure that is lost to flood damage over many years at a given flood risk profile. EAD for an individual property is equal to AAL times the value of the structure on that property.
FSF’s model provides projected flood depths and the AAL for all properties in the United States. FSF calculated AAL using its own research as well as depth- damage curves from the Army Corps of Engineers and the Federal Emergency Management Agency.6 Depth-damage curves relate flood depth to the share of structure value lost, conditional on building characteristics such as the type of building, type of flooding, presence of a basement, and height of the foundation.
AAL is computed by weighting the loss associated with different flood depths by their probability of occurring. The FSF model used depth-damage curves to predict damage for flood depths that have an annual chance of occurring equal to 1 in 2, 1 in 5, 1 in 20, 1 in 100, 1 in 250, and 1 in 500. The average annual loss is calculated by the following formula, summing over the different predicted flood depths:
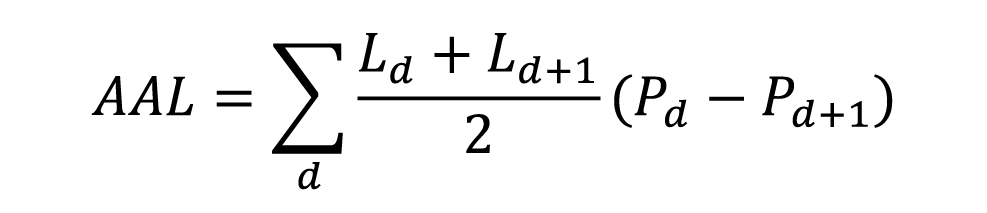
In that formula,  indexes the list of flood depths: For example, the flood depth with a 1 in 2 annual chance has =1, and the flood depth with a 1 in 5 annual chance has
  =2.
=2.  is the loss as a share of the structure value for flood depth , and
  is the probability of a flood of at least depth . The formula is the area under the curve relating to
  (see Figure B-1).
Figure B-1.
Average Annual Loss Calculation
Percentage of Structure Value Lost

To illustrate how AAL is calculated, CBO plotted the damage estimates for a hypothetical property. In this example, there is a 1 in 20 annual chance of the property experiencing damage of at least 5 percent of the structure value.
Data source: Congressional Budget Office. See www.cbo.gov/publication/59379#data.
To compute the total EAD by mortgage type in a given census tract, CBO multiplied the average AAL across all likely single-family properties in that tract by the total structure value associated with each mortgage program. That is, in CBO’s modeling approach, the AALs of properties in a census tract are not correlated with the likelihood of having a mortgage, having a mortgage with a particular type of guarantee, or the value of the home.
In CBO’s estimates, EAD only encompasses damage to residential structures with mortgages—for example, it does not include damage to other structures and property, building contents, or infrastructure, nor does it include losses from interruption to business activity.
Identifying Single-Family Homes in the FSF Data
CBO used the National Structure Inventory (NSI) developed by the Army Corps of Engineers to identify which FSF properties were probably one to four unit residential structures. The flood damage model outputs from FSF include nonresidential and multifamily residential structures, but that categorization could not be shared with CBO because of FSF’s data license agreements. However, FSF uses the NSI as one of its base inputs for developing its universe of properties. For each FSF property, CBO found the nearest NSI property. If that property was within 100 meters of a residential structure with between one and four units, the agency designated the FSF property as a single-family home. If the nearest NSI structure was more than 100 meters away, the FSF property was designated as a single-family home if at least 90 percent of NSI structures in the same census block group—a statistical subdivision of a census tract—were structures containing between one and four units. Of FSF properties, 86 percent were designated to be likely single-family homes, compared with the 87 percent of NSI structures that are single-family homes.
Computing Damage Inside and Outside of SFHAs and Coastal Areas
CBO modeled the share of homes with federally backed mortgages that are within Special Flood Hazard Areas (SFHAs) because the mortgage origination and performance data sets do not indicate whether an individual mortgaged home is located in an SFHA. Within a census tract, CBO estimated that the share of structure value associated with mortgages within the SFHA is equal to the share of likely residential properties that are designated by FSF as being located in an SFHA.7 Then, to estimate EAD, CBO applied the average AAL among likely residential properties within the SFHA in that census tract.
CBO defined coastal areas as those census tracts that lie within a census-designated coastal county and consist partly of water.
Converting Expected Annual Damage to Present Value
Expected annual damage is an annual flow, but an investor purchasing a home would consider the total damage over many years, discounted back to the present. From the viewpoint of that investor, future flood damage would require additional investments over time to maintain the value of the property. The investor would therefore value avoiding that stream of damage at its present value, discounted by the real rate of return on the property:
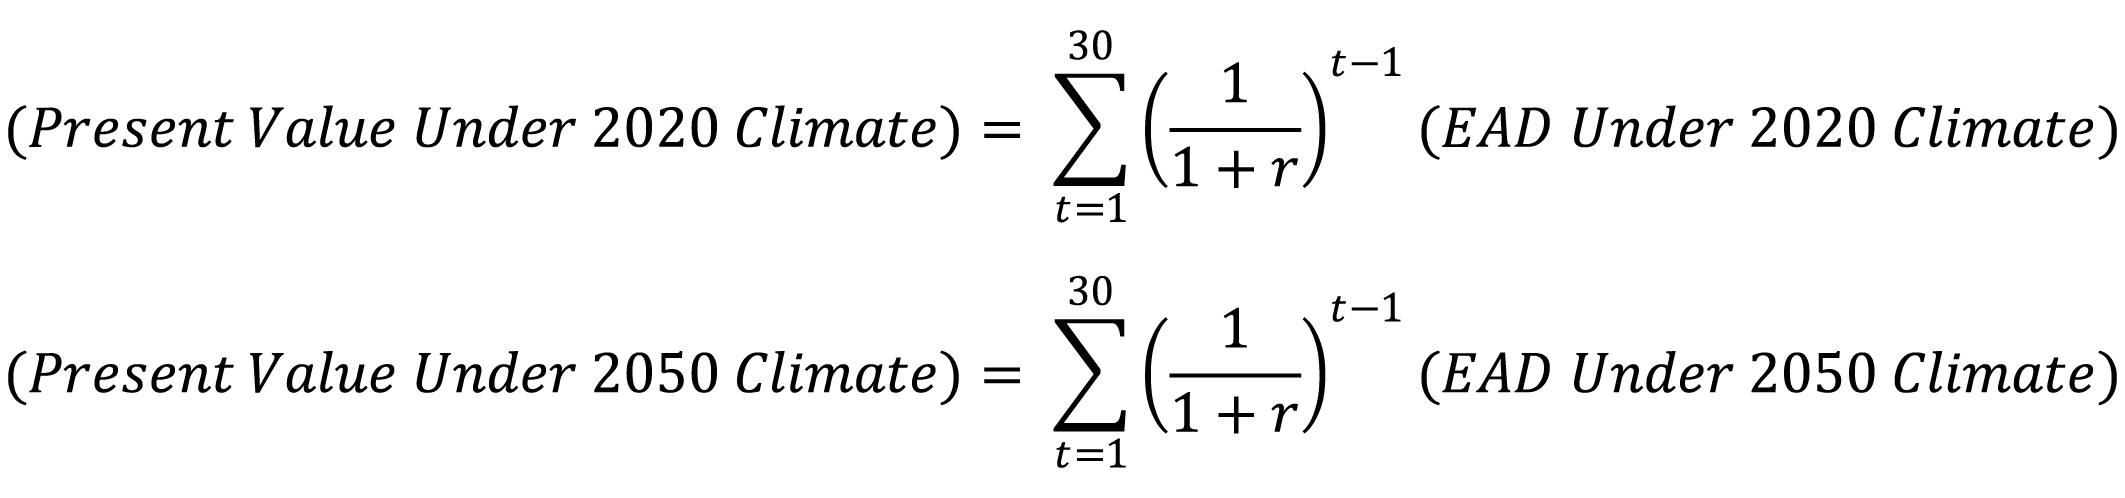
CBO adopted a discount rate (r) of 3 percent, which is approximately equal to the real return on residential assets over the past several decades.8 Some recent related studies also use a 3 percent discount rate as suggested by the Office of Management and Budget’s Circular A-4 until recently and compute damage over a 30-year period, so CBO’s estimates are comparable to those studies.9
1. For details about specific scenarios, see R. K. Pachauri and L. A. Meyer, eds., Climate Change 2014 Synthesis Report: Contribution of Working Groups I, II and III to the Fifth Assessment Report of the Intergovernmental Panel on Climate Change (IPCC, 2014), www.ipcc.ch/report/ar5/syr/; and H. Lee and J. Romero, eds., Climate Change 2023: Synthesis Report, Contribution of Working Groups I, II and III to the Sixth Assessment Report of the Intergovernmental Panel on Climate Change (IPCC, 2023), www.ipcc.ch/report/ar6/syr/.
2. The IPCC recently released its sixth assessment report, which uses a new set of scenarios known as shared socioeconomic pathways (SSPs), but CBO did not have access to flood risk modeling based on those scenarios. In that report, SSP 2-4.5 is most similar to RCP 4.5. In that scenario, the IPCC’s best estimate of the global average temperature for the 2050 projection period is 2.0 degrees Celsius higher than the average from 1850 to 1900. That difference is 0.1 degree Celsius greater than the median estimate for 2050 under RCP 4.5 reported in its fifth assessment report. T. F. Stocker and others, eds., Climate Change 2013: The Physical Science Basis, Contribution of Working Group I to the Fifth Assessment Report of the Intergovernmental Panel on Climate Change (Cambridge University Press, 2013), Annex II: Climate System Scenario Tables, Tables AII.7.5 and AII.7.7, www.ipcc.ch/report/ar5/wg1/; and V. Masson-Delmotte and others, eds., “Summary for Policymakers” in Climate Change 2021: The Physical Science Basis. Contribution of Working Group I to the Sixth Assessment Report of the Intergovernmental Panel on Climate Change (Cambridge University Press, 2021), Table SPM.1, https://doi.org/10.1017/9781009157896.001.
3. Federal Housing Finance Agency, National Mortgage Database Technical Documentation, Technical Report 1 (December 2022), p. C-4, https://tinyurl.com/5stuubn6 (PDF); Department of Housing and Urban Development, FHA Single Family Housing Policy Handbook: Glossary (August 2023), https://tinyurl.com/bdkkbdd3; Fannie Mae, Selling Guide Glossary of Fannie Mae Terms: L thru Z (accessed May 18, 2023), https://tinyurl.com/y989yhx8.
4. Federal Housing Administration, Annual Management Report Fiscal Year 2020 (November 2020), p. 94, https://tinyurl.com/2mdjxknn; Federal Home Loan Mortgage Corporation, 2020 Annual Report on Form 10-K (2021), p. 196, https://tinyurl.com/zsdcv9xp; and Federal National Mortgage Corporation, 2020 Annual Report on Form 10-K (2021), p. F-30, https://tinyurl.com/et2jaxp.
5. Department of Veterans Affairs, Veterans Benefits Administration, VA Home Loan Buyer’s Guide (June 8, 2023), www.benefits.va.gov/homeloans/.
6. Saman Armal and others, “Assessing Property Level Economic Impacts of Climate in the US, New Insights and Evidence From a Comprehensive Flood Risk Assessment Tool,” Climate, vol. 8, no. 10 (October 2020), p. 116, https://doi.org/10.3390/cli8100116; and Jeremy Porter and others, “Estimating Pluvial Depth–Damage Functions for Areas Within the United States Using Historical Claims Data,” Natural Hazards Review, vol. 24, no. 1 (February 2023), https://doi.org/10.1061/NHREFO.NHENG-1543.
7. FSF used digitized FEMA flood maps to identify flood zones. Over 90 percent of the U.S. population is covered by digitized maps. Some areas are not covered by FEMA flood maps; those areas do not contain any SFHAs. Others are covered by undigitized maps that could include SFHAs. Thus, the estimate of damage outside of a flood zone is probably slightly overestimated.
8. The real return on residential assets (that is, the return adjusted to remove the effects of inflation) is based on CBO’s calculations using data from the Bureau of Economic Analysis and the Federal Reserve.
9. See, for example, Jesse D. Gourevitch and others, “Unpriced Climate Risk and the Potential Consequences of Overvaluation in US Housing Markets,” Nature Climate Change, vol. 13 (2023), pp. 250–257, https://doi.org/10.1038/s41558-023-01594-8; and Cameron Wobus and others, “Climate Change, Riverine Flood Risk, and Adaptation for the Conterminous United States,” Environmental Research Letters, vol. 16, no. 9 (August 2021), https://doi.org/10.1088/1748-9326/ac1bd7.
Appendix CData Sources for Exhibits
Mortgages for Single-Family Homes in 2020
Congressional Budget Office, using data from the Federal Housing Finance Agency, National Mortgage Database, www.fhfa.gov/nmdb.
Expected Annual Damage From Flooding
Congressional Budget Office, using data from the National Mortgage Database; First Street Foundation, “Property Level Flood Risk Statistics,” version 2.0 (April 13, 2022), https://zenodo.o rg/record/6459076; Consumer Financial Protection Bureau, “Home Mortgage Disclosure Act Data,” www.consumerfinance.gov/data-research/hmda; Army Corps of Engineers, “National Structure Inventory 2022,” www.hec.usace.army.mil/confluence/nsi/; William Larson and others, The Price of Residential Land for Counties, ZIP Codes, and Census Tracts in the United States, Working Paper 19-01 (Federal Housing Finance Agency, updated November 2020), https://tinyurl.com/yckj9xhr; Census Bureau, 2010 TIGER/Line Shapefiles (December 5, 2022), https://tinyurl.com/ysfenbrx.
Total Expected Annual Damage to Homes With Federally Backed Mortgages Under Different Climate Projections
Congressional Budget Office, using data from the National Mortgage Database; First Street Foundation; Consumer Financial Protection Bureau; Army Corps of Engineers; William Larson and others; and 2010 TIGER/Line Shapefiles.
Change in Expected Annual Damage Under Different Climate Projections
Congressional Budget Office, using data from the National Mortgage Database; First Street Foundation; Consumer Financial Protection Bureau; Army Corps of Engineers; William Larson and others; and 2010 TIGER/Line Shapefiles.
Present Value of Damage to Homes
Congressional Budget Office, using data from the National Mortgage Database; First Street Foundation; Consumer Financial Protection Bureau; Army Corps of Engineers; William Larson and others; and 2010 TIGER/Line Shapefiles.
Present Value of Damage as a Share of Property Value for Homes at Risk of Flood Damage
Congressional Budget Office, using data from the National Mortgage Database; First Street Foundation; Consumer Financial Protection Bureau; Army Corps of Engineers; William Larson and others; and 2010 TIGER/Line Shapefiles.
Share of Expected Annual Damage Accounted for by Homes Outside Special Flood Hazard Areas
Congressional Budget Office, using data from the National Mortgage Database; First Street Foundation; Consumer Financial Protection Bureau; Army Corps of Engineers; William Larson and others; and 2010 TIGER/Line Shapefiles.
Share of Expected Annual Damage Accounted for by Homes in Coastal Areas
Congressional Budget Office, using data from the National Mortgage Database; First Street Foundation; Consumer Financial Protection Bureau; Army Corps of Engineers; William Larson and others; 2010 TIGER/Line Shapefiles; Steven G. Wilson and Thomas R. Fischetti, “Coastline Population Trends in the United States: 1960 to 2008,” Report P25-1139 (Census Bureau, May 2010), https://tinyurl.com/3dcwbf3x; Census Bureau, “Substantial Changes to Counties and County Equivalent Entities: 1970–Present,” https://tinyurl.com/386k7mvf (2010), and https://tinyurl.com/2mu2ywj5 (2000).
Expected Annual Damage From Flooding to Homes With Federally Backed Mortgages in the 2020 Period
Congressional Budget Office, using data from the National Mortgage Database; First Street Foundation; Consumer Financial Protection Bureau; Army Corps of Engineers; William Larson and others; 2010 TIGER/Line Shapefiles; and Steven Manson and others, “IPUMS National Historical Geographic Information System: Version 17.0” (2022), https://doi.org/10.18128/D050.V17.0.
Present Value of Flood Damage to Homes With Federally Backed Mortgages as a Percentage of Total Property Value in the 2020 Period
Congressional Budget Office, using data from the National Mortgage Database; First Street Foundation; Consumer Financial Protection Bureau; Army Corps of Engineers; William Larson and others; 2010 TIGER/Line Shapefiles; Steven G. Wilson and Thomas R. Fischetti; “Substantial Changes to Counties and County Equivalent Entities: 1970–Present”; and Steven Manson and others.
Total Increase in Expected Annual Damage to Homes With Federally Backed Mortgages, by County
Congressional Budget Office, using data from the National Mortgage Database; First Street Foundation; Consumer Financial Protection Bureau; Army Corps of Engineers; William Larson and others; “2010 TIGER/Line Shapefiles”; Steven G. Wilson and Thomas R. Fischetti; Census Bureau, “Substantial Changes to Counties and County Equivalent Entities: 1970–Present”; and Steven Manson and others.
About This Document
This report was prepared at the request of the Ranking Member of the House Committee on Financial Services. In keeping with the Congressional Budget Office’s mandate to provide objective, impartial analysis, the report makes no recommendations.
Evan Herrnstadt and Jeffrey Perry (formerly of CBO) prepared the report with guidance from Nicholas Chase, Michael Falkenheim, Sebastien Gay, and Joseph Kile and with contributions from Jared Jageler, Vinay Maruri (formerly of CBO), and Byoung Hark Yoo. Noelia Duchovny, Paul B. A. Holland, Michael Lacour-Little, Charles Pineles-Mark, Mitchell Remy, Jennifer Shand, Emily Stern, Robert Sunshine, Natalie Tawil, David Torregrosa, and James Williamson offered comments. Jared Jageler fact-checked the report.
Michael Craig of the Department of Housing and Urban Development, Benjamin Keys of the University of Pennsylvania, Jeremy Porter of the City University of New York, and Parinitha Sastry of Columbia University commented on an earlier draft. The assistance of external reviewers implies no responsibility for the final product; that responsibility rests solely with CBO.
Mark Doms, Jeffrey Kling, and Robert Sunshine reviewed the report. Caitlin Verboon edited it, and Jorge Salazar created the graphics and prepared the text for publication. The report is available at www.cbo.gov/publication/59379.
CBO seeks feedback to make its work as useful as possible. Please send comments to communications@cbo.gov.

Phillip L. Swagel
Director
November 2023