
Chad Shirley, Principal Analyst
Microeconomic Studies Division
Before the Subcommittee on Highways and Transit
Committee on Transportation and Infrastructure
U.S. House of Representatives
Chairman Crawford, Ranking Member Norton, and Members of the Subcommittee, thank you for inviting me to today’s hearing. I will discuss the status of the Highway Trust Fund, options for highway spending, and approaches to paying for that spending.
Summary
Federal spending on highways (or, synonymously, roads) totaled $52 billion in 2022. Most of those outlays were for grants to state and local governments to support their spending on capital projects. (Those governments typically spend roughly three times as much of their own funds on highways each year, not only on capital projects but also to operate and maintain roads.) That $52 billion also included spending for federal programs that subsidize state and local governments’ borrowing for highway projects; other subsidies for state and local borrowing are provided through the tax code.
Historically, most federal spending for highways has been paid for by revenues—largely from excise taxes on gasoline, diesel, and other motor fuels—that are credited to the highway account of the Highway Trust Fund. For more than two decades, those revenues have fallen short of federal spending on highways, prompting transfers from the Treasury’s general fund to the trust fund to make up the difference.
The Congressional Budget Office projects that balances in both the highway and transit accounts of the Highway Trust Fund will be exhausted in 2028. If the taxes that are currently credited to the trust fund remained in place and if funding for highway and transit programs increased annually at the rate of inflation, the shortfalls accumulated in the Highway Trust Fund’s highway and transit accounts from 2024 to 2033 would total $241 billion, according to CBO’s May 2023 baseline budget projections.1
The current authorization for federal highway programs expires on September 30, 2026. As policymakers consider future reauthorization, they have many decisions to make about federal highway programs, including how much to spend on them, how to direct that spending, and how to pay for those programs.
Federal Spending for Highways
As a share of total economic output, federal spending for highways has been relatively stable for several decades. Almost all federal spending is for capital projects rather than for operation and maintenance and is restricted to federal-aid highways, which consist of the Interstate Highway System and most other roads that are not local roads. Federal highway funds are distributed to states on the basis of formulas that depend on how much states received in earlier years, so federal spending does not necessarily go to the projects that would produce the greatest net benefits.
Lawmakers have many options for determining the amount of money spent on highways, including these:
- Maintain the current conditions and performance of the highway system. Under the Federal Highway Administration’s (FHWA’s) scenario in which federal-aid highways’ conditions and performance are maintained at their 2016 levels, an annual average of $61 billion per year in federal spending would be needed over the 2024–2033 period, CBO estimates. That amount is $4 billion less than the average annual spending in CBO’s 10-year baseline projections.
- Fund all projects for which the expected benefits meet or exceed the costs. Under FHWA’s scenario in which projects are funded according to that criterion, an average of $99 billion per year in federal spending would be needed over the 2024–2033 period, CBO estimates. That estimate, which reflects the assumption that state and local governments increased their spending for federal-aid highways proportionally, is about $34 billion more than the average annual amount in CBO’s 10-year baseline projections.
Revenues Credited to the Highway Trust Fund
The Highway Trust Fund has two accounts—one for highways and the other for mass transit—to which certain fuel and other vehicle-related excise tax collections are credited. In CBO’s May 2023 baseline projections, revenues credited to the Highway Trust Fund in 2024 total $47 billion, and outlays from the fund in that year exceed those revenues by about $18 billion.
Policymakers have a number of options to increase the resources available in the Highway Trust Fund:
- Increase the existing fuel taxes. The tax on gasoline has been 18.4 cents per gallon, and the tax on diesel fuel 24.4 cents per gallon, since October 1993. Increasing those taxes by 15 cents per gallon in January 2024 would raise $250 billion more in revenues for the Highway Trust Fund over the 2024–2033 period than projected in CBO’s May baseline. An increase of that amount would eliminate the fund’s shortfall. However, the increase in fuel taxes would reduce taxable business and individual income, resulting in $62 billion of reductions in income and payroll tax receipts that would partially offset the increase in fuel tax receipts.
- Institute new taxes or fees. Policymakers could institute new taxes or fees, such as taxes on vehicle miles traveled (VMT) or a tax or fee on electric vehicles (EVs). One option would be to impose a VMT tax on commercial trucks. CBO has estimated, using data from 2022, that if such a tax was applied to all commercial trucks on all roads and all the practical steps necessary to implement it were taken, each cent of the tax would generate $3 billion per year. The federal government’s costs of implementing such a tax and ensuring compliance could, however, be substantial. Another option, an annual tax on EVs, would probably not have a substantial effect on the trust fund’s shortfall over the next 10 years because such vehicles are projected to make up a relatively small portion of the total stock of vehicles.
- Transfer money from the Treasury’s general fund. Under this option, the federal government would, in effect, pay for a portion of highway spending in the same way that it funds other programs and activities.
Status of the Highway Trust Fund
The federal government pays for most surface transportation programs through the accounting mechanisms of the Highway Trust Fund’s two separate accounts—one for highways and one for mass transit. The trust fund records specific cash inflows from revenues collected through excise taxes on the sale of motor fuels, trucks and trailers, and truck tires; taxes on the use of certain kinds of vehicles; and interest credited to the fund. The Highway Trust Fund records cash outflows for spending on designated highway and mass transit programs, mostly in the form of grants to states and local governments.
In 2022, $48 billion in revenues and interest were credited to the Highway Trust Fund; of that amount, $42 billion went to the highway account and the remaining $6 billion to the transit account. Most of those revenues came from taxes on gasoline and other motor fuels.
According to CBO’s May baseline projections, if the excise taxes were continued at their current rates and current funding for highway and transit programs increased annually at the rate of inflation, the revenues and accumulated balances of each of the Highway Trust Fund’s two accounts would be insufficient to cover spending from the respective accounts starting in 2028 (see Figure 1). That year, in CBO’s projections, revenues and interest credited to the Highway Trust Fund total $43 billion, and outlays exceed revenues and interest earnings by about $39 billion.
Figure 1.
Annual Cash Inflows, Outlays, and Balances of the Highway Trust Fund’s Accounts in CBO’s May 2023 Baseline Projections
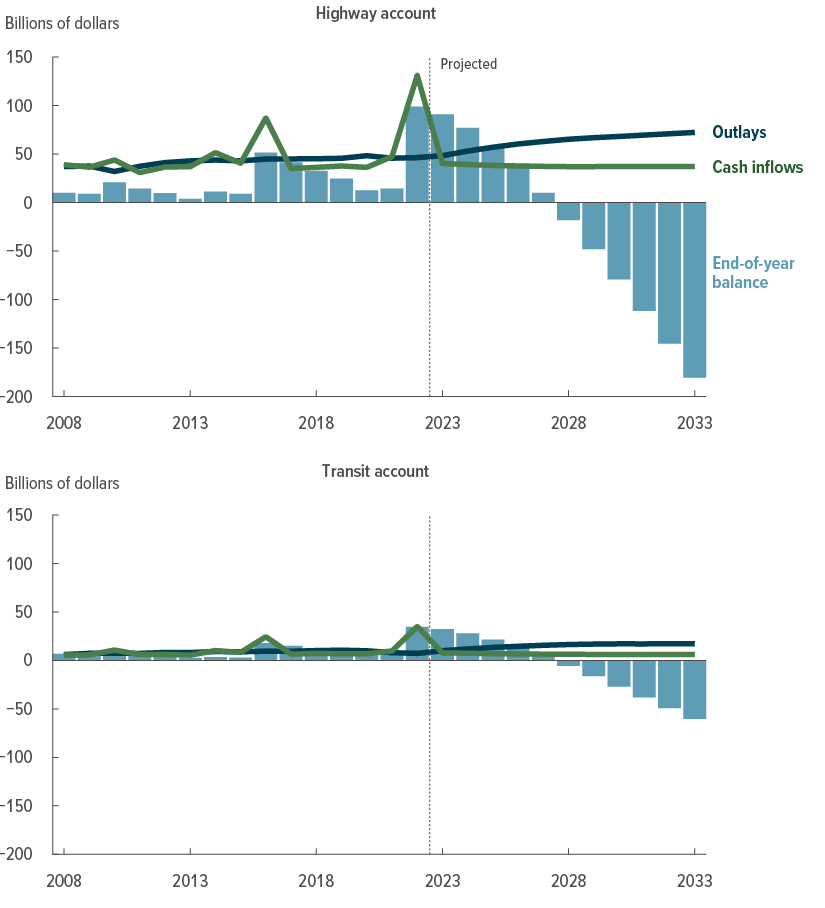
Outlays from the Highway Trust Fund have long exceeded the revenues credited to it from taxes, but intragovernmental transfers have ensured that the fund’s two accounts have maintained a positive balance. In CBO’s projections, the balances of both the highway account and the transit account are exhausted in 2028.
Data source: Congressional Budget Office. See www.cbo.gov/publication/59634#data.
Cash inflows to the Highway Trust Fund’s accounts include tax receipts, interest, intragovernmental transfers, and amounts transferred between the highway account and the transit account, which are known as flexed balances.
Some of the taxes that are credited to the Highway Trust Fund are scheduled to expire on September 30, 2028, including the taxes on tires and all but 4.3 cents of the federal tax on motor fuels. However, under the rules governing baseline projections in the Balanced Budget and Emergency Deficit Control Act of 1985, these estimates reflect the assumption that all the expiring taxes credited to the fund will continue to be collected after fiscal year 2028.
Under current law, the balances of the Highway Trust Fund cannot fall below zero. However, to accord with the rules governing such projections, CBO’s baseline for surface transportation spending reflects the assumption that obligations presented to the Highway Trust Fund will be paid in full.
To cover the shortfalls recorded in the fund’s accounts, lawmakers have enacted legislation that since 2008 has transferred $275 billion—mostly from the Treasury’s general fund—to the Highway Trust Fund. That total includes $118 billion that lawmakers transferred from the general fund through the Infrastructure Investment and Jobs Act (IIJA, Public Law 117-58)—$90 billion to the highway account and $28 billion to the transit account.
Spending for Highways
Almost all spending on highway infrastructure in the United States is funded publicly. Although the private sector participates in building, operating, and maintaining projects, the federal government and state and local governments typically determine which projects to undertake and how much to spend on them.
In 2022, the federal government spent $52 billion on highways—an amount equal to 0.21 percent of gross domestic product (GDP). Such spending’s share of total economic output has, in general, been stable over the past few decades, though it is only half as large as it was in the 1960s, when construction of the Interstate Highway System expanded (see Figure 2).
Figure 2.
Public Spending for Highways
Percentage of gross domestic product
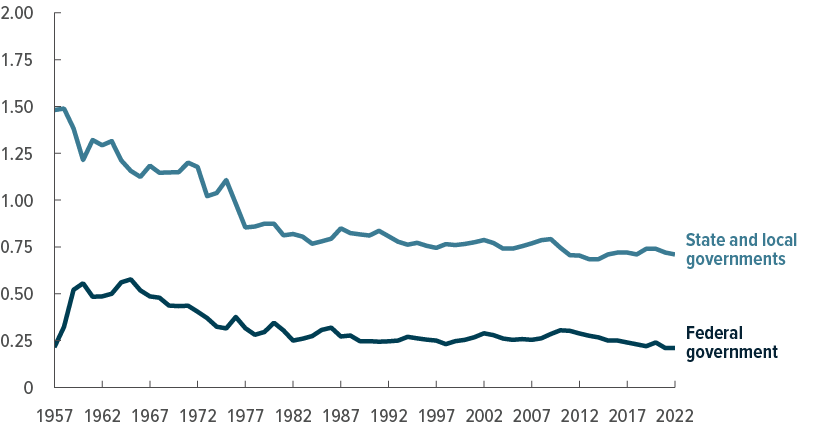
State and local governments spend three times as much as the federal government on highways. Measured as a percentage of total economic output, such spending by those levels of government has been relatively stable for the past few decades.
Data source: Congressional Budget Office, using data from the Bureau of Economic Analysis, the Census Bureau, and the Office of Management and Budget. See www.cbo.gov/publication/59634#data.
State and local governments spent more than three times as much as the federal government on highways in 2022—$180 billion, or 0.71 percent of GDP. Like federal spending on highways, state and local governments’ spending as a share of GDP peaked in the 1950s and 1960s, when it accounted for about twice the share it has in recent years.
Characteristics of Federal Funding for Highways
Two characteristics of the ways that the federal government typically spends on highways stand out. First, most federal highway funding takes the form of grants to state and local governments, which have broad discretion (with some constraints) in how they spend those federal funds. Second, federal spending on highways is almost entirely dedicated to capital projects that are intended to expand or rehabilitate eligible federal-aid highways.
In 2022, most of the $52 billion that the federal government spent on highways took the form of grants to state and local governments, which own almost all highways. Federal agencies own less than 1 percent of public roads (typically, those in national parks and forests, on tribal lands, or on other federally owned land).
In general, state and local governments decide which projects to undertake and, as construction proceeds, receive reimbursements from the federal government for projects that meet federal eligibility criteria for various programs. Most federal highway programs set a cap on the portion of a project’s total costs that a federal grant may cover—typically 80 percent. State and local governments must cover the remaining costs with nonfederal funds, such as tax revenues or proceeds from issuing municipal bonds.
In 2022, $50 billion (or 96 percent) of federal spending for highways went to capital investment (see Figure 3). That spending includes outlays for the purchase of structures (such as new highways and bridges) and equipment as well as expenditures that improve or rehabilitate structures and equipment already in place. Such an allocation between capital and operation and maintenance has been typical of federal spending for highways since the 1950s.
Figure 3.
Spending for Highways, by Level of Government and Type of Spending, 2022
Billions of dollars
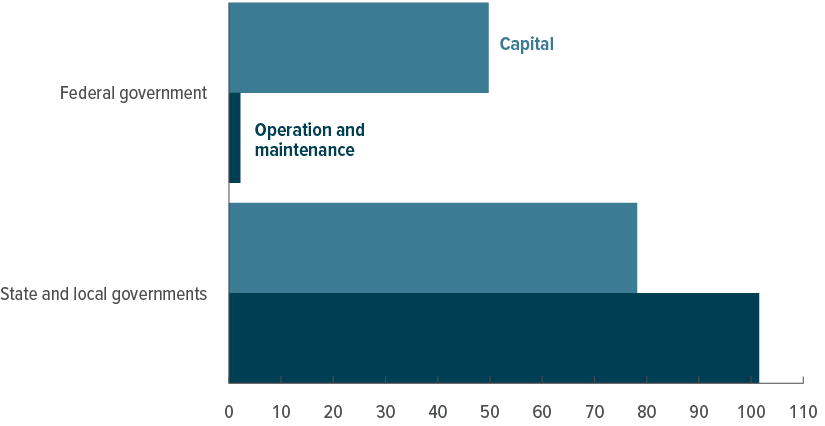
Federal spending for highways consists primarily of grants to state and local governments to help pay for capital projects. Those governments own the roads and pay to operate and maintain them.
Data source: Congressional Budget Office. See www.cbo.gov/publication/59634#data.
Because the federal government does not generally own highways, the responsibility to operate and maintain them falls to state and local governments. Spending patterns reflect that: Operation and maintenance accounted for 57 percent of state and local governments’ spending on highways, net of federal grants, in 2022. Operation and maintenance costs include the costs of providing necessary operating services (such as snow removal) and maintaining and repairing existing capital (such as filling potholes) as well as the costs of funding other highway-related programs (such as education about highway safety).
Unless additional funds are provided to the Highway Trust Fund (either through an increase in revenues credited to the fund or through additional transfers from general revenues), CBO estimates that, starting in 2028, balances in the highway account of the trust fund will fall to zero, and the Department of Transportation will be unable to reimburse states in a timely fashion for the bills presented to the fund. (The department may choose to more closely manage the timing of reimbursements to states before balances reach zero. In the past, it has, for example, considered partially reimbursing states to align total reimbursements with semimonthly receipts.) The possibility of delays in payments from the federal government increases uncertainty among states when they plan transportation projects.
Federal Funding for Highways
The most recent authorization for highway spending—the Surface Transportation Reauthorization Act (division A of the IIJA), which became law in 2021—provided $383 billion in contract authority (a form of mandatory budget authority) for a variety of transportation programs (primarily highway and transit programs) over the 2022–2026 period.2 In addition to the funding provided through the Highway Trust Fund, division J of the IIJA provided $71 billion for highways and transit in discretionary appropriations from the general fund.
Options for Determining Total Annual Spending Amounts
To construct its baseline projections for spending on highways from the Highway Trust Fund, CBO starts with the funding provided in the most recent appropriation law and adjusts that amount to reflect a combination of the projected changes in the GDP price index and in the employment cost index. However, lawmakers could choose to set annual spending amounts for highway programs on the basis of different criteria. CBO analyzed two options that the Congress could pursue.
Set Spending to Maintain Current Highway Conditions and Performance. Under FHWA’s scenario in which federal-aid highways’ conditions and performance—namely, pavement quality, bridge conditions, and travel delays—are maintained at their 2016 levels, an annual average of $61 billion in federal spending would be needed over the 2024–2033 period, CBO estimates.3 That amount would average 0.18 percent of GDP annually in those years—14 percent less than the share of GDP that spending for highway capital accounted for in 2022.
Fund All Highway Projects for Which Benefits Exceed Costs. Funding all projects for which benefits are expected to equal or exceed costs would require increasing annual spending well above recent amounts and the amounts in CBO’s baseline projections. In its modeling of benefits, FHWA includes benefits for highway users, such as reductions in travel time, crashes, and vehicle operating costs; for government agencies, through lower maintenance costs and longer service lives for roadways; and for society as a whole, including reduced vehicle emissions. Under FHWA’s scenario in which federal-aid highways’ conditions and performance are improved by funding all potential projects with benefit-cost ratios greater than or equal to 1.0, the federal portion of the total average annual investment that would be needed over the 2024–2033 period would equal $99 billion, CBO estimates.4 That amount would average 0.30 percent of GDP annually from 2024 to 2033—43 percent more than the share of GDP that spending for highway capital accounted for in 2022.
State and local governments would also have to increase spending on federal-aid highways to achieve the total level of investment modeled in the FHWA analysis. If those funds were spent only on projects whose benefits were estimated by FHWA to meet or exceed costs, the share of total vehicle miles traveled on federal-aid highways whose pavement was rated good or fair (as opposed to poor) would increase from 86 percent to 94 percent, and average travel delays per vehicle would be cut by about 2 hours annually.5
Estimates of net benefits produced by benefit-cost analyses are uncertain, however. Such analyses rely on judgments about a variety of factors, including the value of benefits that are difficult to measure (such as the value of travelers’ time and of vehicle maintenance costs avoided), the appropriate interest rate to use to discount future costs and benefits to present values, and how highways will be used in the future (for example, the number of vehicle miles traveled by passenger vehicles and trucks).
Revenues Credited to the Highway Trust Fund
The federal government collects revenues for the Highway Trust Fund primarily from taxes on motor fuels. Lawmakers could increase revenues by raising those taxes or by instituting new ones.
Sources of Revenues
Of the revenues credited to the Highway Trust Fund in 2022, $40 billion (or 83 percent) stemmed from excise taxes on gasoline, diesel, and other motor fuels (see Figure 4). Receipts from the tax of 18.4 cents per gallon on gasoline and ethanol-blended fuel contributed the largest amount—$28 billion, or nearly 60 percent of the fund’s revenues. Receipts from the tax of 24.4 cents per gallon on diesel and other fuels totaled $12 billion, or about one-quarter of the fund’s revenues. The taxes on gasoline and diesel fuel have been in place since 1993, and the rates have not been adjusted since then. Most of the per-gallon federal taxes on motor fuels are scheduled to expire on September 30, 2028; after that date, the federal tax on motor fuels would be only 4.3 cents per gallon.6
Figure 4.
Sources of Revenues Credited to the Highway Trust Fund, 2022
Billions of dollars

Data source: Congressional Budget Office, using data from the Federal Highway Administration and the Internal Revenue Service. See www.cbo.gov/publication/59634#data.
a. Includes interest income and civil penalties and fines. Excludes intragovernmental transfers.
If those taxes were extended at their current rates, revenues from gasoline and diesel taxes would decline at a rate of about 1 percent per year over the next 10 years, CBO projects. Factors contributing to that projected decline include the rising fuel economy of vehicles and the slow rate of growth of the total number of miles traveled by vehicles.
Not all the receipts from the excise taxes on motor fuels are dedicated to highway spending. A portion of those receipts—2.86 cents per gallon, which amounted to about $6 billion in 2022—goes to the transit account of the Highway Trust Fund. In addition, 0.1 cent per gallon goes to the Environmental Protection Agency’s Leaking Underground Storage Tank Trust Fund, which supports programs run by state and local governments that prevent and clean up leaks from underground petroleum storage tanks.
Revenues from three other taxes, which are specific to heavy vehicles, are also credited to the Highway Trust Fund. The excise tax on trucks and trailers—equal to 12 percent of the sales price of tractors, trucks, and trailers that exceed a specified weight—accounted for 10 percent of the trust fund’s revenues in 2022. A tax on the use of heavy vehicles (a $100 to $550 annual tax on trucks over 55,000 pounds) and an excise tax on certain tires for heavy trucks contributed smaller amounts to the fund.
In addition to those taxes, various fees and interest on invested balances are credited to the trust fund.
Options for Increasing Revenues
The options to increase resources available in the Highway Trust Fund include increasing existing taxes, instituting new taxes or fees, or making general fund transfers.
Increase Existing Fuel Taxes. CBO analyzed an option that would increase federal excise tax rates on gasoline and diesel fuel by 15 cents per gallon.
According to estimates by the staff of the Joint Committee on Taxation (JCT), increasing the tax rates on fuel by 15 cents in January 2024 would increase revenues to the Highway Trust Fund by $19 billion in the remainder of fiscal year 2024 and by $27 billion in 2025. Over the 2024–2033 period, cumulative fuel-tax receipts credited to the Highway Trust Fund would exceed the amount in CBO’s May baseline projections by $250 billion. An increase of that amount would eliminate the projected cumulative shortfall in the Highway Trust Fund and provide an additional $9 billion in revenues to the fund by 2033. Interest payments on any accumulated balances would further increase the resources available in the trust fund.
However, that increase in fuel taxes would reduce other federal income and payroll tax receipts by decreasing taxable business and individual income. As a result, the net budgetary effects would be smaller: deficit reductions totaling $188 billion over the 2024–2033 period.
Institute New Taxes or Fees. Another option is to impose new taxes or fees that better align what people pay for using roads with the cost of building those roads. The most recent national study of how different types of vehicles contribute to the highway costs that federal programs pay for was published by FHWA in 2000. Passenger vehicles constituted the largest group of vehicles in use and were estimated to account for about 60 percent of federal highway costs in 2000, even though their estimated cost per mile of highway use was, at 0.8 cents, the lowest of all vehicles.
Costs attributed to trucks accounted for the remaining 40 percent of federal highway costs, but trucks provided about one-third of the Highway Trust Fund’s revenues. For each mile they traveled in 2000, combination trucks (that is, tractors pulling one or more trailers) were estimated to impose a cost of 8.4 cents. For all trucks, the estimated cost per mile traveled ranged from 2.2 cents for the trucks carrying the lightest loads to 20.3 cents for those with the heaviest loads.7
More recently, some states have calculated cost shares for different types of vehicles that are similar to the estimates in the FHWA study. In 2019, Oregon estimated that light vehicles (mainly cars and other passenger vehicles) would account for about two-thirds of state highway costs in 2020 and heavy vehicles for about one-third.8 As the Oregon report noted, however, highway spending by state governments includes maintenance costs, such as snow removal and pothole patching, whereas federal spending does not.
In recent years, revenues credited to the Highway Trust Fund have declined. Because of improvements in vehicles’ fuel efficiency, drivers use less fuel and therefore pay less in fuel taxes to travel the same distance. To ensure that any new taxes that were implemented reached revenue targets and addressed highway users’ equity and privacy concerns, policymakers would have to make a number of decisions about how to design and implement those taxes.
Impose a VMT Tax. Instituting a tax on vehicle miles traveled would charge all vehicles for their highway use regardless of the vehicle’s fuel efficiency or energy source. Such a tax could help allocate resources efficiently by making users pay for the costs they impose. However, it would present several challenges. A VMT tax would be more costly to administer than the current excise taxes on fuels. In addition, such a tax would raise privacy concerns if calculating and collecting the tax required the government to track people’s movement and use of vehicles. Apart from those challenges, a VMT tax would have implications for equity that are similar to those of fuel taxes—namely, the burden, relative to income, would be greatest for lower-income households because the money paid in taxes for highway use would constitute a larger share of their total income than of higher-income households’ total income.
Limiting a VMT tax to only commercial trucks would raise fewer of those concerns. Because many trucking companies already track their vehicles, implementing a VMT tax on only commercial trucks would require overcoming fewer administrative and privacy hurdles than implementing such a tax on all vehicles would.
To establish a truck VMT tax, lawmakers would have to consider three sets of questions:
- Which types of trucks would be subject to the tax? On which roads would travel be subject to the tax?
- What would the rates be for different types of trucks and for different roads?
- How would the tax be assessed? And how would payments be made?
Establishing and operating a program to collect a VMT tax on commercial trucks would entail not only costs to set up the program, including capital costs for new equipment, but also ongoing administrative and enforcement costs that are likely to be higher than the costs to administer fuel taxes. Whereas gasoline and diesel taxes can be administered at low cost because they are collected from a small number of firms, a VMT tax would be collected from truck owners and thus would have a larger share of its gross revenues offset by implementation costs.9
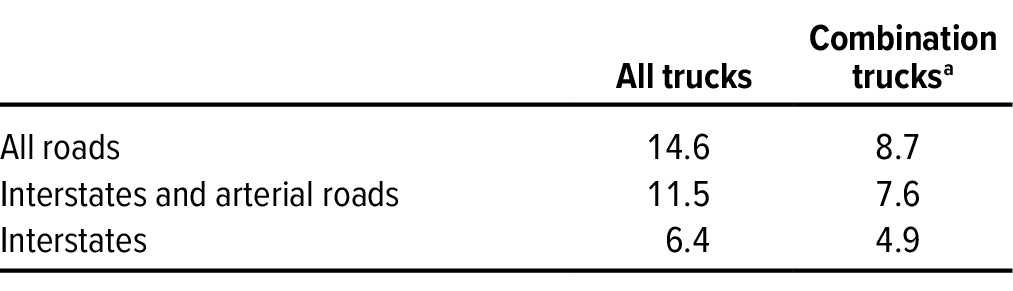
In a 2019 analysis, CBO considered the effects on revenues of several possible formulations of a VMT tax on commercial vehicles.10 One example, updated for 2022 truck traffic volumes, suggests that if a tax of 5 cents per mile traveled by trucks had been in place in 2022, it would have generated between $5 billion and $15 billion in revenues that year, depending on the types of trucks and roads that the tax applied to. If a per-mile tax had been applied to all commercial trucks (including box trucks and large pickup trucks) on all roads, each additional cent of tax would have generated $3 billion that year. If, instead, the tax had been applied only to combination trucks, it would have generated less than that amount. Similarly, if the tax had been applied only to travel on Interstates or on Interstates and arterial roads, receipts would have been smaller (see Table 1).
Table 1.
Estimated Annual Revenues From a VMT Tax of 5 Cents per Mile If One Had Been in Place in 2022
Billions of dollars
Data source: Congressional Budget Office. See www.cbo.gov/publication/59634#data.
VMT = vehicle miles traveled.
a. Tractors pulling one or more trailers.
Those estimated revenues do not account for the reductions in receipts from income and payroll taxes that would result from the VMT tax. When estimating the effects of legislative proposals that would raise excise tax revenues, CBO and JCT apply an offset—a calculated value to account for those reductions—that varies over time, depending on tax rates and economic projections. In calendar year 2023, the offset is 24 percent.11
Institute a Tax or Fee on Electric Vehicles. Under current law, drivers of electric vehicles pay little or no federal or state fuel taxes. (EVs include plug-in hybrid vehicles, which combine a gasoline engine with a battery-powered electric motor that can be recharged by plugging it into an external electricity source, as well as all-electric vehicles, which run solely on battery power.) Many states have begun charging owners of EVs an annual fee, typically in the range of $50 to $200.
In 2022, about 3 million plug-in electric cars and light trucks were on the road—a number that represents 1 percent of the stock of light-duty vehicles.12 (EVs are expected to make up a growing share of light-duty vehicle sales in coming years, but the stock of vehicles is replaced slowly—the average age of passenger vehicles driven in the United States is 12 years.) If in 2022 the federal government had charged an annual EV fee of $100—comparable to the average amount that drivers of light-duty vehicles would have paid in federal fuel taxes that year—it would have raised about $300 million, CBO estimates, using data from the Energy Information Administration. Even with substantial growth in EV sales, a $100 annual EV fee would result in an annual average of $2 billion in revenues credited to the Highway Trust Fund over the 2024–2033 period.13 If owners of plug-in hybrids were exempt from the EV tax (so that they did not have to pay both that tax and the tax on gasoline), receipts from the tax would be smaller.
CBO’s estimate of revenues from a tax or fee on electric vehicles does not account for two factors. One is that imposing such a tax would reduce taxable business and individual income. The resulting reductions in receipts from income and payroll taxes would not affect the Highway Trust Fund, but in the overall budget, they would partially offset the amount of money collected from the new tax. In addition, the estimate does not account for the cost of the administrative and auditing systems required to collect the tax. The development of such a framework would take time and funding, as would the necessary outreach to owners of electric vehicles.
Transfer General Revenues. Since 2008, lawmakers have transferred $275 billion in revenues to the Highway Trust Fund. Most recently, in September 2021, the IIJA authorized a transfer of $90 billion to the highway account and a transfer of $28 billion to the transit account. Further transfers could supplement the revenues collected from the excise taxes dedicated to highway and transit programs. In CBO’s 10-year baseline projections, outlays from the highway account and from the transit account exceed the accounts’ respective balances and the revenues credited to them in 2028. In the highway account, the cumulative shortfall over the 2024–2033 period is projected to be $181 billion; in the transit account, it is projected to be $60 billion.
Continuing to use general revenues to fund federal highway spending has two advantages. First, if taxes were increased to pay for highway programs, the incremental costs of collection would be negligible because income taxes and other broad-based taxes are already in place. Second, compared with several of the other options for increasing the amounts credited to the Highway Trust Fund, funding highways through broad-based taxes would not impose a larger burden, relative to income, on lower-income households.
That approach also has some disadvantages. If spending on other programs was reduced to pay for highway programs, the benefits of highway investments would be at least partially offset by a reduction in the benefits that would have been provided by that other spending. If, instead, lawmakers chose to pay for highway programs by taking on additional debt, less money would be available for private investment; a reduction in private investment would slow economic growth in the long term.14 Finally, continuing to use general revenues to fund highway spending further decouples that spending from the user charges that pay for it. That decoupling not only reduces incentives to drive less and to conserve fuel but also reduces or eliminates any gains in fairness and efficiency that result from a system in which users pay for the benefits they receive.
Federal Support for State, Local, and Private Financing of Highways
In addition to providing grants from the Highway Trust Fund, the federal government supports investment in highways by state and local governments through several financing programs that subsidize the costs that those governments incur when they borrow to pay for such spending. From 2007 to 2016, the federal government subsidized an average of $23 billion (in 2023 dollars) per year of state and local governments’ new financing of highway projects through tax-preferred bonds, direct loan and loan guarantee programs, and funds used to capitalize state infrastructure banks.15 That federally subsidized financing constituted about 20 percent of total public spending on capital over that period. Tax-exempt bonds accounted for about three-quarters of that borrowing.
In the case of tax-exempt bonds, federal support takes the form of forgone federal tax revenues. But other mechanisms for providing that support appear as spending in the federal budget, including direct-pay tax credit bonds and direct federal credit programs such as the Transportation Infrastructure Finance and Innovation Act (TIFIA) program. TIFIA provides credit assistance to state and local governments that is primarily for highway and mass transit infrastructure, although it can be used for a broad range of surface transportation projects. Spending for the TIFIA program comes out of the Highway Trust Fund.
Financing allows state and local governments to pay for highways and other infrastructure over a period that more closely matches the useful life of that infrastructure. Financing can be particularly attractive when a government does not have the resources on hand that are required to fund a desired investment. However, financing is not a source of revenues; it is a means of making future state and local revenues—including taxes or tolls, or other user fees—available to pay for projects sooner. When future revenues are committed to paying back funds that are borrowed today, they may allow state and local governments to avoid delays that would otherwise result from the need to accumulate funds, but those revenues will not be available to pay for other projects in the future.
In some instances, public entities have used public-private partnerships to obtain financing to give them more flexibility to pursue projects. Such partnerships may allow public entities to avoid delays that would otherwise be involved in accumulating the necessary public funds or to work around limits that exist on public borrowing by state and local governments. Between 1991 and 2016, the value of such partnership contracts for highway projects amounted to about 2 percent of all public spending on highways.16 Highway partnerships have shortened design and building phases and lowered costs, albeit not in all cases and by small amounts, on average. Some partnerships have resulted in bankruptcies for the private partners, canceled projects, or unfavorable outcomes for the public partner because of poorly written contracts or a loss of public control over the project. As with projects paid for with other forms of financing, projects financed with private financing are ultimately paid for with taxes or user fees.
1. Congressional Budget Office, “Details About Baseline Projections for Selected Programs: Highway Trust Fund Accounts” (May 2023), www.cbo.gov/publication/51300. CBO’s baseline budget projections reflect the assumption that current laws governing taxes and spending generally do not change. Some of the taxes that are credited to the Highway Trust Fund are scheduled to expire on September 30, 2028, including the taxes on tires and all but 4.3 cents of the federal tax on motor fuels. However, under the rules governing baseline projections, CBO’s estimates reflect the assumption that all the expiring taxes credited to the fund will continue to be collected after fiscal year 2028.
2. Congressional Budget Office, “Senate Amendment 2137 to H.R. 3684, the Infrastructure Investment and Jobs Act, as Proposed on August 1, 2021” (August 5, 2021, revised August 9, 2021), www.cbo.gov/publication/57406. Budget authority, or funding, is the authority provided by federal law to incur financial obligations that will result in immediate or future outlays of federal funds.
3. Federal Highway Administration and Federal Transit Administration, Status of the Nation’s Highways, Bridges, and Transit: Conditions and Performance, 24th ed. (2021), www.fhwa.dot.gov/policy/24cpr/. The $61 billion estimate is based on the sum of the $54.7 billion (in 2016 dollars) reported in Exhibit 10-2 of the agencies’ report for investments modeled in FHWA’s Highway Economic Requirements System (HERS) and the $14.3 billion (in 2016 dollars) reported in Exhibit 10-15 for investments modeled in the National Bridge Investment Analysis System (NBIAS). The resulting $69.0 billion sum for federal and state spending was adjusted upward to $78.7 billion to account for system enhancements not included in those models. That adjustment was based on the HERS and NBIAS estimates accounting for 86 percent of the total investment. To calculate total federal spending over the period under that scenario, CBO applied an estimate of the federal government’s average share of capital spending on federal-aid highways from 2006 to 2016—56 percent. CBO then used the GDP price index to convert the result, which was in 2016 dollars, to nominal dollars.
4. Ibid. The $99 billion estimate is based on the $126.7 billion (in 2016 dollars) in total average annual spending on federal-aid highways such a scenario would require, as reported in Exhibit 7-6 of that report. CBO estimates that the federal government contributed 56 percent of capital spending on federal-aid highways from 2006 to 2016. It arrived at that estimate by comparing the federal government’s share of capital spending on federal-aid highways for the years reported in Exhibit 2-9 of that report with total capital outlays for federal-aid highways reported for those years in Exhibit 2-17. To convert the federal amount over the 2024–2033 period from 2016 dollars to nominal dollars, CBO used the GDP price index.
5. Ibid., Exhibits 10-4 and 10-5.
6. In accordance with the rules governing baseline projections specified in the Balanced Budget and Emergency Deficit Control Act of 1985, CBO’s baseline for surface transportation revenue reflects the assumption that all the expiring taxes credited to the Highway Trust Fund will continue to be collected after fiscal year 2028.
7. Federal Highway Administration, Addendum to the 1997 Federal Highway Cost Allocation Study Final Report (May 2000), Tables 4 and 6, www.fhwa.dot.gov/policy/hcas/addendum.cfm.
8. Oregon Department of Administrative Services, Office of Economic Analysis, Highway Cost Allocation Study, 2019–2021 Biennium (prepared by ECONorthwest, 2019), www.oregon.gov/das/oea/pages/hcas.aspx.
9. Gasoline and diesel taxes are assessed at roughly 1,300 fuel distribution terminals nationwide, and the number of distinct firms operating those terminals is much smaller. Internal Revenue Service, “Terminal Control Number (TCN)/Terminal Locations Directory” (accessed October 10, 2023), https://go.usa.gov/xV5PB.
10. Congressional Budget Office, Issues and Options for a Tax on Vehicle Miles Traveled by Commercial Trucks (October 2019), www.cbo.gov/publication/55688.
11. Joint Committee on Taxation, Income and Payroll Tax Offsets to Changes in Excise Tax Revenues for 2023–2033, JCX-2-23 (February 22, 2023), www.jct.gov/publications/2023/jcx-2-23/.
12. Energy Information Administration, Annual Energy Outlook 2023 (March 2023), Table 39, www.eia.gov/outlooks/aeo/.
13. For projections of EV sales and vehicle stock, see David Austin, Modeling the Demand for Electric Vehicles and the Supply of Charging Stations in the United States, Working Paper 2023-06 (Congressional Budget Office, September 2023), www.cbo.gov/publication/58964.
14. Congressional Budget Office, Effects of Physical Infrastructure Spending on the Economy and the Budget Under Two Illustrative Scenarios (August 2021), www.cbo.gov/publication/57327, and The Macroeconomic and Budgetary Effects of Federal Investment (June 2016), www.cbo.gov/publication/51628.
15. Congressional Budget Office, Federal Support for Financing State and Local Transportation and Water Infrastructure (October 2018), www.cbo.gov/publication/54549.
16. Congressional Budget Office, Public-Private Partnerships for Transportation and Water Infrastructure (January 2020), www.cbo.gov/publication/56003.
This testimony updates information in Congressional Budget Office, Reauthorizing Federal Highway Programs: Issues and Options (May 2020), www.cbo.gov/publication/56346. The testimony was prepared by Chad Shirley with guidance from Joseph Kile and with contributions from Nathan Musick, Robert Reese, and Joshua Shakin. In keeping with CBO’s mandate to provide objective, impartial analysis, the testimony makes no recommendations.
Phillip L. Swagel and Jeffrey Kling reviewed the testimony, Bo Peery edited it, and R. L. Rebach created the graphics and prepared the text for publication. The testimony is available on CBO’s website at www.cbo.gov/publication/59634.