
Notes
All years referred to are federal fiscal years, which run from October 1 to September 30 and are designated by the calendar year in which they end. Numbers in the text and tables may not add up to totals because of rounding.
The Center for Medicare & Medicaid Innovation (CMMI) was created by the Affordable Care Act (ACA) in 2010. It conducts pilot programs, known as models, that test new ways to deliver and pay for health care in Medicare, Medicaid, and the Children’s Health Insurance Program, with the goal of identifying approaches that reduce spending or improve the quality of care.
In this report, the Congressional Budget Office presents findings from its analysis of CMMI’s activities during the first decade of operation and uses those findings to update its projections of CMMI’s effects on federal spending. The report explains changes to CBO’s analytic method based on those findings and discusses the agency’s revised approach to estimating the effects of legislative proposals that would change CMMI’s models or operations. CBO previously estimated that CMMI’s activities would reduce net federal spending but now estimates that they increased that spending during the first 10 years of the center’s operation and will continue to do so in its second decade.
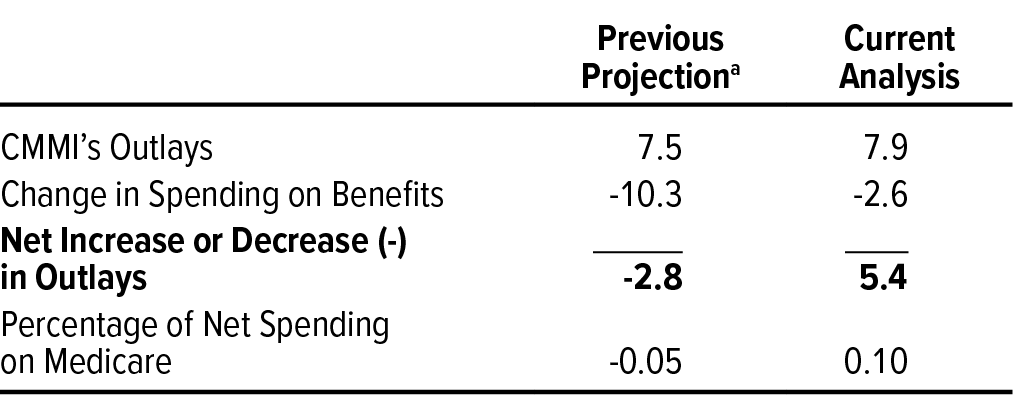
CBO currently estimates that CMMI’s activities increased direct spending by $5.4 billion, or 0.1 percent of net spending on Medicare, between 2011 and 2020.1 (Most of CMMI’s models have focused on Medicare beneficiaries.) Specifically, CMMI spent $7.9 billion to operate models, and those models reduced spending on health care benefits by $2.6 billion. The estimates reflect CBO’s review of published evaluations of 49 models initiated over CMMI’s first decade as well as corresponding historical budget data.
By contrast, in 2010, when the ACA was enacted, CBO projected that CMMI would produce net savings over the 2010–2019 period.2 Extending that earlier approach to the 2011–2020 period, which spans the first full decade of CMMI’s operation, yields an estimated net reduction of $2.8 billion in federal spending, or 0.05 percent of net spending on Medicare during those years. That estimate reflects a projection that CMMI’s models would lower spending on benefits by $10.3 billion, more than offsetting the $7.5 billion that CMMI would spend to operate those models.
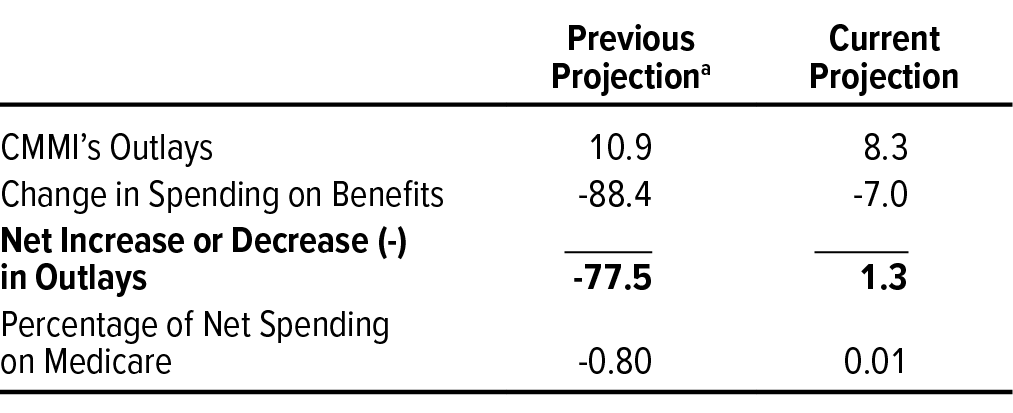
Looking ahead, CBO currently projects that CMMI’s activities will increase net federal spending by $1.3 billion, or 0.01 percent of net spending on Medicare, over the center’s second decade, which extends from 2021 to 2030. If CBO used its 2010 approach instead, it would estimate net savings of $77.5 billion, or 0.8 percent of net spending on Medicare, in the second decade of the center’s operation. The difference between CBO’s current projections for the second decade and projections using its 2010 approach largely reflects an update in the agency’s expectation about the rate at which CMMI will identify and expand models that reduce spending. For the period spanned by CBO’s current baseline projections, 2024 to 2033, CBO projects that CMMI will increase net federal spending by less than $50 million.3
CBO’s current projections for CMMI’s second decade draw on the net increases in spending that occurred during the center’s first decade of operations and also reflect the expected accumulation of savings in the second decade from both previously and newly certified models. CBO’s findings about the budgetary effects of CMMI’s activities over the first decade and its updated projections are subject to considerable uncertainty.
In estimating the budgetary effects of legislation that would change CMMI, CBO evaluates each proposal individually. In general, legislative proposals fall into one of three categories: changes to specific models, modifications to the parameters within which CMMI operates, and repeal of CMMI’s statutory authority and rescissions of the agency’s funding. CBO’s estimates reflect its overall view of CMMI’s effects on federal spending for both administrative operations and benefits.
CBO will continue to monitor CMMI’s activities and will refine its approach as new information becomes available.
CMMI’s Models and Funding
The Center for Medicare & Medicaid Innovation has broad authority to implement models that aim to improve quality of care or reduce spending on services provided by Medicare, Medicaid, and the Children’s Health Insurance Program.4 So far, most of CMMI’s models have focused on Medicare beneficiaries. CBO expects that trend to continue.
By statute, CMMI is required to evaluate the effects of its models. Specifically, models are evaluated by their ability to improve quality of care without increasing spending or to decrease spending without lowering quality of care. The Department of Health and Human Services (HHS) may expand models nationwide if the Secretary determines that either criterion is met and that such an expansion would not limit a program’s benefits. In addition, expansion requires the chief actuary of the Centers for Medicare & Medicaid Services (CMS) to certify that an expansion would either reduce a program’s spending or not result in any increase. Estimating the effect of CMMI’s activities on quality of care is beyond the scope of this report.
In 2011, CMMI received $10 billion in mandatory funding under the ACA to identify, develop, test, and evaluate models.5 (Mandatory funding is not provided through the annual appropriation process.) It received its second $10 billion in funding in 2020 and will receive an additional $10 billion in each subsequent decade. Those funding amounts do not grow with inflation. However, CMMI’s funding is subject to sequestration, which reduced the amount provided in 2020 by $590 million and will reduce funding for 2030 by $570 million.6
CMMI uses that funding to pay its expenses—for example, employees’ salaries—and to pay for the operations that support its models, such as evaluating the models and providing websites for model participants. The Medicare trust funds are used to pay providers for medical services furnished to Medicare beneficiaries, as well as for bonus payments, such as those that reward providers for meeting quality or other metrics, like reducing hypertension among beneficiaries.
When a model is certified and expanded, it remains a CMMI model unless it is codified in legislation or regulation. At that point, CMMI’s administrative spending on the model would decrease but continue—for example, to maintain online access for the model’s participants.
CBO’s Current Analysis and Previous Projections of CMMI’s Effects on Federal Spending, 2011 to 2020
CBO analyzed model evaluations and data from CMMI’s first decade of operation to understand how the center’s spending on different activities affected federal spending. The current analysis covers CMMI’s activities from 2011 to 2020, beginning with the center’s first $10 billion in funding in 2011. When the ACA was enacted, CBO estimated the effects of CMMI’s activities on federal spending over the 2010–2019 period.
Current Analysis of the Budgetary Effects of CMMI’s Activities
CBO’s current analysis of evaluations of CMMI’s models indicates that the center’s activities (including its operations and the effects of the models that it conducted) increased net federal spending by $5.4 billion, or 0.1 percent of net spending on Medicare, between 2011 and 2020. The agency estimates that CMMI spent $7.9 billion over its first decade to conduct those models (including spending on its employees, model infrastructure, and evaluations) and that the center’s models reduced spending on benefits by $2.6 billion (see Table 1).
Table 1.
Estimated Budgetary Effects of CMMI’s Activities, 2011 to 2020
Billions of Dollars
Data source: Congressional Budget Office. See www.cbo.gov/publication/59274#data.
CMMI = Center for Medicare & Medicaid Innovation.
a. CBO’s original estimate of the net budgetary effects of CMMI’s activities spanned the years 2010 to 2019, which was the projection period in place at the time the Affordable Care Act was enacted. This estimate uses the same analytic approach as that earlier analysis but is shifted forward one year to cover the years spanned by CBO’s current analysis.
CBO’s Current Approach. To estimate the net budgetary effect of CMMI’s activities in its first decade, CBO analyzed evaluations (those published before July 2023) of the models the center initiated during that decade. For each model, CBO reviewed either the final evaluation—usually an independent analysis commissioned by CMMI at the end of the test period—or an interim evaluation if a final evaluation was not available. CBO identified each model’s net effect on federal spending in the first decade and then summed the effects of all the evaluations to estimate CMMI’s total net budgetary effect from 2011 to 2020—a net cost of $5.4 billion—including its outlays and the models’ effects on spending for benefits.7
Separately, CBO used historical budget data to identify the contribution of CMMI’s administrative spending to the total $5.4 billion increase in net federal spending, as distinguished from increases or decreases in benefit payments. Those data show that the center spent $7.9 billion implementing models over the 2011–2020 period. CBO then estimated the change in spending on benefits generated by CMMI’s models as the difference between the total net budgetary effect of the center’s activities and CMMI’s actual outlays. Subtracting those outlays ($7.9 billion) from CBO’s estimate of the net budgetary effect of CMMI ($5.4 billion) yielded an estimated decrease in spending on benefits of $2.6 billion.
From 2011 to 2020, CMMI initiated 49 models with published evaluations. Six of those models generated statistically significant savings.8 Four have been certified for expansion by CMS’s chief actuary and the Secretary of HHS.9 Certified models include the Pioneer Accountable Care Organization (ACO) model, the Medicare Diabetes Prevention Program, the Home Health Value-Based Purchasing model, and the Prior Authorization of Repetitive, Scheduled Non-Emergent Ambulance Transport model (see Table 2).10
Table 2.
CMMI’s Models That Have Been Certified for Expansion

Data source: Congressional Budget Office.
ACO = accountable care organization; CMMI = Center for Medicare & Medicaid Innovation.
a. Centers for Medicare & Medicaid Services, Evaluation of CMMI Accountable Care Organization Initiatives: Pioneer ACO Evaluation Findings From Performance Years One and Two (prepared by L&M Policy Research, March 2015), https://innovation.cms.gov/files/reports/pioneeracoevalrpt2.pdf.
b. Center for Medicare & Medicaid Innovation, 2022 Report to Congress (December 2022), https://tinyurl.com/yrxzcvj8 (PDF).
c. Maria L. Alva and others, “Impact of the YMCA of the USA Diabetes Prevention Program on Medicare Spending and Utilization,” Health Affairs, vol. 36, no. 3 (2017), pp. 417–424, https://tinyurl.com/yuurzh3h.
d. Thomas J. Hoerger and others, Evaluation of the Medicare Diabetes Prevention Program: Second Evaluation Report (submitted by RTI International to the Centers for Medicare & Medicaid Services and the Center for Medicare & Medicaid Innovation, November 2022), https://tinyurl.com/cbvwmkv8 (PDF).
e. Center for Medicare & Medicaid Innovation, 2022 Report to Congress (December 2022), https://tinyurl.com/yrxzcvj8 (PDF).
f. Centers for Medicare & Medicaid Services, Medicare Prior Authorization Model for Repetitive, Scheduled Non-Emergent Ambulance Transports: Status Update (October 19, 2021), https://tinyurl.com/5y82vpwt (PDF).
Uncertainty of CBO’s Estimates. CBO’s estimate of the net budgetary effect of those models between 2011 and 2020 is subject to uncertainty because of several factors. Some of those factors would tend to make CBO overestimate the net increase in federal spending during the first decade of CMMI’s operation. For example, the agency’s analysis did not capture savings that might have accrued to Medicare through its permanent ACO program, known as the Medicare Shared Savings Program. Although that program is not part of CMMI’s activities, its design has been informed by the experience of ACOs that the center has operated (see Box 1).
Box 1.
Accountable Care Organizations in the Medicare Fee-for-Service Program
Accountable care organizations (ACOs) are groups of providers that voluntarily assume responsibility for the quality and costs of care for a defined group of patients. Medicare’s ACOs were launched in 2012 following the enactment of the Affordable Care Act and currently operate under two parallel mechanisms in Medicare’s fee-for-service (FFS) program. The first is the Medicare Shared Savings Program (MSSP), the permanent ACO program in Medicare. The second is composed of the various ACO models that the Center for Medicare & Medicaid Innovation (CMMI) has developed and operated. In 2023, 39 percent of all beneficiaries enrolled in Medicare’s FFS program were in a Medicare ACO.1
Evaluating the Financial Performance of ACOs
Assessments of ACOs generally use two distinct methods to estimate Medicare’s savings or costs: Either they calculate the difference between the ACOs’ spending and their administratively set spending target, known as a benchmark, or they compare changes in spending among beneficiaries attributed to ACOs with changes in spending among a control group of beneficiaries not attributed to an ACO. (Attribution is the process of defining the population of beneficiaries that ACO providers are accountable for and is generally based on beneficiaries’ use of primary care services.)
The Congressional Budget Office puts considerably more weight on the results of studies and evaluations that use the second method to determine the effect of ACOs on Medicare spending. It is based on a quasi-experimental approach, which compares spending for ACO-attributed beneficiaries with an estimate of what spending for those beneficiaries would have been if those providers did not participate in the ACO. By contrast, benchmarks are not intended to approximate counterfactual spending for the beneficiaries attributed to an ACO. Rather, they reflect the design of the ACO model and are a tool for encouraging providers to participate and to reduce spending. That means that an ACO could generate savings as measured against a benchmark but generate no savings—or even have net costs—relative to an estimate of how spending would have evolved among an ACO’s patient population if the ACO had never formed.
Effects of ACOs on Medicare Spending
CBO reviewed evidence on the performance of Medicare’s ACOs, including the MSSP and the ACO models operated by CMMI, and found mixed results. For the MSSP, CBO largely relied on peer-reviewed literature that used a counterfactual approach to evaluate the program’s effect. Those studies generally found that the MSSP was associated with small net budgetary savings. For instance, a study that examined the performance of ACOs in the MSSP in 2015—the program’s third performance year—found that physician-led ACOs generated $256 million in net savings to Medicare but that hospital-led ACOs generated $112 million in net costs to Medicare.2
The Medicare Payment Advisory Commission (MedPAC) and the Centers for Medicare & Medicaid Services (CMS) have both evaluated the effects of the MSSP. MedPAC estimated that, by 2016, spending on Medicare benefits for beneficiaries attributed to the MSSP grew by 1 percentage point to 2 percentage points less than spending among a control group of beneficiaries, but that estimate omitted the offsetting costs associated with shared savings payments.3 CMS concluded that ACOs in the MSSP were associated with less spending—by roughly 0.5 percent, or about $1.75 billion—on Medicare Parts A and B in 2016, after accounting for shared savings payments across the entire population of FFS beneficiaries.4 However, because that estimate includes potential spillover effects, such as changes in the delivery of services to beneficiaries not aligned with an ACO, it is challenging to compare it with estimates from peer-reviewed literature.
More recent evidence on the effects of the MSSP on Medicare spending using a counterfactual approach is limited; some researchers attribute that to the increasingly difficult task of finding a reasonable control group to use in evaluations of the program. Specifically, the operation of many payment models, both in Medicare’s FFS program and among other payers, makes it difficult for evaluators to identify a comparison group of providers who are not participating in other models, according to those researchers.5 CBO found only one study that estimated more recent effects of the MSSP: an industry-sponsored study that found that the program reduced net spending on Medicare by $150 million in 2017.6
The extent of savings generated by the MSSP is also subject to some debate because of concerns about provider selection. Providers who initially participate in the program and continue to do so may be those who are most likely to achieve savings. CBO reviewed three studies that used varying methods to adjust for provider selection. Two of those studies found that estimated savings were sensitive to those adjustments, and one found they were not.7
To assess the effect of ACO models operated by CMMI, CBO reviewed official evaluations from the center. Of the five ACO models the agency reviewed, two were associated with small net decreases in Medicare spending, and three were associated with small net increases in spending.8 One of those models, the Pioneer ACO model, was certified for expansion in 2015 by CMS’s Office of the Actuary and became part of the MSSP.9
1. Centers for Medicare & Medicaid Services, “CMS Announces Increase in 2023 in Organizations and Beneficiaries Benefiting From Coordinated Care in Accountable Care Relationship” (press release, January 17, 2023), https://tinyurl.com/539n7p6d.
2. See J. Michael McWilliams and others, “Medicare Spending After 3 Years of the Medicare Shared Savings Program,” New England Journal of Medicine, vol. 379, no. 12 (September 2018), pp. 1139–1149, https://doi.org/10.1056/NEJMsa1803388. For other studies’ estimates, see J. Michael McWilliams, “Changes in Medicare Shared Savings Program Savings From 2013 to 2014,” JAMA, vol. 316, no. 16 (October 2016), pp. 1711–1713, http://dx.doi.org/10.1001/jama.2016.12049; Carrie H. Colla and others, “Association Between Medicare Accountable Care Organization Implementation and Spending Among Clinically Vulnerable Beneficiaries,” JAMA Internal Medicine, vol. 176, no. 8 (August 2016), pp. 1167–1175, https://tinyurl.com/5ppdh2ra; and J. Michael McWilliams and others, “Early Performance of Accountable Care Organizations in Medicare,” New England Journal of Medicine, vol. 374, no. 24 (June 2016), pp. 2357–2366, http://dx.doi.org/10.1056/NEJMsa1600142.
3. Medicare Payment Advisory Commission, “Assessing the Medicare Shared Savings Program’s Effect on Medicare Spending,” in Report to the Congress: Medicare and the Health Care Delivery System (June 2019), pp. 177–201, https://tinyurl.com/mr37rrjc (PDF).
4. Medicare Program; Medicare Shared Savings Program; Accountable Care Organizations—Pathways to Success and Extreme and Uncontrollable Circumstances Policies for Performance Year 2017, 83 Fed. Reg. 68049 (December 31, 2018), www.federalregister.gov/d/2018-27981/p-1973.
5. Amol S. Navathe, Connor W. Boyle, and Ezekiel J. Emanuel, “Alternative Payment Models—Victims of Their Own Success?” JAMA, vol. 324, no. 3 (June 2020), pp. 237–238, https://tinyurl.com/mrxe8yzj; Medicare Payment Advisory Commission, “Streamlining CMS’s Portfolio of Alternative Payment Models,” in Report to the Congress: Medicare and the Health Care Delivery System (June 2021), p. 59, https://tinyurl.com/mvzhrwtp (PDF); and J. Michael McWilliams and Alice J. Chen, “Understanding the Latest ACO ‘Savings’: Curb Your Enthusiasm and Sharpen Your Pencils—Part 1,” Health Affairs Forefront (November 12, 2020), https://tinyurl.com/4p4fus3d.
6. Allen Dobson and others, 2017 Update: MSSP Savings Estimates, Program Financial Performance 2013–2017 (submitted by Dobson DaVanzo Health Economics Consulting to National Association of ACOs, November 2019), https://tinyurl.com/2vrrj8cr (PDF).
7. See Mariétou H. Ouayogodé and others, “Estimates of ACO Savings in the Presence of Provider and Beneficiary Selection,” Healthcare, vol. 9, no. 1 (March 2021), https://tinyurl.com/ycydknp6; Adam A. Markovitz and others, “Performance in the Medicare Shared Savings Program After Accounting for Nonrandom Exit: An Instrumental Variable Analysis,” Annals of Internal Medicine, vol. 171, no. 1 (July 2019), pp. 27–36, https://doi.org/10.7326/M18-2539; and J. Michael McWilliams and others, “Savings or Selection? Initial Spending Reductions in the Medicare Shared Savings Program and Considerations for Reform,” Milbank Quarterly, vol. 98, no. 3 (September 2020), pp. 847–907, https://doi.org/10.1111/1468-0009.12468.
8. Those models were the Pioneer ACO model, Advance Payment ACO model, Next Generation ACO model, ACO Investment model, and Comprehensive ESRD Care Initiative. No performance results were currently available for the ACO Realizing Equity, Access, and Community Health (ACO REACH) model, which had its first performance year in 2023. CMMI also operated the Vermont All-Payer ACO model, but it is not exclusively focused on the Medicare program.
9. Centers for Medicare & Medicaid Services, “Certification of Pioneer Model Savings” (April 10, 2015), https://tinyurl.com/yc38ndfu (PDF).
Other factors might have led CBO to underestimate the net increase in federal spending associated with CMMI’s activities in its first decade of operation. For example, CBO used official model evaluation reports to determine the net effect of a model on federal spending. To the extent that those evaluations failed to capture some of CMMI’s outlays, such as those for general overhead or other centerwide activities, CBO’s analysis would underestimate net increases in direct spending.
Additional sources of uncertainty in CBO’s analysis do not clearly point the agency toward an overestimate or underestimate of the budgetary effects of CMMI. For instance:
- Final evaluations typically include many results, which differ in their methodological approaches. Although CBO focused on results that were estimated with the most comprehensive measures of Medicare and Medicaid spending and that used methodologically rigorous calculations, selecting one result for each model involved some judgment. Still, other external researchers have found results that are qualitatively similar to CBO’s results.11
- The statistical precision of the estimates for each model is uncertain. To attain the most complete information, CBO included results from each model evaluation, regardless of its sample size or statistical precision, to estimate the total for all models. That method is more likely to reduce the potential for bias in CBO’s estimate of the total budgetary effects of CMMI than a method that excluded estimates with small effects or that was based on small sample sizes, which would occur if estimates that did not meet conventional levels of statistical significance were omitted.
- In addition, the existence of CMMI may have led to some broader systemwide changes in the delivery of health care that are not attributable to a specific model.12 Those changes may have led to increases or decreases in federal health care spending and are not reflected in CBO’s estimates.
Previous Projection of the Budgetary Effects of CMMI’s Activities
CBO’s current estimate of the budgetary effects of CMMI can be compared with the agency’s previous projection. When the ACA was enacted, CBO estimated that CMMI would reduce federal spending by $1.3 billion, on net, over the 2010–2019 projection period used at that time.13 Extending that approach to the 2011–2020 period that spans the first full decade of CMMI’s operation—the period CBO used for its current analysis of CMMI—yields an estimated net reduction in federal spending of $2.8 billion, or 0.05 percent of net spending on Medicare. That estimate reflects CBO’s previous expectation that CMMI’s models would lower spending on benefits by $10.3 billion, which would more than offset the estimated $7.5 billion in outlays by CMMI to operate those models.
In CBO’s earlier analysis, the agency projected outlays for operating CMMI’s models that were similar to actual outlays in the historical budget data, differing by about 5 percent ($7.5 billion in projected outlays versus $7.9 billion in actual outlays). However, under CBO’s previous approach, the projection of CMMI’s effect on spending for benefits in its first decade is four times the estimate of that effect in CBO’s current analysis (a reduction in spending of $10.3 billion versus $2.6 billion now).
CBO’s previous method for projecting the change in federal spending involved considerable uncertainty because the agency lacked data on and experience with CMMI.14 At the time, CMMI was a new entity with considerable flexibility in the types of models it chose and in their modes of implementation. Rather than predict the performance of CMMI’s individual models, CBO estimated that, on the whole, CMMI would tend to identify models that reduced spending and then expand those models to produce greater savings over time. CBO used available research on the history of Medicare’s demonstration projects before the creation of CMMI to estimate the effect of the center’s activities on federal spending.15
CBO has identified a few possible reasons that its previous approach yielded a reduction in benefit spending that was too large. First, the agency had forecast that savings would increase over time as CMMI identified more models that reduced spending and expanded them at a steady rate. However, CBO’s analysis found that after the first two of CMMI’s models were certified, the rate at which certification occurred declined over time.
Second, nearly every model that CMMI has launched has made providers’ participation voluntary. Although providers generally prefer voluntary models, such models may be less likely to achieve budgetary savings because providers can choose to participate only in models in which they anticipate favorable financial outcomes for themselves. Those models also allow providers who incur losses to drop out, which can diminish federal savings. In addition, CMMI may need to change a voluntary model to retain participants. Doing so could reduce the likelihood of savings because such changes would probably make the terms of participation more favorable to providers. CMMI’s leadership is aware that voluntary participation may create selection bias and has expressed interest in exploring the possible benefits of mandatory participation.16
Lastly, CBO did not anticipate the extent to which the proliferation of CMMI’s models, sometimes within the same health care systems, would create conflicting incentives for providers and thus weaken the potential for a given model to produce savings. Changes in payment policies outside of CMMI’s authority may also make it challenging for a model’s participants to develop a cohesive strategy in organizing their delivery of services. CMMI’s leadership has acknowledged the complexities posed by overlapping models and has announced plans to streamline the center’s portfolio.17
CBO’s Current and Previous Projections of CMMI’s Effects on Federal Spending, 2021 to 2030
Because CMMI receives a mandatory appropriation every 10 years, CBO estimated the budgetary effects of CMMI’s activities for its second decade, 2021 to 2030, which differs from the 2024–2033 period spanned by CBO’s current baseline projections. CBO’s estimate for 2021 to 2030 draws on the first decade of CMMI’s operation while incorporating ways in which CBO expects CMMI’s future activities to differ from those in its first decade.
Current Projection of the Budgetary Effects of CMMI’s Activities
In CBO’s current projection, CMMI’s activities increase net federal spending by $1.3 billion, or 0.01 percent of net spending on Medicare, in the center’s second decade of operation (2021 to 2030). Specifically, CBO projects, CMMI will spend $8.3 billion to operate its models, and those models will reduce spending on benefits by $7.0 billion (see Table 3). During CMMI’s second decade, CBO expects that the center will shift from incurring net annual budgetary costs to generating net annual budgetary savings as the number of certified models that produce savings grows over time.
Table 3.
Estimated Budgetary Effects of CMMI’s Activities, 2021 to 2030
Billions of Dollars
Data source: Congressional Budget Office. See www.cbo.gov/publication/59274#data.
CMMI = Center for Medicare & Medicaid Innovation.
a. This estimate applies the same approach used in CBO’s estimate of CMMI’s effects at the time the Affordable Care Act was enacted to the 2021–2030 period spanned by the agency’s March 2020 baseline projections.
To construct its current projection of CMMI’s net effect on federal spending over the 2021–2030 period, CBO estimated the net budgetary effects of models operating during that decade. CBO did not predict the specific models that will operate in the second decade but considered two broad categories of models:
- Certified models are those initiated and certified for expansion in CMMI’s first decade and continuing to operate throughout the second decade, as well as those initiated in the first or second decade and certified in the second decade.
- Noncertified models are those terminated within CMMI’s second decade, as well as those initiated in the later years of the second decade and operating beyond the end of the decade before reaching certification or termination.
Certified models continue beyond the projection period in which they were initiated, in CBO’s projections, and the agency expects them to continue to reduce spending. In general, CBO expects the average new model initiated during the projection period to tend to increase federal spending during that period and then be canceled or to continue and decrease spending in subsequent decades.
CBO projects that CMMI’s administrative spending in the second decade will be about the same as it was in the first decade. Because CMMI’s $10 billion mandatory appropriation does not increase over time to account for the effects of inflation, CBO expects CMMI to scale back some of its activities so that its spending does not exceed its appropriation in future decades. Under that approach, CMMI’s projected administrative outlays in the second decade are only slightly greater than observed outlays in the first decade.
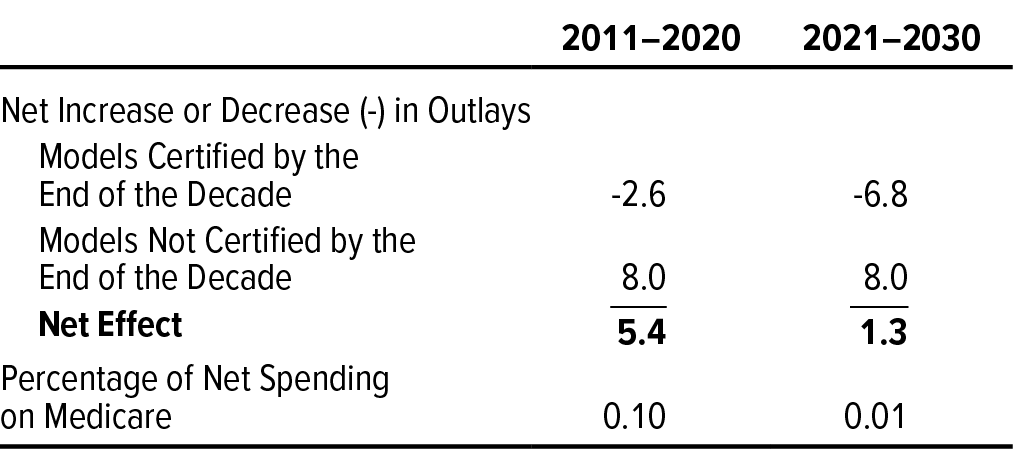
CBO expects certified models to continue to reduce spending on benefits in the second decade and estimates that, as a group, they will do so by $6.8 billion, on net, over that period, compared with $2.6 billion over the first decade (see Table 4). In projecting the effects of certified models in the second decade, CBO included both the ongoing net budgetary effects of models that were certified in the first decade and the net budgetary effects of models that CBO expects will be newly certified in the second decade. Projected net savings in the second decade are greater than those in the first decade because more models will be certified and because CBO expects that models certified in the first decade will operate and produce savings for a full 10 years in the second decade as opposed to fewer than 10 years in the first decade.
Table 4.
Estimated Budgetary Effects of CMMI’s Models, by Certification Status
Billions of Dollars
Data source: Congressional Budget Office. See www.cbo.gov/publication/59274#data.
CMMI = Center for Medicare & Medicaid Innovation.
CBO expects that the net budgetary effects of noncertified models in the second decade will generally be similar to the effects of noncertified models from the center’s first 10 years—accounting for $8.0 billion in increased net spending per decade. CBO expects similar effects in the second decade because it projects that the amount CMMI spends to test models will be similar to the amount it spent during the first decade, with similar effects on spending on benefits for models that do not end up getting certified.
Different scenarios point toward budgetary effects over the period that could be larger or smaller than the projected net increase of $1.3 billion. For example, CMMI might achieve larger net budgetary savings in its second decade by drawing on the lessons from past models when designing new ones and adjusting ongoing models. CMMI might also achieve larger savings in its second decade if it made quicker decisions to terminate models that were not generating savings after their intermediate evaluations, or if it reduced the potential for selective participation by shifting from voluntary to mandatory models.
Under certain scenarios, however, CMMI could achieve smaller savings than projected in its second decade. For example, CMMI may have already implemented a large share of the universe of possible models whose designs are more likely to achieve savings. Those models may have already targeted the most easily addressable drivers of health care spending for providers, therefore making similar savings over the next decade more challenging to achieve. In addition, in its second decade CMMI may prioritize models that are designed to achieve its nonfinancial objectives, such as improved quality of care or health outcomes.18
Previous Projection of the Budgetary Effects of CMMI’s Activities
Applying the approach CBO used in 2010 to project the budgetary effects of CMMI’s activities produces an estimate of $77.5 billion in net savings, or 0.8 percent of net spending on Medicare, over the 2021–2030 period.19 That estimate reflects a projection that CMMI’s models would lower Medicare’s spending on benefits by $88.4 billion, which would more than offset the $10.9 billion in CMMI’s outlays for its operations.
CBO’s previous projections of the change in federal spending involved considerable uncertainty because the agency lacked data on and experience with CMMI. In its earlier analysis, CBO expected that CMMI would identify more models that reduced spending as it tested more models over time. CBO further anticipated that CMMI would expand those models while terminating others whose intermediate results showed increased spending, thereby increasing overall savings to the federal government. However, in CBO’s assessment, the number of models that generated savings did not increase over time. Of the four models that have been certified for expansion by CMS’s chief actuary and the Secretary of HHS, only one has been certified since 2018.
CBO’s Current Projection of CMMI’s Effects on Federal Spending, 2024 to 2033
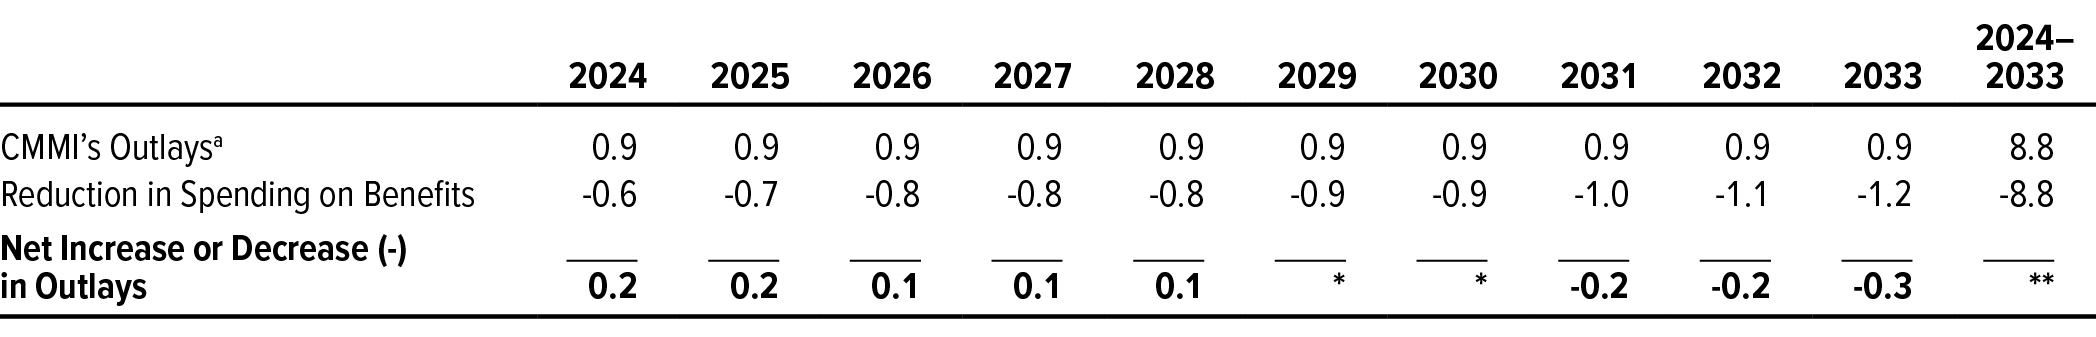
In addition to projecting the effects on federal spending of CMMI’s operation in its second decade, CBO projected those effects over the current projection period, 2024 to 2033 (see Table 5). That projection uses the same approach outlined above but includes the first three years of CMMI’s third decade of operation. During the current projection period, the estimated effect of CMMI’s activities on federal spending transitions from an annual net increase to an annual net decrease. That transition reflects the ongoing growth in the number of certified models that continue to produce savings over time, as described above. Despite that transition, CBO estimates, CMMI would still increase net federal spending between 2024 and 2033 but by less than $50 million.
Table 5.
Estimated Budgetary Effects of CMMI’s Activities, 2024 to 2033
Billions of Dollars
Data source: Congressional Budget Office. See www.cbo.gov/publication/59274#data.
CMMI = Center for Medicare & Medicaid Innovation; * = between -$50 million and zero; ** = between zero and $50 million.
a. CMMI received $10 billion in budget authority in 2011 and 2020. It is scheduled to receive an additional $10 billion in 2030. The 2020 and 2030 budget authority is subject to mandatory sequestration, which reduced that amount by $590 million in 2020 and will reduce it by $570 million in 2030.
Estimating the Effects of Legislative Proposals to Change CMMI
CBO estimates the budgetary effects of legislative proposals to change CMMI by analyzing the details of each bill and reviewing available evidence. For example, to estimate the effects of legislation that would alter an existing model, CBO analyzes information from interim evaluations of the model’s effect on federal spending. In other instances, when data on a specific model are unavailable, CBO relies on a more general framework for estimating the effects of legislation. In both instances, those effects are measured relative to CBO’s baseline projections of CMMI’s operations and spending on benefits.
Legislative proposals that would affect CMMI generally fall into one of three categories:
- Modifications to specific models,
- Changes to the parameters within which CMMI operates, or
- Repeal of CMMI’s statutory authority or rescissions of unobligated funding.
Modifications to Specific Models
CBO’s analysis of legislation that would affect specific models depends in large part on the details of the legislation and on CBO’s understanding of the specified model. At the outset, CBO reviews available evidence about the effects of the model. For example, an interim evaluation of the model or an analysis by external researchers may provide the agency with a basis for estimating how a particular model affects federal spending.
If the evidence indicates that a model reduces federal spending, then legislation to delay or terminate it will tend to increase federal spending. For example, in 2016, CMMI proposed a model to modify payment rates for prescription drugs covered under Medicare Part B. CBO expected the model to reduce Medicare spending on the basis of its design and evidence from outside analyses, as well as CBO’s own prior work on similar policies. In that case, the agency had a basis to estimate the budgetary outcome of that specific model and thus could also estimate the budgetary effects of legislation that would have prevented its implementation.20 In another instance, CBO estimated that legislation to expand certified models more rapidly than projected under current law would tend to reduce federal spending. Thus, the agency estimated a reduction in spending from legislation that expanded and codified the Prior Authorization of Repetitive, Scheduled Non-Emergent Ambulance Transport model as a part of the Medicare statute.21
CBO also reviews available evidence about changes proposed in legislation, focusing on how they would affect participation in the model, utilization of medical services, and any special payments under the model, such as bonus payments. For example, legislation that would tend to make a model more generous by increasing bonus payments could increase participation and reduce the likelihood that the project would achieve savings after those larger payments were considered. Another possible change to a model would be to make participation mandatory instead of voluntary for certain providers. Mandatory participation may be more likely to achieve federal savings, but CBO’s estimate of the budgetary effects of changing participation requirements would depend on the details of the legislation and of the model.
Sometimes, CBO lacks data on how a change to a model would affect federal spending and thus has little basis on which to develop an estimate. For example, some models test new payment approaches for which no evidence exists. For legislation that would delay implementation of models for which there is no evidence, CBO relies on a more general approach. In those cases, CBO uses its baseline projection of the effects on federal spending of new models initiated in the projection period. Such models are expected to increase net federal spending during that time, just as new models did in the first decade of CMMI operations. Thus, the agency tends to expect that legislation delaying those models would tend to decrease federal spending over the projection period. The magnitude of that effect would depend in part on the details of the legislation.
Changes to the Parameters Within Which CMMI Operates
CMMI has broad authority to waive certain requirements under titles 11, 18, and 19 of the Social Security Act when testing different models. The center may use that flexibility to refine its models and identify approaches that reduce spending, as well as to expand successful projects that are certified. Legislation could change the parameters within which CMMI operates in ways that would affect many or all of the center’s models.
When estimating the effect of those types of legislation, CBO considers whether the policy would cause CMMI to operate differently. In particular, CBO focuses on two things: whether the change would cause CMMI to undertake more or fewer activities, and whether those activities would be more or less likely to reduce federal spending relative to current law. For example, CMMI might have to change its activities under proposed legislation that would restrict the expansion of certified projects or require rulemaking when waiving certain parts of the Social Security Act. Limiting CMMI’s ability to expand certified projects would reduce the likelihood of decreasing federal spending and thus would tend to increase deficits. Requiring notice-and-comment rulemaking could cause CMMI to undertake fewer models—but it also might not do that, because it already follows that rulemaking process in many instances. If such a requirement did reduce the number of models CMMI operated, or the scope of those models, CBO would estimate both the number of activities that CMMI would no longer undertake within the projection period and the budgetary effect of forgoing those activities.
Repeal of CMMI’s Statutory Authority or Rescissions of Unobligated Funding
Legislation to eliminate or change CMMI’s statutory authority or funding could change its activities and affect federal spending. If proposed legislation would repeal CMMI’s statutory authority, CBO would analyze two main effects:
- First, CMMI would stop operating noncertified models and would no longer initiate new ones. It would also stop outlays on its activities. CMMI’s spending on noncertified projects over the projection period is expected to result in a net increase in spending, and thus stopping those projects would probably decrease spending.
- Second, some of CMMI’s models that have been certified for expansion might be discontinued, but others might be able to continue because they have been made permanent through either regulation or legislation and thus no longer need the statutory authority of CMMI to continue. Certified projects tend to decrease federal spending, on average, and thus discontinuing some or all of them would tend to increase federal spending.
The net effect of those factors could have a positive or negative budgetary effect and would depend on the details of the legislation.
Other legislation could rescind some or all of CMMI’s funding, without changing its authority to initiate models. Estimating the effects of such legislation would be challenging because of the way CMMI receives its funding and because of its spending to date. CMMI receives $10 billion in funding (less any amount deducted for sequestration) every 10 years. It spent $7.1 billion of its first $10 billion mandatory appropriation before receiving another $9.4 billion in 2020. Any unspent funding remains available until expended.
If some of CMMI’s funding was rescinded, CBO would analyze the effects by comparing the amount of the rescission with the amount of funding that the agency projects CMMI would not obligate from its existing resources before it received its next decennial mandatory appropriation. (CBO currently expects CMMI to have about $3 billion in unobligated funding when it receives its next appropriation in 2030; that estimate could change over time.) If the rescission was less than that amount, then the reduction in funding would probably have little or no effect on outlays within the 10-year projection period, because it would not change CMMI’s expected spending before it received its next appropriation. Alternatively, if a rescission was larger than CBO’s estimate of unobligated funding before the next appropriation took effect, CBO would expect CMMI to reduce its spending on activities within the projection period.
It is unclear which activities CMMI would reduce and how that would affect spending on benefits. However, CBO expects that CMMI would tend to continue spending on certified models because those models are projected to reduce spending. Likewise, CBO expects that CMMI would be more likely to decrease spending on models that have not yet been launched, because those models may not yet have participants invested in them. How CMMI chose to allocate a reduction in spending across those two groups of models would have different effects on net spending on benefits and would depend on the size of the reduction and the details of the legislation.
CBO continues to monitor CMMI’s activities and will update its estimates of the budgetary effects of its operations as more information becomes available. As part of that process, CBO will share its findings, as it has done in this report.
1. Direct spending (also called mandatory spending) is generally governed by statutory criteria and is not normally constrained by the annual appropriation process.
2. See Congressional Budget Office, letter to the Honorable Nancy Pelosi providing an estimate for H.R. 4872, the Reconciliation Act of 2010 (March 20, 2010), p. 26, www.cbo.gov/publication/21351.
3. CBO’s baseline projections describe what the federal budget would look like in the current year and over the next 10 years if existing laws governing taxes and spending generally remained unchanged.
4. See 42 U.S.C. § 1315a (2018). Medicare and Medicaid have both operated experimental projects, often known as “demonstrations,” since before the enactment of the ACA. An existing infrastructure of Medicaid demonstrations, often implemented through waivers under section 1115 of the Social Security Act, predates the creation of CMMI. The HHS Secretary has also had longstanding authority to initiate demonstrations in the Medicare program, although with more restrictions than CMMI has.
5. In 2010, CMMI also received $5 million in mandatory funding under the ACA. See Sec. 3021 of the Patient Protection and Affordable Care Act, Public Law 111-148 (codified at 42 U.S.C. § 1315a(f)(1) (2018)).
6. The Budget Control Act of 2011 (P.L. 112-25) reinstituted procedures set forth in the Balanced Budget and Emergency Deficit Control Act of 1985 (the Deficit Control Act, P.L. 99-177) to automatically reduce funding provided for certain mandatory programs from 2013 through 2021. Subsequent legislation extended the cuts through 2031.
7. Evaluations of models that affected Medicaid spending include changes in both federal and state Medicaid spending. CBO applied an adjustment to those evaluations’ findings so that estimates included in this report reflect only the changes in federal Medicaid spending.
8. Two of those models generated statistically significant net savings to Medicare but have not been certified for expansion. They are the Accountable Care Organization Investment model and the Medicare Care Choices model. The official evaluations of those models showed cumulative net savings of $0.3 billion and $0.03 billion, respectively. See Center for Medicare & Medicaid Innovation, 2022 Report to Congress (December 2022), https://tinyurl.com/yrxzcvj8 (PDF); Centers for Medicare & Medicaid Services, Evaluation of the Accountable Care Organization Investment Model: Final Report (prepared by Abt Associates, September 2020), https://tinyurl.com/48tkshj8 (PDF); and Center for Medicare & Medicaid Innovation, Evaluation of the Medicare Care Choices Model: Annual Report 4 (prepared by Mathematica, April 2022), https://tinyurl.com/2v3z9xy9 (PDF).
9. See Centers for Medicare & Medicaid Services, “CMMI Model Certifications” (September 6, 2023), https://tinyurl.com/b9hr93fr. When one of those models—the Medicare Diabetes Prevention Program—was certified, an evaluation of it showed that it had generated net savings to Medicare. However, a more recent evaluation completed after the model’s certification suggests that the program has not led to any significant changes in Medicare expenditures.
10. In 2015, CMS certified the Pioneer ACO Model for expansion by incorporating some of its elements into the Medicare Shared Savings Program, which is not administered through CMMI. CBO’s estimate of the budgetary effects of CMMI in its first decade includes the budgetary effects of the Pioneer ACO Model for 2012 and 2013—the years covered by the model’s evaluation—as well as estimated effects of the model in subsequent years, including years after parts of the model were incorporated into the Medicare Shared Savings Program.
11. Ekemini Isaiah and others, “Analysis of CMMI Models Projects Costs Rather Than Savings,” Avalere (August 25, 2022), https://tinyurl.com/4x34v6ub; Jennifer Podulka and Yamini Narayan, Center for Medicare and Medicaid Innovation: Findings From Medicare Models To-Date (Health Management Associates, June 2021), https://tinyurl.com/y4p98nfw; and Brad Smith, “CMS Innovation Center at 10 Years—Progress and Lessons Learned,” New England Journal of Medicine, vol. 384 (February 2021), pp. 759–764, http://dx.doi.org/10.1056/NEJMsb2031138.
12. Studies have found that the Comprehensive Care for Joint Replacement model resulted in similar treatment outcomes among populations not covered by Medicare’s fee-for-service program. See Alice J. Chen and others, “The Extent of Externalities From Medicare Payment Policy,” American Journal of Health Economics, vol. 8, no. 2 (Spring 2022), pp. 181–215, https://doi.org/10.1086/718769; and Liran Einav and others, “Randomized Trial Shows Healthcare Payment Reform Has Equal-Sized Spillover Effects on Patients Not Targeted by Reform,” Proceedings of the National Academy of Sciences, vol. 117, no. 32 (August 2020), pp.18939–18947, https://doi.org/10.1073/pnas.2004759117.
13. See Congressional Budget Office, letter to the Honorable Nancy Pelosi providing an estimate for H.R. 4872, the Reconciliation Act of 2010 (March 20, 2010), p. 26, www.cbo.gov/publication/21351.
14. See the testimony of Mark Hadley, Deputy Director, Congressional Budget Office, before the House Budget Committee, CBO’s Estimates of the Budgetary Effects of the Center for Medicare & Medicaid Innovation (September 7, 2016), p. 3, www.cbo.gov/publication/51921.
15. See Lyle Nelson, Lessons From Medicare’s Demonstration Projects on Disease Management and Care Coordination, Working Paper 2012-01 (Congressional Budget Office, January 2012), www.cbo.gov/publication/42924, and Lessons From Medicare’s Demonstration Projects on Value-Based Payment, Working Paper 2012-02 (Congressional Budget Office, January 2012), www.cbo.gov/publication/42925.
16. Centers for Medicare & Medicaid Services, Innovation Center Strategy Refresh (October 2021), https://tinyurl.com/bddz2npp (PDF).
17. Ibid.
18. Although CMMI’s recent announcements appear to align with those aims, its priorities could shift with changes in its administration and leadership. Such potential shifts in priorities contribute to the uncertainty in CBO’s projections. See Centers for Medicare & Medicaid Services, Innovation Center Strategy Refresh (October 2021), https://tinyurl.com/bddz2npp (PDF).
19. That estimate applies the same approach used in CBO’s estimate of CMMI’s effects at the time the ACA was enacted to the 2021–2030 period spanned by the agency’s March 2020 baseline projections.
20. Congressional Budget Office, cost estimate for H.R. 5122, a bill to prohibit further action on the proposed rule regarding testing of Medicare Part B prescription drug models (October 4, 2016), www.cbo.gov/publication/52087.
21. Congressional Budget Office, cost estimate for H.R. 1021, the Protecting the Integrity of Medicare Act of 2015 (March 16, 2015), www.cbo.gov/publication/50037. The provisions of that bill were enacted as part of a larger piece of legislation, the Medicare Access and CHIP Reauthorization Act of 2016.
This report, which is part of the Congressional Budget Office’s continuing effort to make its work transparent, explains how CBO analyzes the budgetary effects of the Center for Medicare & Medicaid Innovation. In keeping with CBO’s mandate to provide objective, impartial analysis, the report makes no recommendations.
Michael Cohen, Cornelia Hall, Rachel Matthews (formerly of CBO), and Lara Robillard wrote the report, with contributions from Jessica Hale and Katie Zhang and with guidance from Berna Demiralp, Paul Masi (formerly of CBO), and Sarah Masi. Chad Chirico, Carrie H. Colla (formerly of CBO), Tamara Hayford, Leo Lex (formerly of CBO), and Chapin White offered comments. Margot Berman, Fiona Forrester (formerly of CBO), Robert Lindsay, Kaylee Nielson, Joyce Shin, Joshua Varcie, and Katie Zhang fact-checked the report.
Jeffrey Kling and Robert Sunshine reviewed the report. Rebecca Lanning edited it, and Jorge Salazar created the tables and prepared the text for publication.
The report is available at www.cbo.gov/publications/59274. CBO seeks feedback to make its work as useful as possible. Please send comments to communications@cbo.gov.

Phillip L. Swagel
Director