
At a Glance
Flooding is expected to increase in the future as the effects of climate change increase. In this report, the Congressional Budget Office examines how projected flood risk varies across communities with different economic and demographic characteristics in two multiyear projection periods, one centered on 2020 and the other centered on 2050.
In the 2020 projection period (generally capturing current conditions), the prevalence of flood risk is 9 percent—that is, 9 percent of properties face at least a 1 percent annual probability of experiencing a flood of a depth of roughly 1 foot or more, CBO estimates. A 1 percent annual probability is equivalent to having about a one-in-four chance of experiencing at least one such flood over a period of 30 years. In the 2050 projection period, 10 percent of properties face that risk. Projections of flood risk are uncertain, and CBO aims to provide projections that are in the middle of a range of possible outcomes.
By CBO’s estimates, flood risk varies with communities’ characteristics in the following ways:
- Median household income. In general, projected flood risk is more prevalent in communities in which median household income is lower. Communities in which the majority of householders are Hispanic or Latino are an exception: In such communities, flood risk tends to be less prevalent where median household income is lower. (A householder is a person in whose name a housing unit is owned or rented.)
- Race. Risk is more prevalent in communities with a greater share of White householders, but communities in which most householders are Black (except for those in which the median household income is high) face the largest increases in flood risk from 2020 to 2050.
- Ethnicity. The percentage of properties exposed to flood risk is generally smaller in communities with a greater share of householders who are Hispanic or Latino.
- Type of residence. Flood risk is much more prevalent in communities in which the majority of the dwellings are secondary residences than it is in communities in which most dwellings are primary residences. The difference is larger in coastal areas than in inland areas. In communities with a greater share of renters, projected flood risk is less prevalent.
- Composition of household. In communities in which a greater share of households include someone age 65 or older, projected flood risk is more prevalent. Projected risk is less prevalent in communities with a greater share of households with children.
- Geographic location. The percentage of properties exposed to flood risk in coastal communities is more than twice that in inland communities, and coastal communities are projected to have greater increases in risk from 2020 to 2050. Of all the communities CBO analyzed, coastal communities in which the majority of dwellings are secondary residences have the highest percentage of properties exposed to flood risk.
Because of the nature of the available data, this report cannot identify causes of those variations across communities’ characteristics. Those causes may be complex and multifaceted because they involve questions of where people settle and why, and where governments invest in adaptive infrastructure and why.
Flood risk is unevenly distributed across communities in the United States and will be in the future as the prevalence of that risk increases with a changing climate. In this report, the Congressional Budget Office examines how the prevalence of projected flood risk in two periods varies with the economic and demographic characteristics of communities. CBO measured the prevalence of projected flood risk as the percentage of properties facing at least a 1 percent annual probability of experiencing a flood of a depth of roughly 1 foot or more. Because of the nature of the available data, this report cannot identify causes of the variation in communities’ prevalence of projected flood risk. Those causes may be complex and multifaceted because they involve questions of where people settle and why, and where governments invest in adaptive infrastructure and why.
The flood model used in this report generates projections for time periods rather than specific years, and each projection period is centered on a year. The projections used for this report are centered on 2020 and 2050 and were generated for a single emissions scenario—an intermediate one that corresponds to an increase in global average temperature of 1.2 degrees Celsius by 2050, relative to the average over the 1986–2005 period. The projections account for four sources of flooding—sea level rise, storm surge (water pushed ashore by winds of a storm, whether or not the storm makes landfall), rainfall, and overflowing rivers and streams—and for existing adaptive infrastructure.
CBO measured community characteristics for the United States using economic and demographic data for block groups—the smallest geographic areas for which such data are available. Those data reflect underlying information, which is not publicly available, about individual households (the people usually residing in a housing unit) or individual householders (people in whose name a housing unit is owned or rented, or, if such a person is not present, any household members who are at least 15 years old). The data on community characteristics are for the 2016–2020 period. (For explanations of the terminology used in this report, see Appendix A; for details about the data and CBO’s method, see Appendix B.)
Flood Risk in the United States
There are roughly 145 million properties—residential, commercial, industrial, agricultural, or governmental, for instance—in the United States, some of which are vacant. In this report, CBO considers those properties to be at risk of flooding if they have at least a 1 percent annual probability of experiencing a flood of a depth of at least 1 foot.
Share of Properties Projected to Be at Risk of Flooding in the United States
Percent

In the 2020 projection period, 9.1 percent of the properties in the United States face at least a 1 percent annual probability of experiencing a flood of a depth of at least one foot. The share of properties at risk increases to 10.1 percent by 2050.
How CBO Measured Communities’ Flood Risk
CBO examined the distribution of flood risk across communities in the United States according to specific economic and demographic characteristics: median household income, the race of householders in a community, their ethnicity, the composition of their households, whether they used their property as a primary or secondary residence, and whether they rented or owned their residence. In addition, CBO examined whether patterns of risk by characteristic differed for coastal and inland communities.
The agency used two methods to compare the risk across communities. In one, CBO grouped communities into quintiles (or fifths) according to the distribution of households with that characteristic; in the other, the agency grouped communities according to the characteristic of the majority of householders. In all cases, although communities are described by characteristics of households or householders, risk was projected for properties. (The number of properties and the number of households are not necessarily the same because some properties are used for purposes other than residential, and some are vacant.)
The economic and demographic information used in this analysis is available only at the community level, but the model generates projections at the property level. Therefore, the properties at risk in any given quintile or majority group may or may not be occupied by a householder who has a particular characteristic.
By Quintile
To construct the quintiles used in this report, CBO ordered all communities by their share of households with a specific characteristic and then divided the communities into five equal groups. The communities in the top quintile (one-fifth of all communities) have the largest shares of households with the characteristic. The communities in the bottom quintile have the smallest shares, and for some characteristics, communities in the lower quintiles have no households with that particular characteristic.
Calculating the Share of Properties at Risk of Flood by Quintile

Each small square represents a block group, or community, made up of between 240 and 1,200 households. The degree of shading in a square represents the share of households in the community with a specific characteristic.
After arraying the distribution of communities in order, CBO calculated the flood risk for each quintile.
By Majority
In some cases, many communities may have no households with a specific characteristic. When the number of such communities was sufficiently large, one or more of the quintiles have zero percent of households with that characteristic. In such cases, CBO supplements its quintile analysis by grouping communities according to the characteristic of the majority of householders in a given community and examining the flood risk of each group.
Flood Risk by Household Income
In this report, CBO distinguishes the economic characteristics of communities by comparing their median household incomes. Half of the households in a community have income that is lower than the median, and half of the households have income that is higher. CBO found that communities in which the median household income is lower have a larger share of properties exposed to flood risk. For communities of all income levels, the prevalence of risk is projected to increase by about 1 percentage point over the next 30 years.
Share of Properties Projected to Be at Risk of Flood, by Quintile of Median Household Income
Percent

Communities in which the median household income is less than about $41,000 per year have the highest prevalence of flood risk. In the 2020 period, 10.3 percent of properties in those communities are projected to be at risk; that share rises to 11.5 percent in the 2050 period.
By contrast, the share of properties projected to be at risk in communities in which the median household income is above roughly $99,000 per year is almost 30 percent lower in both 2020 and 2050. Over that period, the share of properties projected to be at risk in those communities increases from 7.3 percent to 8.2 percent.
Flood Risk by Race
CBO used the following racial groups in its analysis: Black, White, and some other race or multiracial. The last group consists of householders who identify as American Indian, Alaska Native, Asian, Native Hawaiian, Pacific Islander, some other race, or two or more races. Ethnicity was analyzed separately.
Quintile of Race
In both projection periods, the percentage of properties exposed to flood risk is greater among communities with a larger share of White householders. But communities with a smaller share of White householders face larger increases in the prevalence of flood risk over time. Communities in the top quintile of Black householders face the largest increase in the prevalence of flood risk by 2050.
Share of Properties Projected to Be at Risk of Flood, by Quintile of Race
Percent

In the top quintile of the distribution of White householders, 11.5 percent of properties are at risk of flooding in the 2020 period. In the bottom quintile, 7.6 percent are at risk. Communities in the bottom quintile, however, have a relatively large increase in the prevalence of risk between 2020 and 2050.
Communities in the top quintile of the distribution of Black householders have a relatively large increase in the prevalence of risk between 2020 and 2050. Within that quintile, communities with a larger share of Black householders face even greater increases in risk: In communities in which at least 70 percent of householders are Black, there is a 2.3 percentage- point increase in the prevalence of risk.
Flood risk is generally lower in communities with more householders who are some other race or multiracial, but in the top quintile, that trend reverses: Communities in the top quarter of that quintile have more prevalent risk than those in the fourth quintile.
Race of the Majority of Householders in a Community
In 95 percent of all communities, a majority of the householders are in one of the racial groups constructed for this analysis. White householders make up the majority in 82 percent, Black householders in 8 percent, and householders who identify as some other race or multiracial constitute the majority in 5 percent. The variation in flood risk among communities grouped by the majority of householders’ race is consistent with the variation among those grouped by quintiles. Because communities for which flood risk is relatively less prevalent in the 2020 period have greater increases in risk, differences in flood risk among racial groups are projected to diminish over time.
Share of Properties Projected to Be at Risk of Flood, by the Majority of Householders’ Race
Percent

In communities in which the majority of the householders are White, 9.3 percent of properties are at risk in the 2020 period. The share at risk is 7.7 percent in communities in which the majority of the householders are Black and 8.6 percent in communities in which the majority of the householders are some other race or multiracial. However, communities with a majority of Black householders face the largest increase in the prevalence of risk, 2.1 percentage points.
Race and Median Household Income
CBO also examined the prevalence of flood risk for communities grouped by the race of the majority of householders and their median income level. For communities in which the majority of householders are White, the percentage of properties exposed to flood risk is greater in lower-income communities than in higher-income ones. The same is true for communities in which most householders are Black and communities in which no racial group constitutes a majority. No clear pattern is evident for communities in which the majority of householders are some other race or multiracial.
Share of Properties Projected to Be at Risk of Flood, by the Majority of Householders’ Race and Median Household Income
Percent

Both for communities in which the majority of householders are White and for those in which the majority of householders are Black, risk is consistently less prevalent in communities with a higher median household income: Whether in the 2020 period or 2050 period, the share of properties exposed to flood risk is at least 3.2 percentage points lower in communities with a median household income higher than about $99,000 than it is in those with a median income lower than about $41,000.
Communities in which the majority of householders are Black, except in those with the highest median household income, face the largest increase in risk by 2050—the prevalence of risk in those communities grows by roughly 2 percentage points.
Flood Risk by Ethnicity
CBO arranged householders into two ethnic groups: those who identify as Hispanic or Latino and those who do not identify as Hispanic or Latino. For simplicity, this report refers to those groups as Hispanic and not Hispanic, respectively. Because race is not tied to ethnicity in the data, the two ethnic groups include householders from all racial groups.
Quintile of Ethnicity
The share of properties at risk is generally lower in communities with a greater share of householders who are Hispanic. Communities in all quintiles face a similar increase in the prevalence of flood risk between 2020 and 2050.
Share of Properties Projected to Be at Risk of Flood, by Quintile of Ethnicity
Percent
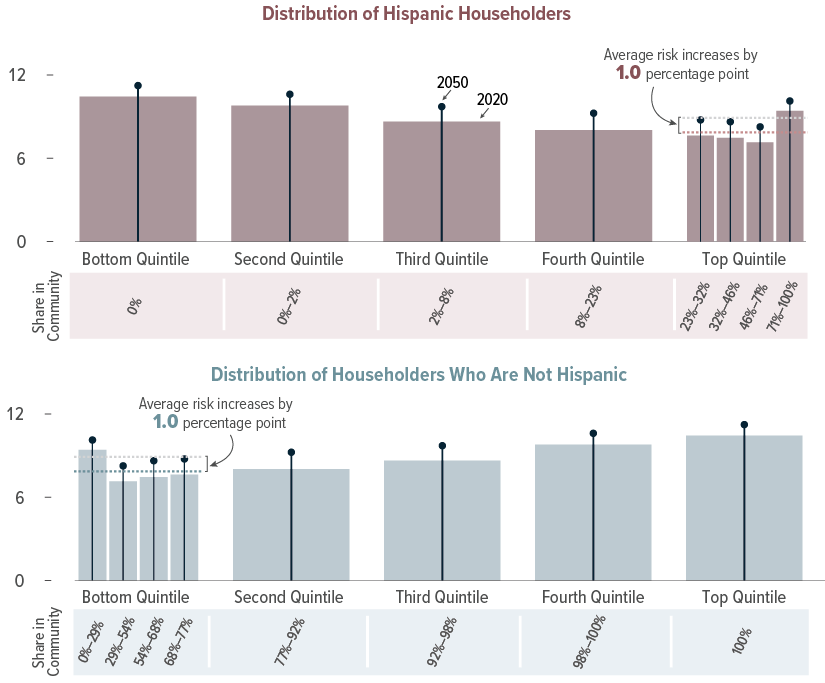
In communities in the bottom quintile for householders who are Hispanic (which corresponds to those in the top quintile for householders who are not), 10.4 percent of properties are at risk in the 2020 period. In the top quintile, 7.9 percent of properties are at risk. Within that quintile, however, the prevalence of risk does not conform to the general trend: Communities in which at least 71 percent of householders are Hispanic have a relatively large share of properties at risk in 2020, 9.4 percent.
All communities are projected to experience an increase in the prevalence of risk over time of about 1.0 percentage point.
Ethnicity of the Majority of Householders in a Community
Householders who identify as Hispanic make up a majority of householders in 9 percent of communities; those who do not identify as Hispanic make up a majority of householders in 91 percent of communities. The variation in flood risk among communities grouped by the majority of householders’ ethnicity is consistent with the variation among those grouped by quintiles, as is the increase in the prevalence of flood risk.
Share of Properties Projected to Be at Risk of Flood, by the Majority of Householders’ Ethnicity
Percent

The increase over time in the share of properties at risk is similar for both ethnic groups. In communities in which the majority of the householders are Hispanic, the share of properties at risk is 8.3 percent in the 2020 period and rises to 9.2 percent in the 2050 period. The share of properties at risk is larger in communities in which the majority of the householders are not Hispanic, 9.1 percent in 2020 and 10.1 percent in 2050.
Ethnicity and Median Household Income
CBO grouped communities on the basis of the majority of householders’ ethnicity to examine risk patterns by income. For communities in which the majority of householders are Hispanic, risk is generally more prevalent at higher levels of income; the pattern is reversed among communities in which the majority of householders are not Hispanic. The increase in the prevalence of risk from 2020 to 2050 is similar across most communities.
Share of Properties Projected to Be at Risk of Flood, by the Majority of Householders’ Ethnicity and Median Household Income
Percent

Among communities in which the median household income is above roughly $73,000, those in which most householders are Hispanic have a larger share of properties at risk than those in which most householders are not Hispanic. Among communities in which median household income is above roughly $99,000, the difference between communities with mostly Hispanic householders and those in which the majority are not Hispanic is roughly 3 percentage points.
Flood Risk by Type of Residence
CBO analyzed the correlation between the prevalence of flood risk and communities’ types of residences using two characteristics: whether residences were primary or secondary housing units and whether residences were rented or owned.
Primary or Secondary Residence
A primary residence serves as a householder’s only permanent residence; a secondary residence is used for seasonal, recreational, or occasional purposes. Most communities have no secondary residences. Only 1 percent of all communities in the United States are composed mostly of secondary residences, whereas 99 percent of communities are composed mostly of primary residences.
Flood risk is more prevalent in communities in which the majority of dwellings are secondary residences. Those communities are more often located along the coast, and flood risk is more prevalent in coastal communities than in inland communities. However, in both coastal and inland areas, communities made up mostly of secondary residences are more likely to be at risk than those made up mostly of primary residences.
Share of Properties Projected to Be at Risk of Flood Depending on Whether Most Residences in the Community Are Primary or Secondary
Percent

In the 2020 period, in communities in which the majority of the dwellings are secondary residences, 18.0 percent of properties are at risk of flooding, roughly double the share in communities in which the majority of the dwellings are primary residences. Communities composed mostly of secondary dwellings also face a larger increase in the prevalence of risk over time.
Renter or Owner Households
Flood risk tends to be less prevalent in communities with larger proportions of renters, but those communities also face the greatest increase in risk between the two projection periods.
Share of Properties Projected to Be at Risk of Flood, by Quintile of Renters
Percent

Although risk is generally less prevalent in communities with a larger share of renters, the share of properties at risk in the 2020 period is similar for communities in the bottom quintile and communities in the top quintile: 8.8 percent and 8.6 percent, respectively.
However, the communities in the top quintile are projected to experience the largest increase in risk over time. By 2050, communities in the top quintile have a greater prevalence of flood risk than those in the bottom quintile.
Flood Risk by Household Composition
To examine how flood risk varies across communities by household composition, CBO grouped households on the basis of whether they included a child or a resident age 65 or older—often a householder. CBO chose to examine those groupings because children and seniors are particularly vulnerable to disruptions caused by flooding in their community. The two categories are not mutually exclusive—that is, the presence of a senior in a household does not imply that there is not a child in the household.
Flood risk is more prevalent in communities with a larger proportion of households with a senior resident; the pattern is the opposite in communities in which a larger proportion of households include at least one child.
Share of Properties Projected to Be at Risk of Flood, by Quintile of Households With a Senior or a Child
Percent

In both projection periods, risk is more prevalent in communities with a larger proportion of households with a senior resident. The share of properties at risk in the top quintile is between 4 percentage points and 5 percentage points larger than that for the bottom quintile.
By contrast, risk is less prevalent in communities with a larger proportion of households that include a child. The prevalence of risk in those communities is between 5 percentage points and 6 percentage points smaller in the top quintile than in the bottom quintile.
The increase in the prevalence of risk from the 2020 period to the 2050 period is similar across most communities, about 1 percentage point, except in communities in which fewer than 18 percent of households include a child. Those communities face a 1.4 percentage-point increase over that span.
Flood Risk by Geographic Location
Overall, risk is more prevalent in coastal areas than in inland areas because the former have greater exposure to potential sources of flooding. But patterns of risk could differ in coastal and inland areas for some characteristics because of historical patterns of settlement and location of adaptive infrastructure. That is, the likelihood that people who are disadvantaged because of income, race, or ethnicity live in flood-prone properties might differ for coastal and inland areas. For most characteristics examined in this report, patterns of community risk are similar in both areas, but there are differences depending on the race of the majority of householders.
All told, the five states in which risk is most prevalent are West Virginia, Hawaii, Louisiana, Florida, and Mississippi. Risk is least prevalent in Arizona, Nevada, Colorado, the District of Columbia, and Michigan.
Median Household Income in Coastal and Inland Areas
For any given median household income quintile, the percentage of properties exposed to flood risk in coastal communities is significantly greater than it is in inland communities. But in both coastal and inland areas, that risk is larger in communities in which the median household income is lower.
Share of Coastal and Inland Properties Projected to Be at Risk of Flood, by Median Household Income
Percent

For any given income level, the share of properties at risk in coastal areas is two to three times greater than the share of properties at risk in inland areas.
The increase in risk between the two projection periods is also larger in coastal areas. Across income quintiles, on average, the share of those properties at risk rises by 3.7 percentage points, whereas the average share of properties at risk in inland communities increases by 0.6 percentage points.
Race in Coastal and Inland Areas
Coastal areas have more variation between racial groups in the share of properties at risk, and that variation increases by 2050. By contrast, inland areas have smaller differences in risk across communities defined by the majority racial group; those differences diminish slightly by 2050.
Share of Properties Projected to Be at Risk of Flood, by Location and the Majority of Householders’ Race
Percent

Across all communities defined by the majority of householders’ race, risk is roughly twice as prevalent in coastal communities as in comparable inland communities in the 2020 period. The ratio is generally the same in the 2050 period, except in communities in which most householders are Black. In those communities, risk in coastal areas is three times more prevalent than it is in inland areas.
The prevalence of risk in coastal communities with mostly Black householders increases by 10.0 percentage points between the two projection periods, to 26 percent. By 2050, those communities have the highest percentage of properties exposed to flood risk, surpassing the percentage in communities with mostly White householders.
Ethnicity in Coastal and Inland Areas
Flood risk is at least two times more prevalent in coastal areas than inland—both in communities in which the majority of householders are Hispanic and communities in which the majority are not Hispanic. In both areas, the share of properties at risk is larger in communities in which most householders are not Hispanic than it is in communities in which most householders are Hispanic, although the difference in risk is small.
Share of Properties Projected to Be at Risk of Flood, by Location and the Majority of Householders’ Ethnicity
Percent
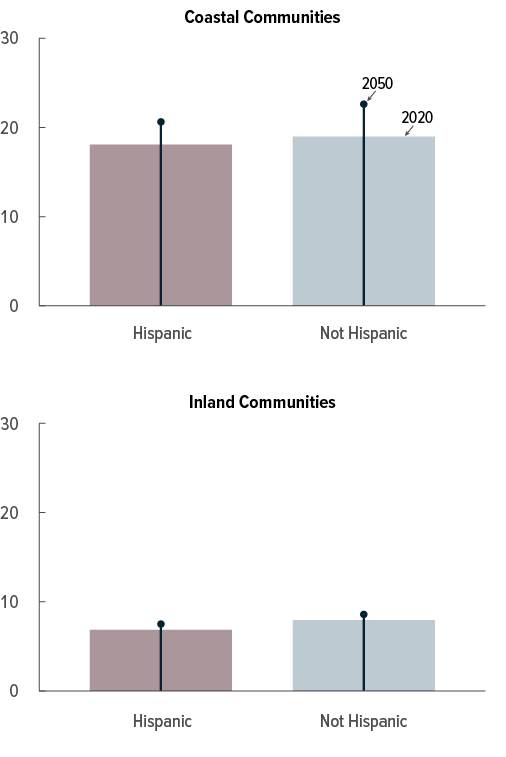
In the 2020 period, flood risk varies little between communities with a majority of Hispanic householders and communities with a majority of non-Hispanic householders. In both coastal and inland areas, the difference between the two groups is about 1 percentage point.
In the 2050 period, that difference is unchanged in inland areas but increases to 2.0 percentage points in coastal areas.
Primary and Secondary Homes in Coastal and Inland Areas
A higher percentage of coastal communities than inland communities are made up of mostly secondary residences, although the share is still small, at 3 percent. Coastal communities composed of mostly secondary residences have the largest prevalence of risk and the greatest increase in risk over time. In inland areas, risk is also more prevalent in communities composed mostly of secondary residences.
Share of Coastal and Inland Properties Projected to Be at Risk of Flood Depending on Whether Most Residences in the Community Are Primary or Secondary
Percent

In coastal areas in the 2020 period, the share of properties exposed to flood risk is 21.8 percentage points higher in communities that are made up mostly of secondary residences than it is in those composed mostly of primary residences. In the 2050 period, that difference climbs to 23.1 percentage points because coastal communities made up of mostly secondary residences see the greatest increase over time, 4.8 percentage points.
In inland areas in 2020, the prevalence of risk is 3.5 percentage points higher in communities made up mostly of secondary residences than it is in those composed mostly of primary residences. In 2050, that difference is 3.3 percentage points.
Appendix AGlossary
American Community Survey (ACS). A nationwide survey used to collect demographic, social, housing, and economic information every year by contacting a sample of addresses. The ACS replaced the decennial census long form. It currently produces one-year and five-year estimates for small areas, including census tracts and block groups.
block group. A statistical subdivision of a census tract. It generally contains between 600 and 3,000 people living in 240 to 1,200 housing units. A block group is the smallest geographic unit for which the Census Bureau tabulates sample data. Block groups are created to reflect largely homogeneous economic, demographic, and housing characteristics.
Census tract. A statistical subdivision of a county. Tract boundaries normally follow visible features such as rivers and roads but in some cases may follow legal boundaries and other features that are not visible. Census tracts generally contain between 1,200 and 8,000 people living in 480 to 3,200 housing units.
community. A block group identified in the 2020 census.
coastal community. A community that meets two criteria: One, the community is located in a county on the country’s saltwater coast; and two, it consists partly of water. Thus, coastal communities in this analysis either lie on one of the country’s saltwater coasts or are located in a county on the coast and contain at least part of another body of water, such as a river or a lake. (See Appendix B, “Geographic Location of Communities.”)
dwelling. A residential property.
flood risk. At least a 1 percent projected annual probability of experiencing a flood of a depth of roughly 1 foot or more. A 1 percent annual chance of flooding is the same as a 26 percent chance of experiencing at least one such flood over a period of 30 years.
household. Consists of all the people who occupy a housing unit as their usual place of residence.
householder. A person in whose name a housing unit is owned or rented. (If there is no such person present, any household member who is at least 15 years old can serve as the householder.)
housing unit. Any residential space that can be occupied as separate living quarters with access outside, either directly or through a common hall. A house, an apartment, a mobile home or trailer, a group of rooms, or a single room may be considered housing units. However, group living arrangements that are owned or managed by an entity that provides housing or services (such as college residence halls, skilled nursing facilities, and military barracks) are not considered housing units.
prevalence of flood risk. The percentage of properties facing at least a 1 percent annual probability of experiencing a flood of a depth of roughly 1 foot or more.
primary residence. A housing unit occupied by people who consider it their sole usual place of residence.
property. A parcel of land that may be used for residential, commercial, industrial, agricultural, governmental, or other purposes, such as educational or religious. (The data do not contain any information about types of structures, and structures are not necessarily present on each property.)
quintile. One of five equal-sized groups into which a population can be divided according to the distribution of values of a particular variable.
race and ethnicity. The Congressional Budget Office grouped householders on the basis of their self- identification as recorded in the ACS’s five-year estimates. For this analysis, the racial groups (Black, White, and some other race or multiracial) and the ethnic groups (Hispanic and not Hispanic) were constructed using the estimates for the 2016–2020 period. The racial categories specified in those estimates are American Indian and Alaska Native, Asian, Black or African American, Native Hawaiian and Pacific Islander, some other race, two or more races, and White. CBO used the composite group “some other race or multiracial” because of the small sizes of the groups of people who do not identify as Black or White. The ethnic groups specified in the ACS’s estimates were Hispanic or Latino and neither Hispanic nor Latino. For simplicity, this report refers to those groups as Hispanic and not Hispanic, respectively. Each racial category can include people of any ethnicity, and either ethnic group can include people of any race or combination of races.
secondary residence. A secondary residence is a housing unit for seasonal, recreational, or occasional use that, at the time of the census interview, is either vacant or occupied by people who have a primary residence elsewhere.
Appendix BData and Methods
The Congressional Budget Office relied on data and projections from the Census Bureau and from First Street Foundation (FSF) for its analysis of how projected exposure to the risk of flooding varies across communities with different economic and demographic characteristics. This appendix describes those data as well as CBO’s methods for assessing how the prevalence of projected flood risk over two projection periods varies with community characteristics. The flood risk projections were generated by FSF for one of the warming scenarios identified by the Intergovernmental Panel on Climate Change (IPCC).
Community Characteristics From the Census Bureau
The Census Bureau conducts a full census every 10 years, most recently in 2020, but it also contacts people at a sample of addresses annually to collect information about people and their households through the American Community Survey (ACS). From the survey responses, the Census Bureau produces five-year estimates of demographic, social, housing, and economic characteristics for small areas known as block groups, or communities, each of which contains between 600 and 3,000 people living in 240 to 1,200 housing units.
CBO used the ACS’s five-year estimates for the 2016–2020 period to determine the characteristics of communities.1 There are 242,335 block groups in the ACS estimates for 2016 to 2020, which use the block groups from the 2020 census. To protect privacy, however, the Census Bureau suppresses data on characteristics if a block group’s population is too small. That withholding of data occurs for 6 percent of block groups for median household income and 1 percent of block groups for the other characteristics examined in this report.
The most detailed information publicly available on community characteristics is measured at the block-group level. Within a given block group, CBO’s analysis cannot account for the specific locations of households with shared characteristics, so the analysis cannot capture potentially relevant variation in property-level flood risk. Consider this example: The share of properties at risk in communities in which the majority of the householders are White is higher than the share of properties at risk in communities in which a different racial group constitutes a majority of the householders. It does not necessarily follow, however, that in communities in which the majority of householders are White, it is White householders who are most at risk.
CBO’s analysis also does not capture potentially relevant variation in flood risk associated with structure type, which may be correlated with household characteristics. For example, the flooding of a multistory apartment building would primarily affect units on the ground floor. Nevertheless, even householders who do not experience flooding at their own property are affected by flooding in their communities.
Geographic Location of Communities
In addition to examining flood risk on the basis of economic and demographic characteristics, CBO also looked at how risk differed depending on a community’s location. The agency used two criteria to determine if a community was coastal: whether it was located in a coastal county and whether the specific block group contained any water, whether ocean, gulf, lake, or other body of water. That is, all coastal communities are located in coastal counties, but not all communities in coastal counties are considered coastal communities in this report; likewise, all communities located on one of the nation’s saltwater coastlines are considered coastal communities, but not all coastal communities are located on one of those coastlines. CBO used the Census Bureau’s publications to identify coastal counties and the Census Bureau’s TIGERweb State-Based Data Files to identify block groups that contain at least part of a body of water.2 Accordingly, 10 percent of U.S. block groups are coastal; the remaining 90 percent are inland.
CBO’s analysis may understate the differences in community risk between coastal and inland areas. CBO’s definition of a coastal community includes some block groups that, although in coastal counties, do not strictly lie on the coast. Those block groups (which are more likely to be in states with relatively large counties) may be less exposed to certain types of flooding, such as that associated with rising sea levels and storm surges.
The majority of coastal properties and the majority of inland properties have no projected risk of flooding in the multiyear periods centered on 2020 and 2050 (see Table B-1, left panel). Roughly one-quarter of all the properties in coastal areas have a projected risk of flooding greater than zero, and the same is true for roughly one-tenth of all the properties in inland areas. In both areas, most properties with a projected nonzero risk are projected to have at least a 1 percent annual probability of experiencing a flood of a depth of at least 30 centimeters (about 1 foot; see Table B-1, right panel). Those are the properties that CBO labels at risk in this analysis.
Table B-1.
Projected Depth of a Flood With at Least a 1 Percent Annual Chance of Occurring
Centimeters

Data source: Congressional Budget Office, using data from First Street Foundation, “Property Level Flood Risk Statistics,” version 2.0 (April 13, 2022), https://zenodo.org/record/6459076. See www.cbo.gov/publication/58953#data.
A foot is equal to about 30 centimeters.
Projections of Flood Risk From First Street Foundation
The IPCC identified several warming scenarios known as representative concentration pathways (RCPs) in its fifth assessment report and shared socioeconomic pathways in its sixth assessment report.3 FSF generated flood risk projections for one of those scenarios, RCP 4.5, which is an intermediate warming scenario. In that scenario, emissions increase slightly until 2040 and then decline through 2100, yielding a global average temperature increase of 1.2 degrees Celsius by 2050 over the average for the 1986–2005 period. (Impacts of a warmer climate occur in every scenario modeled by the IPCC, including one with zero net global emissions by 2050.) FSF’s projections that CBO used in its analysis represent the middle of the distribution of outcomes from climate models used by the IPCC to examine RCP 4.5.
FSF combines data on historical floods from 1980 to 2010 with climate modeling from the IPCC to project flood depths for 143.7 million properties, each of which is matched to its block group in the census. FSF’s data cover all properties in 99 percent of the census’s block groups. The flood projections cover two multiyear periods, one centered on 2020 and one on 2050. (Flood projections are not generated for specific years but rather for ranges of years; the projection period is identified by the year that falls in the middle of the period.)
Projected flood depths incorporate the effects of existing adaptive infrastructure, but the data that such large-scale flood models can use to account for the existence and condition of adaptive infrastructure are limited. FSF’s modeling incorporates data from the National Levee Database and the National Inventory of Dams, both maintained by the Army Corps of Engineers, as well as a supplementary database of adaptive infrastructure developed by FSF.4 That supplementary database, which also accounts for the useful life of the infrastructure, draws on varied sources, including the Federal Emergency Management Agency’s flood insurance studies, states’ coastal zone management plans, and minutes from public meetings. The data include structures (such as levees, dams, and hardened ditches) and nature-based projects designed to slow flood waters (such as wetland projects).5 Still, the infrastructure data are incomplete.
Sources of Uncertainty
The economic and demographic characteristics of any given community in the future are uncertain. Any number of factors, including migration patterns, might influence where, for instance, communities with the largest share of Black householders are located. Projecting how communities could change is beyond the scope of this analysis, and this report incorporates the assumption that communities would remain largely unchanged over the span of the two projection periods. But the characteristics and location of communities could shift, partly because of how residents and policymakers adapted to a changing climate. For example, if government programs that purchase at-risk properties from willing owners and leave land uninhabited focused on lower-income properties, the share of low-income households at risk would decline. By contrast, if future adaptive infrastructure primarily protected higher-income properties, the share of high-income households at risk would be smaller.
Nevertheless, CBO’s analysis can provide information about how risk is associated with people’s economic and demographic characteristics even if their movements lead to shifts in their physical exposure to flooding. For example, if the projected changes in flood risk examined in this report were reflected in the price of housing, people would not be able to move away from the risk in 2050 without consequences. If property owners moved away from risk, for example, they would receive a lower price for their property because buyers would need to be compensated for the risk they were taking on. If renters moved away from risk, they would face higher rents in comparable properties that were not at risk. Evidence on whether flood risk is capitalized into housing prices is not conclusive, but there is evidence of capitalization for properties with recent experience (within 10 years) of significant flood damage.6 There is also evidence that the availability of information about flood risk, which is increasingly widespread, influences housing prices.7
Uncertainties in flood modeling (other than those uncertainties related to climate modeling more generally) are primarily associated with terrain data because flood patterns are mostly influenced by topography. Even large-scale data sets that describe terrain with relatively small errors in elevation can lead to mispredictions of whether a specific area will flood.8 Moreover, the resolution of the flood model determines the size of the square areas of physical land represented in the modeling grid. FSF’s model resolution is 30 meters (about 98 feet) and, where relevant local topographic data are available, a downscaling algorithm is used to resample the model output to a 10-meter resolution or 3-meter resolution.9 Many topographic features, such as curbs and walls, are even smaller than that. The resolution of large-scale flood models makes it difficult to represent complex flooding patterns, and complex patterns are more common in urban areas.10
Additional uncertainties are associated with modeling stream flows that are different from those regularly experienced, including the initial assumption (necessary in a large-scale model) that river gauge records stretching back at least 30 years are applicable to a river in its current state. There are also uncertainties associated with the parameter values that influence how the models simulate the propagation of water through channels and over floodplains.11
1. Census Bureau, “2016–2020 ACS 5-Year Estimates,” (March 17, 2022).
2. For more information about coastal counties, see Steven G. Wilson and Thomas R. Fischetti, “Coastline Population Trends in the United States: 1960 to 2008,” Report P25-1139 (Census Bureau, May 2010), https://tinyurl.com/3dcwbf3x; Census Bureau, “Substantial Changes to Counties and County Equivalent Entities: 1970–Present,” https://tinyurl.com/386k7mvf (2010) and https://tinyurl.com/2mu2ywj5 (2000). For block groups that include water, see Census Bureau, “TIGERweb State-Based Data Files” (accessed August 16, 2022), https://tinyurl.com/3af37ywe.
3. For details about specific scenarios, see R. K. Pachauri and L. A. Meyer, eds., Climate Change 2014: Synthesis Report, Contribution of Working Groups I, II and III to the Fifth Assessment Report (IPCC, 2014), www.ipcc.ch/report/ar5/syr/; and H. Lee and J. Romero, eds., Climate Change 2023: Synthesis Report (IPCC, 2023), www.ipcc.ch/report/ar6/syr/.
4. The National Levee Database, in particular, is known to be incomplete. See American Society of Civil Engineers, A Comprehensive Assessment of America’s Infrastructure: 2021 Report Card for America’s Infrastructure (2021), “Levees,” https://tinyurl.com/3suw2brd.
5. First Street Foundation, First Street Foundation Flood Model: Technical Methodology Document (June 17, 2020), https://tinyurl.com/ystb54xx (PDF).
6. Economic and Housing Research Group, “Sea Level Rise and Impact on Home Prices in Coastal Florida,” Freddie Mac Research Note (March 2022), https://tinyurl.com/hnnzaedy; Ajita Atreya, Susan Ferreira, and Warren Kriesel, “Forgetting the Flood? An Analysis of the Flood Risk Discount Over Time,” Land Economics, vol. 89, no. 4 (November 2013), pp. 577–596, http://le.uwpress.org/content/89/4/577.short; and Carolyn Kousky, “Learning From Extreme Events: Risk Perceptions After the Flood,” Land Economics, vol. 86, no. 3 (August 2010), pp. 395–422, http://le.uwpress.org/content/86/3/395.abstract.
7. Miyuki Hino and Marshall Burke, “The Effect of Information About Climate Risk on Property Values,” Proceedings of the National Academy of Sciences, vol. 118, no. 17 (April 2021), www.pnas.org/doi/full/10.1073/pnas.2003374118.
8. Oliver E. J. Wing and others, “Uncertainty in Hazard Estimation” (supplementary data for “Estimates of Present and Future Flood Risk in the Conterminous United States,” Environmental Research Letters, vol. 13, no. 3, February 2018), https://iopscience.iop.org/article/10.1088/1748-9326/aaac65.
9. Paul D. Bates and others, “Combined Modeling of U.S. Fluvial, Pluvial, and Coastal Flood Hazard Under Current and Future Climates,” Water Resources Research, vol. 57, no. 2 (February 2021), https://doi.org/10.1029/2020WR028673.
10. Oliver E. J. Wing and others, “Validation of a 30 m Resolution Flood Hazard Model of the Coterminous United States,” Water Resources Research, vol. 53, no. 9 (September 2017), section 3.5, https://doi.org/10.1002/2017WR020917; and Brett F. Sanders and others, “Large and Inequitable Flood Risks in Los Angeles, California,” Nature Sustainability, vol. 6, no. 1 (January 2023), www.nature.com/articles/s41893-022-00977-7.
11. Oliver E. J. Wing and others, “Uncertainty in Hazard Estimation” (supplementary data for “Estimates of Present and Future Flood Risk in the Conterminous United States,” Environmental Research Letters, vol. 13, no. 3, February 2018), https://iopscience.iop.org/article/10.1088/1748-9326/aaac65; and Paul D. Bates and others, “Combined Modeling of U.S. Fluvial, Pluvial, and Coastal Flood Hazard Under Current and Future Climates,” Water Resources Research, vol. 57, no. 2 (February 2021), https://doi.org/10.1029/2020WR028673.
Appendix CData Sources for Exhibits
Share of Properties Projected to Be at Risk of Flooding in the United States
Congressional Budget Office, using data from First Street Foundation, “Property Level Flood Risk Statistics,” version 2.0 (April 13, 2022), https://zenodo.org/record/6459076.
Share of Properties Projected to Be at Risk of Flood, by Quintile of Median Household Income
Congressional Budget Office, using data from the Census Bureau’s American Community Survey and First Street Foundation.
Share of Properties Projected to Be at Risk of Flood, by Quintile of Race
Congressional Budget Office, using data from the American Community Survey and First Street Foundation.
Share of Properties Projected to Be at Risk of Flood, by the Majority of Householders’ Race
Congressional Budget Office, using data from the American Community Survey and First Street Foundation.
Share of Properties Projected to Be at Risk of Flood, by the Majority of Householders’ Race and Median Household Income
Congressional Budget Office, using data from the American Community Survey and First Street Foundation.
Share of Properties Projected to Be at Risk of Flood, by Quintile of Ethnicity
Congressional Budget Office, using data from the American Community Survey and First Street Foundation.
Share of Properties Projected to Be at Risk of Flood, by the Majority of Householders’ Ethnicity
Congressional Budget Office, using data from the American Community Survey and First Street Foundation.
Share of Properties Projected to Be at Risk of Flood, by the Majority of Householders’ Ethnicity and Median Household Income
Congressional Budget Office, using data from the American Community Survey and First Street Foundation.
Share of Properties Projected to Be at Risk of Flood Depending on Whether Most Residences in the Community Are Primary or Secondary
Congressional Budget Office, using data from the American Community Survey and First Street Foundation.
Share of Properties Projected to Be at Risk of Flood, by Quintile of Renters
Congressional Budget Office, using data from the American Community Survey and First Street Foundation.
Share of Properties Projected to Be at Risk of Flood, by Quintile of Households With a Senior or a Child
Congressional Budget Office, using data from the American Community Survey and First Street Foundation.
Share of Coastal and Inland Properties Projected to Be at Risk of Flood, by Median Household Income
Congressional Budget Office, using data from the American Community Survey; First Street Foundation; Steven G. Wilson and Thomas R. Fischetti, “Coastline Population Trends in the United States: 1960 to 2008,” Report P25-1139 (Census Bureau, May 2010), https://tinyurl.com/3dcwbf3x; Census Bureau, “Substantial Changes to Counties and County Equivalent Entities: 1970–Present,” https://tinyurl.com/386k7mvf (2010) and https://tinyurl.com/2mu2ywj5 (2000); and Census Bureau, “TIGERweb State-Based Data Files” (accessed August 16, 2022), https://tinyurl.com/3af37ywe.
Share of Properties Projected to Be at Risk of Flood, by Location and the Majority of Householders’ Race
Congressional Budget Office, using data from the American Community Survey; First Street Foundation; Wilson and Fischetti; “Substantial Changes to Counties and County Equivalent Entities: 1970–Present”; and TIGERweb State-Based Data Files.
Share of Properties Projected to Be at Risk of Flood, by Location and the Majority of Householders’ Ethnicity
Congressional Budget Office, using data from the American Community Survey; First Street Foundation; Wilson and Fischetti; “Substantial Changes to Counties and County Equivalent Entities: 1970–Present”; and TIGERweb State-Based Data Files.
Share of Coastal and Inland Properties Projected to be at Risk of Flood Depending on Whether Most Residences in the Community Are Primary or Secondary
Congressional Budget Office, using data from the American Community Survey; First Street Foundation; Wilson and Fischetti; “Substantial Changes to Counties and County Equivalent Entities: 1970–Present”; and TIGERweb State-Based Data Files.
About This Document
This report was prepared at the request of the Ranking Member of the House Committee on the Budget. In keeping with the Congressional Budget Office’s mandate to provide objective, impartial analysis, the report makes no recommendations.
Elizabeth Ash and Natalie Tawil prepared the report with guidance from Joseph Kile, Xiaotong Niu, and Julie Topoleski. Pranav Bhandarkar (formerly of CBO) provided assistance with the analysis. Sebastien Gay, Ron Gecan, Rebecca Heller, Evan Herrnstadt, Casey Labrack, Jorge Salazar, and Chad Shirley offered comments. Adam Abadi fact-checked the report.
Maura Allaire of the University of California at Irvine, Jeremy Porter of the City University of New York, Brett Sanders of the University of California at Irvine, and Oliver Wing of Fathom commented on an earlier draft. The assistance of external reviewers implies no responsibility for the final product; that responsibility rests solely with CBO.
Mark Doms, Jeffrey Kling, and Robert Sunshine reviewed the report. Caitlin Verboon edited it, and Jorge Salazar created the graphics and prepared the text for publication. The report is available at www.cbo.gov/publication/58953.
CBO seeks feedback to make its work as useful as possible. Please send comments to communications@cbo.gov.

Phillip L. Swagel
Director
September 2023