
At a Glance
Special and incentive (S&I) pay is a particular category of compensation paid to eligible service members. The Department of Defense (DoD) uses that pay to attract or retain personnel in certain occupations (by offering bonuses, for example) or to compensate personnel for the unusual conditions of some assignments or for serving in designated locations (by offering incentives to perform unusually dangerous duty, for instance, or to serve in austere locations). Those types of pay are provided in addition to other elements of military cash compensation.
In this report, the Congressional Budget Office analyzes funding for S&I pay for active-duty service members in the Army, Navy, Air Force, and Marine Corps and explores how those types of pay have been used to address personnel shortfalls.
- Funding. S&I pay accounts for a small share of the services’ military personnel appropriation, which provides for basic pay, retirement pay, and other personnel-related costs. In 2021, that share for all four services was 4 percent (or about $5 billion of the $132 billion appropriation for military personnel). For service members who receive S&I pay, that compensation is a small part of their overall cash compensation, on average, although that portion is larger for personnel in some occupations.
- Purposes. About 70 percent of the funding for S&I pay in 2021 was used to attract or retain service members with desired skills. The remaining 30 percent was used to compensate service members for risks and conditions that are largely specific to the military: performing onerous or dangerous tasks or serving in designated locations. The average amount of S&I pay used to attract or retain personnel was about $12,000 per recipient—roughly five times the amount paid per recipient for performing onerous and dangerous tasks or for serving in certain locations.
- Occupational and Activity Groups. Enlistment and reenlistment bonuses for enlisted personnel in occupations with staffing shortages accounted for about one-third of S&I pay in 2021. Other types of S&I pay for officers and enlisted personnel were ongoing compensation or onetime bonuses for occupations in aviation, health care, and naval activities; other occupations or activities accounted for the rest.
- Use Among the Services. The Army, Navy, Air Force, and Marine Corps spent different portions of their military compensation appropriation on S&I pay. Between 2011 and 2021, the Navy allocated more of its military personnel appropriation (5.1 percent, on average) to S&I pay than the other services did, probably because a significant fraction of Navy personnel receive pay related to sea duty, which is considered onerous. About 40 percent of active-duty personnel received one or more types of S&I pay in 2021.
- Use for Personnel Shortfalls. In CBO’s estimation, there is no consistent relationship between changes in the amount of attraction and retention pay per recipient and the nation’s unemployment rate. Between 2011 and 2021, the amount per recipient both increased and decreased, whereas the unemployment rate mostly decreased. Nevertheless, DoD has usually used bonuses to address recruitment challenges to a greater extent in a tight labor market than in times when the labor market is not as strong.
Notes
All years referred to in this report are federal fiscal years, which run from October 1 to September 30 and are designated by the calendar year in which they end.
Unless stated otherwise, funding amounts and costs are expressed in 2022 dollars.
The budgets for the Army, Navy, Air Force, and Marine Corps contain more than 60 types of special and incentive (S&I) pay.1 Those types of pay are a component of cash compensation that service members may receive in addition to basic pay and the allowances for housing and food. S&I pay is offered as an incentive to attract or retain service members in certain occupations or to compensate them for the unusual conditions of some assignments or for serving in designated locations.2 Roughly 40 percent of active-duty personnel received one or more types of S&I pay in 2021.
The amount of S&I pay a service member receives depends on its purpose. For example, the amount paid to compensate service members on duty in an area where hostile fire occurs is set in law not to exceed $225 a month (or $2,700 a year). In contrast, the bonus for people with skills in medical specialties that are in high demand by the services during wartime who agree to enter military service for four or more years can be as high as $400,000, paid as a lump sum or in installments. A service member may receive more than one type of S&I pay in any given month or for any particular tour of duty. For instance, service members in a war zone would typically receive hostile fire pay as well as bonuses that may be in effect for their occupation or skill area. S&I pay provides a flexible way for the services to vary compensation among service members with the same rank and years of service.
The services also use S&I pay to address staffing shortfalls by tailoring them for different purposes, skills, working conditions, and assignments essential to their mission. The numerous types of S&I pay allow for a more targeted, and arguably more efficient, workforce management approach than is possible with only one or a few types of pay. In addition, the services use S&I pay to help meet their goals of making pay for certain occupational specialties comparable with salaries for similar occupations in the private sector. Meeting that goal of pay comparability can be challenging, however, because some types of S&I pay are adjusted infrequently. Adjustments of S&I pay entail assessing whether the eligibility for and amount of pay are consistent with wage premiums in civilian occupations with comparable current labor market conditions.
The Role of Special and Incentive Pay in Military Cash Compensation
Even though S&I pay is a small component of cash compensation, it provides flexibility to the military services that is not available from the other three elements of cash compensation—basic pay, the allowance for housing, and the allowance for food (which together constitute regular cash pay). Service members of the same rank and years of service receive the same amount of basic pay regardless of their occupation, but the S&I pay system allows the services to boost compensation for specific purposes. For instance, the services can turn some of those types of pay on and off as needed and target them to specific groups of service members to address staffing objectives that could not be met efficiently through increases in basic pay. Studies have shown that bonuses targeted toward critical occupations are cost-effective in attracting and retaining service members.3 For those reasons, researchers consider S&I pay a more cost-effective means of addressing staffing goals than across-the-board increases in basic pay. For service members who received S&I pay between 2011 and 2021, that pay equaled 15 percent of cash pay for officers and 13 percent for enlisted personnel, on average.
Cash Compensation per Service Member Who Received S&I Pay, on Average, 2011 to 2021
Thousands of 2022 Dollars

S&I pay is a relatively small addition, on average, to total cash pay for service members who receive it (about 40 percent of the force each year).
Regular cash pay includes basic pay and the allowances for housing and food. Amounts of S&I pay shown are for eligible service members only.
Trends in Funding for Special and Incentive Pay Relative to the Overall Military Personnel Appropriation
To examine trends in funding for S&I pay, the Congressional Budget Office analyzed that funding for the 2011–2021 period and compared it with other elements in the four largest active-duty services’ military personnel appropriation.4 Although that appropriation fluctuated over the 10-year period depending on the number of military personnel, the portion of funding allocated to S&I pay remained relatively constant. (To measure the size of the force, CBO used end strength, or the number of service members on the rolls as of the final day of a fiscal year, for this analysis.)
Total funding in the military personnel appropriation decreased from roughly $150 billion in 2011 to about $124 billion in 2017—probably because of the drawdown in Iraq and Afghanistan—before increasing to $134 billion in 2021. (All of those amounts are expressed in 2022 dollars.) Funding for regular cash pay, S&I pay, and other military personnel compensation costs broadly exhibited a similar trend.5 On average, funding for S&I pay accounted for about 4 percent of the military personnel appropriation over the period.
Categories of Funding in the Military Personnel Appropriation, 2011 to 2021
Billions of 2022 Dollars

Between 2011 and 2021, the services allocated a small share of their military personnel appropriation for active-duty service members to S&I pay.
Trends in Funding for Special and Incentive Pay Relative to the Military Personnel Appropriation for Each Service
The services allocate different portions of their military personnel appropriation to S&I pay, probably because of differences in their operations or force structures. Between 2011 and 2021, the Navy allocated 5.1 percent of its military personnel appropriation, on average, to S&I pay. By comparison, the average share of the military personnel appropriation allocated to S&I pay was 3.5 percent for the Army, 3.3 percent for the Air Force, and 1.7 percent for the Marine Corps.
The Navy’s percentage is higher probably because many of that service’s personnel receive pay related to sea duty, which is considered onerous. Each year, thousands of sailors serve on Navy ships deployed all over the world. The Marine Corps’ percentage is lower in part because it does not have service members in health care occupations, unlike the other services. Those occupations are typically eligible for substantial amounts of S&I pay.
Changes in the number of service members, a portion of whom are normally eligible for S&I pay, affect each service’s budget for those types of pay. The Army experienced larger swings in the share of funding it allocated to S&I pay over the 10-year period, possibly because that service had larger changes in its end strength than the other services did: The Army’s active-duty end strength decreased by about 16 percent between 2011 and 2016 before gradually increasing between 2016 and 2021, whereas the combined active-duty end strength for the other services decreased by 4 percent between 2011 and 2016 before gradually increasing afterward.
S&I Pay as a Percentage of Each Service’s Military Personnel Appropriation, 2011 to 2021
Percent

S&I pay accounted for a larger share of the Navy’s military personnel appropriation than for the other services’.
Allocation of Funding for Special and Incentive Pay, by Function and Occupation
To better understand how the services have used S&I pay to achieve their workforce management goals, CBO conducted a detailed analysis of funding in 2021 for the more than 60 types of S&I pay in the services’ budgets. First, the agency examined the prevalence of S&I pay by analyzing the number of different types of S&I pay each service member received during that year. Then, CBO analyzed funding for S&I pay by three categories of purpose (or function) and six broad occupational (or activity) groups.6
The categories, by function, are recruiting, retention, or compensation for desired skills (that is, attraction or retention); incentive to perform onerous work in specific assignments, units, or locations; and incentive to perform dangerous duty.
By occupation, the categories are aviation related, such as flying duty by pilots, crew, and noncrew members; health care related, such as dental, general medicine, and other health care specialties; naval related, such as sea duty on surface ships and submarines; nuclear related, such as operating and maintaining nuclear propulsion engines; various occupations with enlistment and reenlistment bonuses;7 and other occupations.8
Depending on their occupation, service members may receive S&I pay in one or more of the three function categories. For example, a service member in an aviation specialty (such as a pilot) could receive a retention bonus to remain in service as well as flying-duty pay for performing that duty.9
Number of Recipients of S&I Pay, by Category, 2021

Most of the recipients of S&I pay received that compensation for performing onerous tasks or serving in designated locations. A significant number of service members also received S&I pay to enter or remain in various occupations in the military.
Prevalence of Special and Incentive Pay Among Service Members
Using data provided by the Defense Manpower Data Center, CBO examined how many types of S&I pay each service member received in 2021.10 Except for personnel in the Navy, most service members did not receive any S&I pay in that year. Nevertheless, on average, about 40 percent of service members received at least one type of S&I pay, particularly in the Navy and the Army.11 Certain service members received more than five types of S&I pay in 2021, although that was relatively uncommon.
The many Navy personnel who receive sea duty-related pay probably contributes to the relatively high rate of S&I pay receipt in that service. In the case of the Army, that rate is relatively high because many soldiers receive location-based pay for serving in Army bases around the world or pay for performing dangerous duties (such as parachuting).
Distribution of Service Members, by Receipt of S&I Pay and Branch of the Armed Services, 2021
Thousands of Service Members

Many service members receive at least one type of S&I pay.
Funding for Special and Incentive Pay, by Function
Attraction and retention of personnel accounted for 70 percent of the services’ S&I funding in 2021, a significantly larger share than other categories. The types of S&I pay related to attraction and retention include bonuses and incentive pay for officers in occupations that the services designate as critical to achieving their staffing goals. (Those occupations include aircraft pilots and health care workers.) For enlisted personnel, the types of S&I pay related to attraction and retention include reenlistment bonuses offered to personnel in selected occupations who are at the point in their career where they stay or leave military service. For officers and enlisted service members, pay for performing onerous tasks or working in designated locations and pay for performing dangerous tasks accounted for roughly one-fifth and one-tenth of total funding for S&I pay, respectively, in 2021.
For each service, the share of total funding for S&I pay allocated to the various categories probably depends on their operations and workforce objectives. For example, shortfalls of personnel in high-demand occupations could encourage a service to increase funding for S&I pay to attract or retain those workers. In the Marine Corps’ case, the relatively large share of Marines serving in less desirable locations overseas or performing other onerous assignments affects that service’s share of its budget for S&I pay used for those purposes.
Distribution of Funding for S&I Pay, by Function, 2021
Billions of 2022 Dollars (Number of recipients)
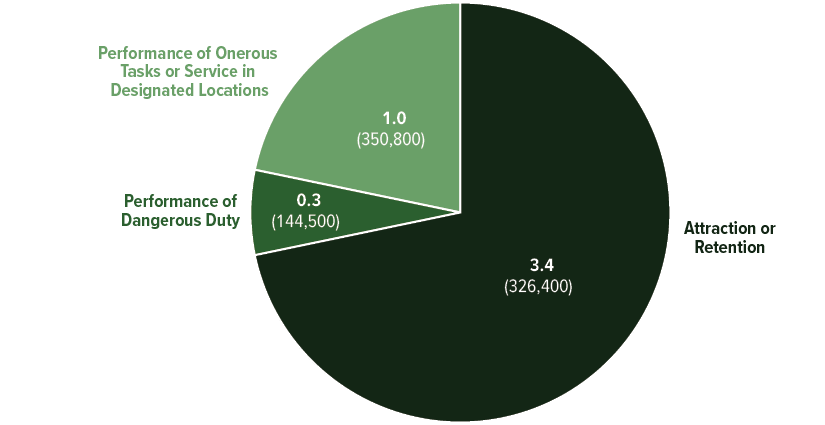
Pay provided to attract, retain, or compensate personnel with skills desired by the services accounted for most of the funding for S&I pay in 2021.
Average Amount of Special and Incentive Pay per Recipient, by Function
The amount of pay a service member receives is an important consideration in his or her decision to enter or stay in military service, undertake certain assignments, or volunteer to work in designated locations. For some types of S&I pay (such as pay for parachute duty), authorizing statutes set the maximum amount per recipient. But for other types of S&I pay, particularly those used to attract or retain personnel, the services can set the amount (up to a limit).
In 2021, the average amount of S&I pay used to attract or retain personnel was about $12,000 per recipient—roughly five times the amount paid per recipient for performing onerous and dangerous tasks or for serving in certain locations.12 The difference is probably not surprising given that the Department of Defense (DoD) uses attraction and retention pay to compete with the private sector for personnel in high-demand occupations, whereas pay for performing onerous and dangerous tasks or for serving in certain locations is provided partly to compensate service members for undertaking demanding or less desirable duties (tasks for which DoD is not competing with the private sector).
Average Amount of S&I Pay and Share of Service Members Who Received That Pay, by Function, 2021
Thousands of 2022 Dollars (Percentage of recipients)

The average amount of S&I pay provided to attract or retain service members was about five times the average amount of S&I pay provided for either of the other purposes. But the percentage of recipients (as shown by the thickness of the bars) who received S&I pay for the purpose of attraction or retention was less than half the percentage that received such pay for either of the other purposes.
Share of S&I Funding for Each Function, by Service
In 2021, the largest share of total funding for S&I pay in each service went toward attracting or retaining service members in selected occupations: 70 percent, 64 percent, 85 percent, and 72 percent for the Army, Navy, Air Force, and Marine Corps, respectively. The Air Force’s share was higher than the other services’ shares, probably because that service had more personnel (such as pilots) with aviation-related skills that are in high demand.
The second-largest share of funding for S&I pay in 2021 went to service members who undertake difficult assignments (such as sea duty) or serve in certain locations (such as South Korea, where many service members cannot bring their families). Pay for undertaking dangerous duties accounted for the smallest share of the funding.
Share of S&I Funding for Each Service, by Purpose of the Spending, 2021
Percent

Each service’s funding for S&I pay was used mainly for attracting or retaining service members.
Funding for Special and Incentive Pay, by Occupational and Activity Groups
Among the groups that CBO analyzed, enlistment and reenlistment bonuses for enlisted personnel in occupations that qualify for them accounted for about one-third of funding for S&I pay in 2021. The services usually offer those bonuses to attract or retain enlisted service members in sufficient numbers to fill occupations that the services consider important to achieving their workforce management objectives. Another roughly one-third of funding for S&I pay in 2021 was for service members in occupations related to health care or aviation. The remaining one-third was for service members who work in other occupations or who receive location-based pay.
Funding for S&I Pay, by Occupational and Activity Groups, 2021
Billions of 2022 Dollars

Enlistment and reenlistment bonuses for enlisted personnel in various occupations account for the largest share of the services’ funding for S&I pay in 2021.
Special and Incentive Pay Received by Service Members, by Occupational and Activity Groups
Service members (mostly officers) working in occupations related to nuclear energy or health care received more than $22,000 each, on average, in S&I pay in 2021, indicating the importance of those skills to the services’ missions. Enlisted personnel who received enlistment or reenlistment bonuses because they work in occupations considered understaffed by the services received roughly $11,000 each in S&I pay, on average, in 2021. Such amounts, which can fluctuate depending on economic conditions, are typically paid to attract or retain service members who can obtain similar work (but at a higher salary) in the private sector. For personnel in other occupational categories, the average amount of S&I pay received in 2021 was smaller, in part because it included pay related to assignment or location, which tends to be less.
Although the amount of S&I pay per recipient in nuclear-related and health care-related occupations was much higher than the S&I pay per recipient in the other occupational groups (and in the functional categories discussed earlier), service members in nuclear-related or health care-related occupations accounted for a small share (roughly 5 percent) of all recipients of S&I pay in 2021.
Average Amount of S&I Pay and Share of Service Members Who Received That Pay, by Occupational and Activity Groups, 2021
Thousands of 2022 Dollars (Percentage of recipients)

The average amount of S&I pay received by personnel in nuclear-related and health care-related occupations was substantially larger than the amount received by personnel in other occupational or activity groups. The share of recipients in those two categories (as shown by the thickness of the bars) was relatively small, however.
Share of S&I Funding for Occupational and Activity Groups, by Service
Perhaps owing to their different roles and missions, the services devote different portions of their funding for S&I pay to occupational and activity groups. For example, the Marine Corps and the Army, which both use ground forces, spend a larger share of their budget for S&I pay on enlistment and reenlistment bonuses than the other services spend. In 2021, those shares were 48 percent for the Marine Corps and 42 percent for the Army; the shares for the Navy and Air Force were 30 percent and 19 percent, respectively.
Bonuses are among the tools the services use to persuade service members to enter or remain in combat occupations and other specialties the services need in order to fulfill their missions. Research has shown that service members respond positively to bonuses in making those decisions.
The Navy and Air Force devote a larger share of their funding for S&I pay to naval-related and aviation-related occupations and activities, respectively, than the other services do. The Navy is the sole service with S&I pay for nuclear occupations, which accounted for about 6 percent of its total funding for S&I pay in 2021. The Marine Corps does not have service members in health care occupations, so it does not allocate funding to S&I pay for occupations related to health care.
Distribution of Funding for S&I Pay, by Service and by Occupational and Activity Groups, 2021
Percent

The Marine Corps and Army spent more of their S&I budget on bonuses for enlisted personnel than the other services did in 2021. The Navy and Air Force devoted a larger share of their S&I budget to naval-related and aviation-related occupations and activities.
Use of Special and Incentive Pay to Address Staffing Challenges
An important objective of S&I pay is to induce service members to enter or continue military service in occupations that, without those incentives, would experience staffing shortfalls. To assess how the services have used S&I pay to achieve that objective, CBO focused on attraction and retention pay and examined how the amount per recipient changed over time, possibly in response to conditions in the economy and the civilian labor market. (The authorizing statutes for those types of pay provide the services with the flexibility to adjust and target the amount of pay to specific occupations.)
In general, the services increase S&I pay for personnel in occupations with particularly strong competition from the private sector. For example, the Air Force raised its retention bonus for pilots in 2017 in response to an expected increase in the hiring of pilots by the major commercial airlines; researchers estimated that the increase could improve the retention of military Air Force pilots, especially later in their career.13
One might expect that the amount of S&I pay per recipient would increase during periods of low unemployment as the services compete with the private sector for workers—and that the opposite would occur during periods of high unemployment. But CBO found no consistent relationship between changes in the amount of S&I pay per recipient and the unemployment rate from 2011 through 2021. Over that 10-year period, the average amount of S&I pay per recipient fluctuated: It mostly decreased between 2011 and 2014, mostly increased between 2015 and 2018, decreased in 2019 and 2020, and then increased in 2021. By contrast, the unemployment rate mostly declined during the period—except in 2020, when it rose because of the pandemic-related economic slowdown.
Other factors also affect the amount of attraction and retention pay per recipient. For example, pressure to retain service members is lessened during periods of falling end strength, even when the civilian unemployment rate is low. That scenario could explain why the amount of S&I pay per recipient decreased in 2014 even as the unemployment rate fell. During a conflict, however, the services might have to boost those types of pay to attract recruits. S&I pay also could increase if the services tried to quickly expand their forces (or that pay could decrease if the reverse happened).
Annual Change in the Amount per Recipient for Selected Types of S&I Pay and the Unemployment Rate, 2011 to 2021
Percent

The amount of attraction and retention pay per recipient increased and decreased between 2011 and 2021, whereas the unemployment rate mostly decreased during the period.
A New Type of Special Pay Arising From Creation of the Blended Retirement System
In 2015, the Congress authorized a new retirement system for members of the uniformed services beginning on January 1, 2018.14 Unlike the previous system (which provided a pension, or defined benefit), the new retirement system combines a smaller pension with a defined contribution plan, in the style of a 401(k), in a Blended Retirement System (BRS). The new system covers all service members who joined the military on or after January 1, 2018, and members with fewer than 12 years of service as of December 31, 2017, who opted into the system when it was established.
The BRS provides a new type of special pay—a onetime midcareer bonus, or continuation pay—to eligible service members who complete 12 years of service and agree to serve for an additional 4 years. The authorizing legislation provides two components of continuation pay: a standard amount that equals a service member’s monthly basic pay multiplied by 2.5; and an additional amount paid at the discretion of the secretary of the respective service that equals the service member’s monthly basic pay multiplied by a number up to 13.15 The law gives the services the flexibility to adjust the total amount of continuation pay to meet their workforce management objectives.
The effects of the BRS on continuation pay are very small today but will become significant over the next decade. Because the BRS took effect in 2018, only a relatively small share of service members—those who reached their 13th year of service since then and opted into the system—were eligible for continuation pay during the period covered in this analysis. However, funding for continuation pay will increase significantly in the future as the BRS covers an increasingly larger share of (and ultimately all) service members.
Each year, about 35,000 active-duty officers and enlisted service members in the Army, Navy, Air Force, and Marine Corps complete 12 years of service. If the military’s force structure and workforce management policies remained unchanged, all of those service members would be covered by the BRS after 2030. In CBO’s estimation, annual funding for both components of continuation pay for the four services could amount to between $400 million and $2.6 billion. The exact amount would depend on how much of the allowable additional component of continuation pay the services chose to provide to personnel in each occupation.
Funding for Continuation Pay, by Service, 2018 to 2021
Millions of 2022 Dollars

In total, funding for continuation pay by the active services gradually increased from $8 million in 2018 to about $24 million 2021.
1. For a list of current types of S&I pay and their associated amounts, see Appendix A.
2. S&I pay is authorized in chapter 5 of title 37 of the U.S. Code. Because those types of pay are not included in regular basic pay, they are not considered in service members’ annual pay raises or retirement pensions.
3. Matthew S. Goldberg, “A Survey of Enlisted Retention: Models and Findings,” Chapter 2 in Report of the Ninth Quadrennial Review of Military Compensation (Department of Defense, Office of the Under Secretary of Defense for Personnel and Readiness, March 2002); Beth J. Asch and others, Cash Incentives and Military Enlistment, Attrition, and Reenlistment, MG-950-OSD (RAND Corporation, 2010), https://tinyurl.com/mwjw8djc (PDF); and David Knapp and others, Resources Required to Meet the U.S. Army’s Enlisted Recruiting Requirements Under Alternative Recruiting Goals, Conditions, and Eligibility Policies, RR-2364-A (RAND Corporation, 2018), https://tinyurl.com/2zfj6dkh (PDF).
4. To conduct that analysis, CBO obtained detailed data on the amount of funding and the number of recipients for many types of S&I pay from 2011 to 2021. Those data came from the services’ budget justification books and the Defense Manpower Data Center. CBO also obtained background and other information on S&I pay from DoD’s policy documents. See Department of Defense, Under Secretary of Defense, Comptroller, Financial Management Regulation, vol. 7A, “Military Pay Policy—Active Duty and Reserve Pay” (updated April 2023), https://tinyurl.com/2p8j6nb5 (PDF); and Department of Defense, Under Secretary of Defense for Personnel and Readiness, Military Compensation Background Papers: Compensation Elements and Related Manpower Cost Items; Their Purposes and Legislative Backgrounds, eighth ed. (July 2018), https://tinyurl.com/hu6wn7yt (PDF).
5. Regular cash pay includes basic pay, the housing allowance (excluding in-kind housing), and the food allowance (including in-kind meals). Other costs in the military personnel appropriation include retirement pay accruals, matching contributions to the Thrift Savings Plan, Social Security tax payments, permanent change of station (or relocation) travel, and miscellaneous costs (such as death benefits paid to surviving dependents).
6. CBO used information from the authorizing statutes and DoD’s documents (such as the Financial Management Regulations) to determine the categories of purpose and occupational groups.
7. CBO grouped occupations for enlisted personnel that qualify for enlistment or reenlistment bonuses into one category because information identifying the specific occupations was not available. Furthermore, the list of eligible occupations changes frequently as the services adjust it to address shortfalls in their workforce.
8. The “other” category includes bonuses for officers in a few occupations (such as civil engineering) and location-based S&I pay.
9. A service member who receives more than one type of S&I pay is counted as a recipient in each such situation, so the total number of recipients does not represent unique service members. For that reason, using that number to measure the percentage of the force receiving S&I pay would not provide an accurate result.
10. The Defense Manpower Data Center provided data on the types of S&I pay each service member received in fiscal year 2021. CBO analyzed the distribution of the number of service members and the number of different types of S&I pay they received in each of the 12 months of that year and then calculated the average for the whole year.
11. Some service members received five or more types of S&I pay in 2021.
12. In CBO’s analysis, the amount per recipient for each type of S&I pay is the annual funding divided by the number of recipients. To reduce the effect of values that are outliers, the averages for each group of S&I pay, such as the function categories, are weighted by the number of recipients of the types in S&I pay in the group. For that reason, total funding by function may not equal the product of the amount per recipient and the number of recipients. Also, because CBO’s analysis focuses on annual funding in the services’ budgets, the amount per recipient for bonuses paid out over multiple years includes only the installments paid in a particular year.
13. Government Accountability Office, Collecting Additional Data Could Enhance Pilot Retention Efforts, GAO-18-439 (June 2018); and Michael G. Mattock and others, The Relative Cost-Effectiveness of Retaining Versus Accessing Air Force Pilots, RR-2415 (RAND Corporation, 2019), https://tinyurl.com/382fw36y (PDF).
14. See section 631 of Public Law 114-92.
15. See 37 U.S.C., section 356.
Appendix ATypes of Special and Incentive Pay
As of 2022, the Department of Defense offered more than 60 different types of special and incentive (S&I) pay (see Table A-1). The amounts associated with those types of pay vary widely. Service members can receive multiple types of S&I pay simultaneously, although most personnel receive zero or one in a given year.
Table A-1.
Types and Amounts of Special and Incentive Pay in the Military
Dollars

Data source: Under Secretary of Defense for Personnel and Readiness, Military Compensation Background Papers: Compensation Elements and Related Manpower Cost Items, Their Purposes, and Legislative Backgrounds (July 2018).
Appendix BData Sources
Cash Compensation per Service Member Who Received S&I Pay, on Average, 2011 to 2021
Congressional Budget Office, using data provided by the Department of Defense.
Categories of Funding in the Military Personnel Appropriation, 2011 to 2021
Congressional Budget Office, using data provided by the Department of Defense.
S&I Pay as a Percentage of Each Service’s Military Personnel Appropriation, 2011 to 2021
Congressional Budget Office, using data provided by the Department of Defense.
Number of Recipients of S&I Pay, by Category, 2021
Congressional Budget Office, using data provided by the Department of Defense.
Distribution of Service Members, by Receipt of S&I Pay and Branch of the Armed Services, 2021
Congressional Budget Office, using data provided by the Defense Manpower Data Center.
Distribution of Funding for S&I Pay, by Function, 2021
Congressional Budget Office, using data provided by the Department of Defense.
Average Amount of S&I Pay and Share of Service Members Who Received That Pay, by Function, 2021
Congressional Budget Office, using data provided by the Department of Defense.
Share of S&I Funding for Each Service, by Purpose of the Spending, 2021
Congressional Budget Office, using data provided by the Department of Defense.
Funding for S&I Pay, by Occupational and Activity Groups, 2021
Congressional Budget Office, using data provided by the Department of Defense.
Average Amount of S&I Pay and Share of Service Members Who Received That Pay, by Occupational and Activity Groups, 2021
Congressional Budget Office, using data provided by the Department of Defense.
Distribution of Funding for S&I Pay, by Service and by Occupational and Activity Groups, 2021
Congressional Budget Office, using data provided by the Department of Defense.
Annual Change in the Amount per Recipient for Selected Types of S&I Pay and the Unemployment Rate, 2011 to 2021
Congressional Budget Office, using data from the Department of Defense and the Department of Labor, Bureau of Labor Statistics.
Funding for Continuation Pay, by Service, 2018 to 2021
Congressional Budget Office, using data provided by the Department of Defense.
About This Document
This report was prepared at the request of the Subcommittee on Personnel of the Senate Committee on Armed Services. In keeping with the Congressional Budget Office’s mandate to provide objective, impartial analysis, the report makes no recommendations.
Adebayo Adedeji prepared the report under the guidance of David Mosher and Edward G. Keating. Vinay Maruri provided assistance. Noelia Duchovny, Ann E. Futrell, David Newman, and Dawn Sauter Regan offered comments. James Hosek of the RAND Corporation and Lawrence Kapp of the Congressional Research Service commented on an earlier draft. The assistance of external reviewers implies no responsibility for the final product; that responsibility rests solely with CBO.
Jeffrey Kling and Robert Sunshine reviewed the report. Christine Bogusz edited it, and R. L. Rebach created the graphics, prepared the text for publication, and illustrated the cover. The report is available at www.cbo.gov/publication/58996.
CBO seeks feedback to make its work as useful as possible. Please send comments to communications@cbo.gov.

Phillip L. Swagel
Director
July 2023