
Notes
Unless this report indicates otherwise, annual growth rates are measured from the fourth quarter of one year to the fourth quarter of the next. Numbers in the text and tables may not add up to totals because of rounding. This report will not be accompanied by updated budget projections.
The Congressional Budget Office periodically updates its economic forecast to ensure that its projections reflect recent economic developments and current law. This report provides details about CBO’s most recent projections of the economy through 2025, which reflect economic developments as of June 22, 2023 (see Table 1).
Table 1.
CBO’s Economic Projections for 2023 to 2025

Data sources: Congressional Budget Office; Bureau of Economic Analysis; Bureau of Labor Statistics; Federal Reserve. See www.cbo.gov/publication/59258#data.
PCE = personal consumption expenditures; GDP = gross domestic product.
a. Real values are nominal values that have been adjusted to remove the effects of changes in prices.
b. Excludes prices for food and energy.
c. The consumer price index for all urban consumers.
d. The employment cost index for wages and salaries of workers in private industries.
e. The average monthly change, calculated by dividing quarterly averages by 3 and annual averages by 12.
Over the 2023–2025 period, in CBO’s latest projections:
- Economic growth slows and then picks up. The growth of real (inflation-adjusted) gross domestic product (GDP) slows to a 0.4 percent annual rate during the second half of 2023; for the year as a whole, real GDP increases by 0.9 percent. After 2023, growth accelerates as monetary policy eases. Real GDP increases by 1.5 percent in 2024 and by 2.4 percent in 2025.
- That initial slowdown in economic growth drives up unemployment. The unemployment rate reaches 4.1 percent by the end of 2023 and 4.7 percent by the end of 2024 before falling slightly, to 4.5 percent, in 2025. Payroll employment declines by an average of 10,000 jobs per month in 2024 and rises by an average of 6,000 jobs per month in 2025.
- Inflation continues to gradually decline. Growth in the price index for personal consumption expenditures (PCE) slows from 3.3 percent in 2023 to 2.6 percent in 2024 and 2.2 percent in 2025. That slowdown reflects several factors, including softening labor markets and flagging growth in home prices (and even declines in some regions), which passes through to rents.
- The Federal Reserve further increases the target range for the federal funds rate (the interest rate that financial institutions charge each other for overnight loans of their monetary reserves) in mid-2023. It begins reducing that target range in the first half of 2024, as inflation continues to cool. The federal funds rate declines from 5.4 percent in the fourth quarter of 2023 to 4.5 percent in the fourth quarter of 2024 and 3.6 percent in the fourth quarter of 2025.
Gross Domestic Product and Its Components
In CBO’s projections, which reflect the assumption that current laws governing federal taxes and spending generally remain unchanged, most components of GDP grow slowly in 2023, and real residential investment and real inventory investment both decline (see Table 2). After 2023, the growth of real GDP accelerates.
Table 2.
Projected Growth of Real GDP and Its Components
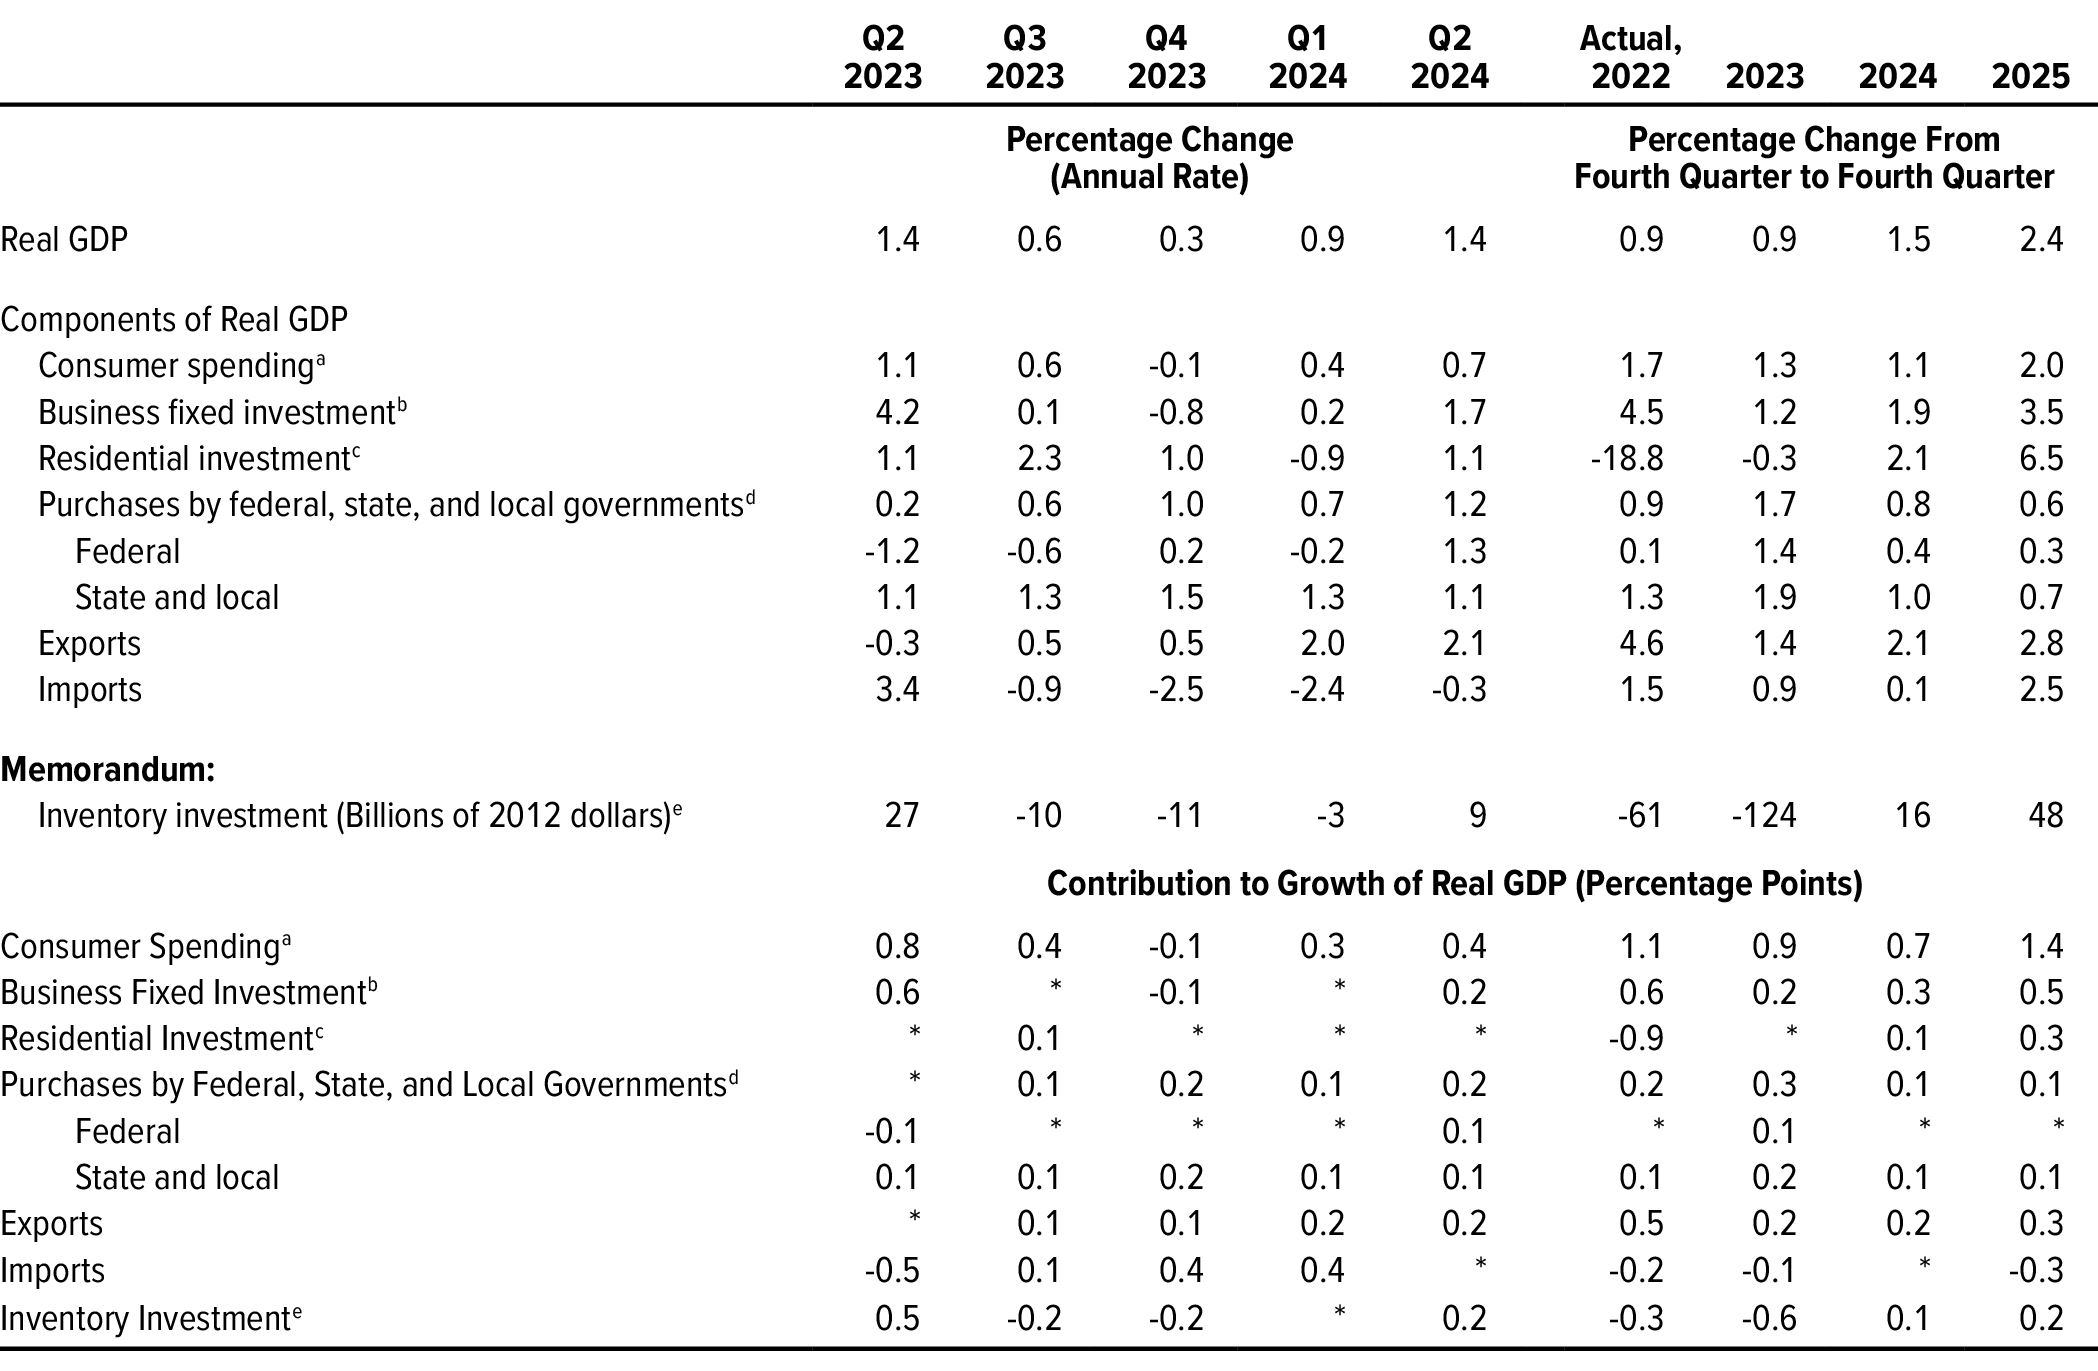
Data source: Congressional Budget Office. See www.cbo.gov/publication/59258#data.
Real values are nominal values that have been adjusted to remove the effects of changes in prices.
GDP = gross domestic product; * = between zero and 0.05 percentage points.
a. Consists of personal consumption expenditures.
b. Consists of purchases of equipment, nonresidential structures, and intellectual property products.
c. Includes the construction of single-family and multifamily structures, manufactured homes, and dormitories; spending on home improvements; and brokers’ commissions and other ownership transfer costs.
d. Based on the national income and product accounts.
e. Inventory investment is the change in private inventories from one quarter to the next at an annual rate. Quarterly growth in inventory investment is measured as the change in inventory investment from the prior quarter. Annual growth in inventory investment is measured as the change in inventory investment from the fourth quarter of one year to the fourth quarter of the next.
Consumer Spending
CBO expects growth in real consumer spending to weaken in late 2023 as rising interest rates, tighter lending standards, rising unemployment, and diminished support from savings accumulated during the coronavirus pandemic cause consumers to pull back. Consumer spending is then expected to strengthen in late 2024 as interest rates decline and in 2025 as both interest rates and unemployment decline. In the agency’s projections, real consumer spending increases by 1.3 percent in 2023, by 1.1 percent in 2024, and by 2.0 percent in 2025.
CBO expects that the shift in spending from goods to services that began in mid-2021 will continue, as consumers approach patterns of consumption observed before the pandemic. Credit conditions are likely to influence that trend. In the first half of 2023, bank loan officers reported that they were raising minimum credit score requirements and lowering credit limits; CBO expects credit conditions to tighten further in the near term.1 In the agency’s projections, those tighter standards—combined with higher interest rates—discourage spending on goods over the next two years. In 2025, real spending on goods begins to increase again.
Elevated levels of accumulated savings have boosted consumer spending over the past year. CBO expects that pattern to continue, but to a lesser extent. Personal saving rose to high levels during 2020 and 2021—partly because financial support provided by the government more than offset households’ declines in employment income, and partly because households cut back on expenditures during the pandemic. Consumers have drawn from their stockpiles of savings in 2022 and 2023 to support their spending. But rising delinquency rates on credit cards and consumer loans suggest that some earners have exhausted their savings and will have less wherewithal to maintain spending in the face of elevated interest rates and unemployment.2
Business and Residential Investment
Real business fixed investment—the purchase of new equipment, nonresidential structures, and intellectual property products, such as software—is projected to increase by just 1.2 percent from the fourth quarter of 2022 to the fourth quarter of 2023. That slow growth reflects weakening demand for businesses’ output, rising costs of debt and equity, and tighter lending standards. As the economy improves and lending standards ease, real business investment grows faster, increasing by 1.9 percent in 2024 and by 3.5 percent in 2025. That pickup is driven by spending on equipment, which is projected to decline in real terms in 2023 but to grow more rapidly than investment in structures or intellectual property products in 2024 and 2025.
Businesses’ accumulation of inventories (finished goods, work in progress, and materials and supplies) slowed sharply in the first quarter of 2023, in line with the slowing growth of sales. CBO expects that slow growth in sales to keep real inventory investment low throughout the rest of 2023. Such investment is forecast to remain subdued in 2024 but to pick up in 2025 as GDP growth accelerates.
Real residential investment decreased by 18.8 percent in 2022, primarily because of a sharp rise in mortgage rates. Although starts of construction on single-family units are no longer falling, the lingering effects of that increase in rates and a pullback in multifamily-home construction are projected to cause real residential investment to decline by an additional 0.3 percent in 2023. Thereafter, in CBO’s projections, pent-up demand for housing and lower mortgage rates cause real residential investment to grow—by 2.1 percent in 2024 and by 6.5 percent in 2025. Following similar dynamics, house prices (as measured by the Federal Housing Finance Agency’s price index for home purchases) rise by only 0.3 percent in 2023 but then grow by 1.7 percent in 2024 and by 2.4 percent in 2025.
Government Purchases
Real government purchases of goods and services—such as highways, military equipment, and public educational services—increased at a 5.2 percent annual rate in the first quarter of 2023. Federal purchases grew faster than purchases by state and local governments. CBO projects that, if current laws governing federal spending generally remained in place, real government purchases would increase by 1.7 percent in 2023. For state and local governments, that growth would result from recovering payrolls, especially in education, and strong investment spurred in part by the Infrastructure Investment and Jobs Act (Public Law 117-58).
In CBO’s projections, the Fiscal Responsibility Act of 2023 (P.L. 118-5) limits the growth of appropriations for federal programs over the three years that are the focus of this updated forecast. Real government purchases grow by an average of 1.0 percent per year from 2023 to 2025. Real purchases by the federal government grow by an average of 0.7 percent per year over that period, and real purchases by state and local governments grow by an average of 1.2 percent per year.
Exports and Imports
The U.S. trade deficit is projected to shrink in relation to GDP over the next year before stabilizing in the middle of 2024. CBO expects growth in exports to roughly match the growth rate of imports in the third quarter of 2023 and then to outpace growth in imports over the following four quarters. That trajectory reflects three factors:
- The foreign exchange value of the dollar is expected to continue a decline that began in late 2022.3
- Rates of economic growth among major U.S. trading partners are projected to rise starting in early 2024, boosting demand for exports.4
- Weak growth in domestic demand is expected to dampen demand for imported goods and services.
As a result, in CBO’s projections, the trade deficit shrinks from 3.4 percent of GDP in mid-2023 to 3.1 percent in mid-2024. (By comparison, it averaged 2.7 percent of GDP in 2019 before the pandemic.) Over the second half of 2024 and in 2025, the trade deficit generally remains stable as stronger growth of domestic demand boosts growth in imports, roughly offsetting the continued increase in export growth.
The foreign exchange value of the dollar declined by 3.4 percent from the fourth quarter of 2022 to the second quarter of 2023. In CBO’s assessment, the dollar depreciated because investors expected interest rates to rise by less in the United States than in most of its trading partners, which reduced demand for the dollar and dollar-denominated assets in international markets. CBO expects that trend to persist; as a result, the foreign exchange value of the dollar is projected to decline by 5.2 percent between the second quarter of 2023 and the end of 2025. That decline in the dollar’s value is expected to boost growth of U.S. exports while slightly dampening growth of U.S. imports.
The Labor Market
Labor market conditions are expected to slacken in the second half of 2023. In CBO’s projections, through the end of 2024, the growth of employment wanes, the unemployment rate rises, the labor force participation rate declines, and the growth of wages and salaries slows. Labor market conditions improve in 2025 as accelerating growth in real GDP leads to a lower unemployment rate and a rise in employment growth.
Employment
The growth of nonfarm payroll employment is projected to moderate in the second half of 2023 as slowed growth in real output dampens the demand for workers. The number of added jobs in the economy is projected to fall from an average of 298,000 per month in the first half of 2023 to an average of 111,000 per month in the second half. CBO then expects employment to decline by roughly 10,000 jobs per month in 2024 before increasing by roughly 6,000 jobs per month in 2025 as economic growth rebounds.
Unemployment
The unemployment rate and the number of unemployed people are both expected to rise through the end of 2024, reflecting slow economic growth. In CBO’s projections, the unemployment rate increases from 3.6 percent in the second quarter of 2023 to 4.7 percent in the fourth quarter of 2024. Over the same period, the number of unemployed people rises from 5.9 million to 7.8 million. In early 2025, the unemployment rate begins a gradual decline, reaching 4.5 percent by the end of the year.
Labor Force Participation
In CBO’s projections, the labor force participation rate declines through 2024 as slower economic growth reduces the demand for labor.5 That rate averages 62.6 percent in the second half of 2023 and 62.3 percent in 2024. It continues to decline in 2025, reaching 62.0 percent by the end of the year, as decreases in labor force participation due to the aging of the population outstrip increases attributable to the expanding economy.
Hourly Wages and Salaries
CBO expects slowing demand for labor and falling inflation to restrain growth in nominal wages. As a result, the growth of the employment cost index for wages and salaries of workers in private industry—a measure of the hourly price of labor, excluding fringe benefits—is projected to decline from 4.9 percent in 2023 to 3.6 percent in 2025.
Inflation
In CBO’s projections, inflation slows in 2023 as factors that caused demand to grow more rapidly than supply in the wake of the pandemic continue to ease. The rate of inflation continues to exceed the Federal Reserve’s long-run goal of 2 percent from 2023 to 2025, but it approaches that goal as it declines throughout that period.
The growth rate of the PCE price index—the Federal Reserve’s preferred measure of inflation—reached 5.7 percent in 2022. PCE inflation (that is, inflation in the PCE price index) is projected to fall from 3.3 percent in 2023 to 2.6 percent in 2024 and 2.2 percent in 2025. (See Figure 1.) By comparison, the core PCE price index, which excludes food and energy prices, rose by 4.8 percent in 2022 and is projected to rise by 4.1 percent in 2023, by 2.8 percent in 2024, and by 2.4 percent in 2025. Growth in the consumer price index for all urban consumers (CPI-U) and in the core CPI-U is also projected to slow through 2025.
Figure 1.
Measures of PCE Inflation
Percent
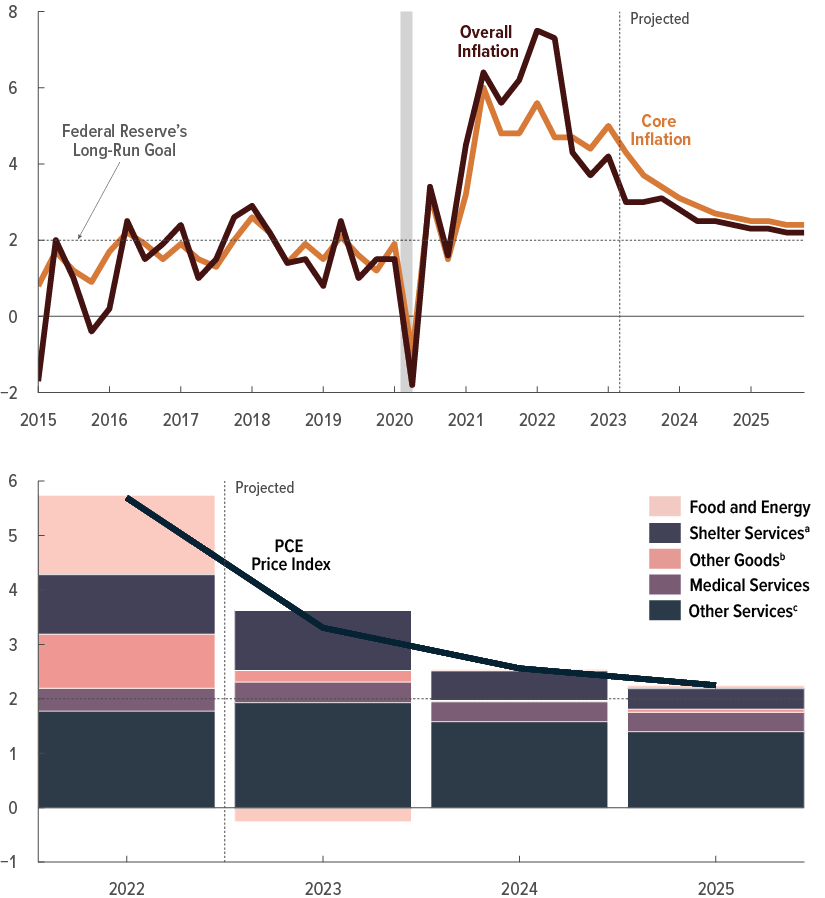
In CBO’s projections, inflation gradually slows as factors that caused demand to grow faster than supply in the wake of the coronavirus pandemic continue to ease. The rate of inflation continues to exceed the Federal Reserve’s long-run goal of 2 percent, but it approaches that goal in 2025.
The alleviation of upward pressures on the prices of goods, including food and energy, and the downward pressure on inflation in the price of shelter services stemming from monetary policy are key forces driving the decline in projected inflation through 2025.
Data sources: Congressional Budget Office; Bureau of Economic Analysis. See www.cbo.gov/publication/59258#data.
In the top panel, inflation is measured from one quarter to the next and expressed as an annual rate. The overall inflation rate is the rate of growth in the PCE price index; the core inflation rate excludes prices for food and energy. The shaded vertical bar indicates a period of recession. (A recession extends from the peak of a business cycle to its trough.)
In the bottom panel, inflation is measured from the fourth quarter of one calendar year to the fourth quarter of the next. Values in the bars represent the contributions, in percentage points, of each category of goods and services to the growth rate of the PCE price index. The sum of those contributions equals the overall growth of that index.
PCE = personal consumption expenditures.
a. The value of the services that housing units provide to their occupants, reflecting the rental value of housing occupied by tenants and the imputed rental value of owner-occupied housing.
b. Core durable and nondurable goods, including vehicles and parts, electronics, home furnishings, and apparel.
c. Core services (other than shelter services and medical services), including transportation and recreation services.
Inflation is expected to decline throughout 2023 and 2024 for three main reasons:
- Overall and core inflation, measured year over year, had already begun to slow in the first quarter of 2023 as supply-side pressures on the prices of many goods, including food and energy, abated. CBO expects that trend to continue through the end of 2023.
- Slower economic growth in 2023 and the higher unemployment rate are projected to put downward pressure on price growth, because they slow demand and inhibit increases in wages (which contributes to increases in the prices of certain services).
- Higher interest rates are expected to put downward pressure on the prices of certain goods and services—especially shelter services and other goods and services whose prices are highly sensitive to interest rates.6 Slowing growth in home prices, including declines in some regions, is expected to pass through to the prices of shelter services. In CBO’s projections, inflation in such prices eases throughout the second half of 2023.
Those three factors drive continued declines in projected inflation through 2025.
Inflation in the prices of nonenergy services is projected to decline more slowly than inflation in other sectors because such prices are more sensitive to labor market conditions and wage growth. In CBO’s projections, the lingering effects of tight labor markets and above-trend wage growth in 2022 and 2023 cause inflation in the price of nonenergy services to remain elevated through 2025.
Monetary Policy and Interest Rates
In CBO’s projections, the Federal Reserve further increases the target range for the federal funds rate in mid-2023 and leaves it unchanged for several months thereafter. As a result, the federal funds rate rises to 5.4 percent and remains at that level through the first quarter of 2024. In the second quarter of 2024, the Federal Reserve begins normalizing monetary policy by lowering the target range for the federal funds rate.7
CBO expects the Federal Reserve’s tightening of monetary policy to slow the growth of overall demand in 2023 and 2024—and thus to reduce inflationary pressures—by increasing real interest rates. In the agency’s projections, the real federal funds rate rises from 0.9 percent in the first quarter of 2023 to 2.7 percent in the first quarter of 2024 before falling thereafter.8 The Federal Reserve lowers the target range for the federal funds rate as inflation nears its long-run goal of 2 percent.
In CBO’s projections, interest rates on short-term Treasury securities, which generally move in concert with the Federal Reserve’s target range for the federal funds rate, remain higher for several quarters than they have been at any time over the past two decades. The interest rate on three-month Treasury bills rises to 5.3 percent in mid-2023 and remains above 5.0 percent through the first quarter of 2024. As the Federal Reserve lowers the target range for the federal funds rate, the interest rate on three-month Treasury bills falls—to 4.2 percent in the fourth quarter of 2024 and to 3.2 percent in the fourth quarter of 2025.
Interest rates on long-term Treasury securities are expected to remain elevated through the end of 2024. In CBO’s projections, the interest rate on 10-year Treasury notes is 4.0 percent in the fourth quarter of 2023 and stays near that level through the fourth quarter of 2024. In addition to raising the target range for the federal funds rate through the middle of 2023, the Federal Reserve continues reducing the size of its balance sheet in 2023 and 2024; both actions put upward pressure on long-term interest rates.9 The spread between long-term and short-term interest rates increases throughout 2024, consistent with historical trends observed during periods of weakness in the overall economy.
After 2024, interest rates on long-term Treasury securities are expected to fall as the rates on short-term securities decline. In CBO’s projections, the interest rate on 10-year Treasury notes declines from 4.0 percent in the fourth quarter of 2024 to 3.5 percent in the fourth quarter of 2025 as the waning of inflationary pressures in the economy prompts a decrease in short-term interest rates. In the past, declines in short-term interest rates have been accompanied by declines in long-term interest rates. One possible explanation for that historical relationship is that when interest rates on short-term bonds fall, savers—seeking higher interest rates—are more willing to buy long-term bonds, putting downward pressure on their interest rates.
Fiscal Policy
CBO’s projections reflect federal fiscal policies under current law, which affect the agency’s estimates in a variety of ways. In particular, the agency’s projections incorporate the assumption that caps on discretionary funding set by the Fiscal Responsibility Act will constrain the growth of discretionary outlays and debt held by the public.10 Over the period discussed in this report, that slower growth in federal spending is projected to dampen economic growth, resulting in decreased spending on goods and services, increased unemployment, lower inflation, and lower interest rates.
Uncertainty About the Economic Outlook
CBO develops its projections so that they fall in the middle of the likely range of outcomes under current law. But those projections are highly uncertain, and many factors could lead to different outcomes. For example, wage and price inflation could diverge from the agency’s forecast if faster- or slower-than-projected GDP growth led to unexpected developments in labor market conditions or if labor market conditions had greater or lesser effects on inflation than anticipated. Interest rates could likewise be higher or lower than CBO projects, and their effects on the demand for goods and services and the demand for labor could be larger or smaller than expected.
Comparison With CBO’s February 2023 Economic Projections
GDP growth and the labor market were stronger in the fourth quarter of 2022 and the first half of 2023 than CBO projected in its February 2023 forecast, which was completed in early December 2022.11 The agency now forecasts slower growth of GDP in the second half of 2023 and in 2024 than it did previously (see Table 3). The forecast for overall PCE inflation in 2023 is unchanged, but prices are now projected to rise more rapidly in 2024 than previously expected. The agency’s projections of short-term interest rates have risen since February.
Table 3.
Comparison of CBO’s Current and Previous Economic Projections for 2022 to 2025

Data sources: Congressional Budget Office; Bureau of Labor Statistics; Federal Reserve. See www.cbo.gov/publication/59258#data.
GDP = gross domestic product; PCE = personal consumption expenditures.
a. Real values are nominal values that have been adjusted to remove the effects of changes in prices.
b. Excludes prices for food and energy.
c. The consumer price index for all urban consumers.
d. The employment cost index for wages and salaries of workers in private industries.
Output
Real GDP grew faster in the fourth quarter of 2022 and the first quarter of 2023 than CBO projected in its February forecast. Over that period, real GDP grew at an average annual rate of 1.9 percent; in CBO’s February forecast, it was projected to decline at an average annual rate of 0.2 percent. The biggest contributors to that difference were higher-than-expected net exports, government purchases, and residential investment. Real GDP is also estimated to have grown by 1.4 percent in the second quarter of 2023—rather than declining by 0.4 percent, as CBO projected in February.
In the current projections, real GDP grows at an average rate of 0.4 percent in the second half of 2023, down from the 0.9 percent rate projected in February because of slower growth in consumer spending. CBO has also reduced its projections of real GDP growth in 2024 and 2025 since February. Projected GDP growth in 2024 has fallen from 2.5 percent to 1.5 percent, partly because higher projected interest rates led the agency to lower its projections of consumer spending, business investment, and net exports. Projected growth in 2025 has fallen from 2.6 percent to 2.4 percent, reflecting slower growth in business fixed investment and net exports.
The Labor Market
CBO’s current projections of labor market conditions in 2023 reflect higher-than-expected GDP growth early in the year as well as recent strength in the labor market. In February, the agency projected that the unemployment rate in 2023 would average 4.7 percent; in the current projections, the unemployment rate in 2023 has fallen to 3.7 percent. The agency’s current projection of the labor force participation rate in 2023 is 62.5 percent, up from 62.2 percent in February. And employment is currently projected to increase by an average of 205,000 jobs per month in 2023. In February, by contrast, CBO projected that employment would remain roughly unchanged in 2023.
The agency’s projection of growth in hourly wages and salaries in 2023 has increased since February. That change reflects an increase in projected price inflation, a determinant of hourly wage growth.
CBO’s projections of unemployment rates in 2024 and 2025 have fallen since February. CBO expects employment growth in those years to be slower than previously forecast, but projected levels of employment are higher because of the faster projected employment growth in 2023. Projected labor force participation rates in 2024 and 2025 have risen, as has projected growth in hourly wages and salaries.
Inflation
The agency’s projection of overall inflation in 2023 as measured by the PCE price index has not changed since February. However, the CPI-U is now projected to grow by 3.3 percent in 2023, down from 4.0 percent in the agency’s previous projections. That downward revision reflects smaller-than-expected increases in the prices of food and energy in the first quarter of the year and smaller projected increases in those prices over the remainder of the year. Those changes outweigh larger projected increases in other prices.
The agency’s projections of the core inflation indexes, which exclude food and energy prices, have risen. In February, CBO projected that inflation in the core PCE price index would be 3.4 percent in 2023, whereas the current projection of the increase in that index in 2023 is 4.1 percent. Similarly, the agency previously forecast that inflation in the core CPI-U would be 4.2 percent in 2023, whereas the current projection of inflation for that index in 2023 is 4.5 percent.
CBO’s projections of core and overall CPI-U and PCE inflation in 2024 have seen increases ranging from 0.1 percentage point to 0.3 percentage points; those upward revisions reflect persistently high inflation in the prices of nonenergy services. The agency’s projection of PCE inflation in 2025 remains unchanged, but the projection of CPI-U inflation has been revised up by 0.1 percentage point.
Interest Rates
CBO now expects short-term interest rates over the 2023–2025 period to be higher than it forecast in February. The average interest rate on three-month Treasury bills over that period is 1.1 percentage points higher than it was in the February forecast. That upward revision mostly reflects the Federal Reserve’s response to persistent inflationary pressures. The agency now anticipates that, in response to those pressures, the Federal Reserve will keep the target range for the federal funds rate higher for longer than previously projected.
By contrast, CBO’s projections of long-term interest rates over the 2023–2025 period have changed little since February. The projected interest rate on 10-year Treasury notes is slightly higher in 2024 and slightly lower, on average, in 2025. Those revisions reflect a change in the agency’s methodology for projecting long-term interest rates in the near term. The new methodology better reflects the historical relationships between the interest rates on long-term and short-term Treasury securities.
Comparison With Other Economic Projections
CBO’s projections can differ from those of other forecasters because of differences in the economic data available when the forecasts were completed, differences in the economic and statistical models used to prepare them, and differences in assumptions about fiscal and monetary policy. This section compares CBO’s forecast with those of the Federal Reserve Bank of Philadelphia’s Survey of Professional Forecasters (SPF) and the Federal Open Market Committee (FOMC) of the Federal Reserve Board.
The Survey of Professional Forecasters
CBO’s economic projections can be compared with the projections of the roughly 40 forecasters participating in the SPF.12 CBO’s projections of real GDP growth for 2023 and 2024 are within the middle two-thirds of the ranges of SPF forecasts, but projected growth for 2025 is below the middle two-thirds of the range of the SPF forecasts (see Figure 2). The agency’s projections of both the unemployment rate and PCE price inflation are within the ranges of SPF forecasts for 2023, 2024, and 2025. CBO’s projections of interest rates on 3-month Treasury bills and 10-year Treasury notes are at or above the high end of the middle two-thirds of the ranges of SPF forecasts for 2023 and 2024.
Figure 2.
A Comparison of CBO’s Forecasts of Output, Unemployment, Interest Rates, and Inflation With Those in the Survey of Professional Forecasters
Percent
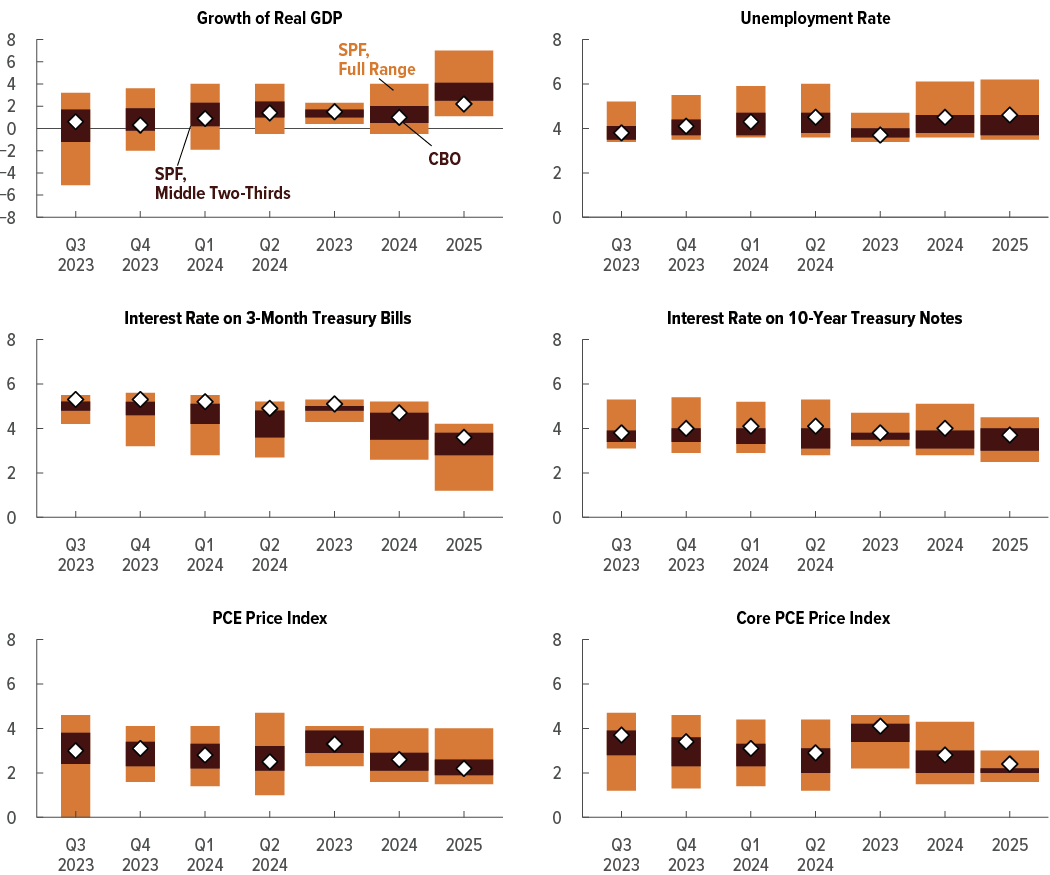
Data sources: Congressional Budget Office; Federal Reserve Bank of Philadelphia, Survey of Professional Forecasters: Second Quarter 2023 (May 12, 2023), https://tinyurl.com/3y2cshem. See www.cbo.gov/publication/59258#data.
The full range of forecasts from the Survey of Professional Forecasters is based on the highest and lowest of the roughly 40 forecasts. The middle two-thirds of that range omits the top one-sixth and the bottom one-sixth of the forecasts.
Real values are nominal values that have been adjusted to remove the effects of changes in prices. Quarterly growth of real GDP is measured from one quarter to the next and expressed as an annual rate. Annual GDP growth is measured from one calendar year to the next.
The unemployment rate is the number of people not working who are available for work and are either seeking work or expecting to be recalled from a temporary layoff, expressed as a percentage of the labor force.
Quarterly growth of PCE inflation is measured from one quarter to the next and expressed as an annual rate. Annual PCE inflation is measured from the fourth quarter of one calendar year to the fourth quarter of the next. The core PCE price index excludes prices for food and energy.
GDP = gross domestic product; PCE = personal consumption expenditures; SPF = Survey of Professional Forecasters.
The Federal Reserve
CBO’s forecast can also be compared with those made by the FOMC. For the most part, the agency’s projections of real GDP growth, the unemployment rate, and PCE inflation in 2023, 2024, and 2025 are within the central tendencies in the Federal Reserve’s most recent Summary of Economic Projections (see Figure 3).13 However, CBO’s projection of the unemployment rate in 2024 is above the Federal Reserve’s central tendency, as is its projection of GDP growth in 2025. The agency’s projections of the federal funds rate in 2023, 2024, and 2025 are within the range of the Federal Reserve’s forecasts.
Figure 3.
A Comparison of CBO’s Economic Forecasts With Those of the Federal Reserve
Percent
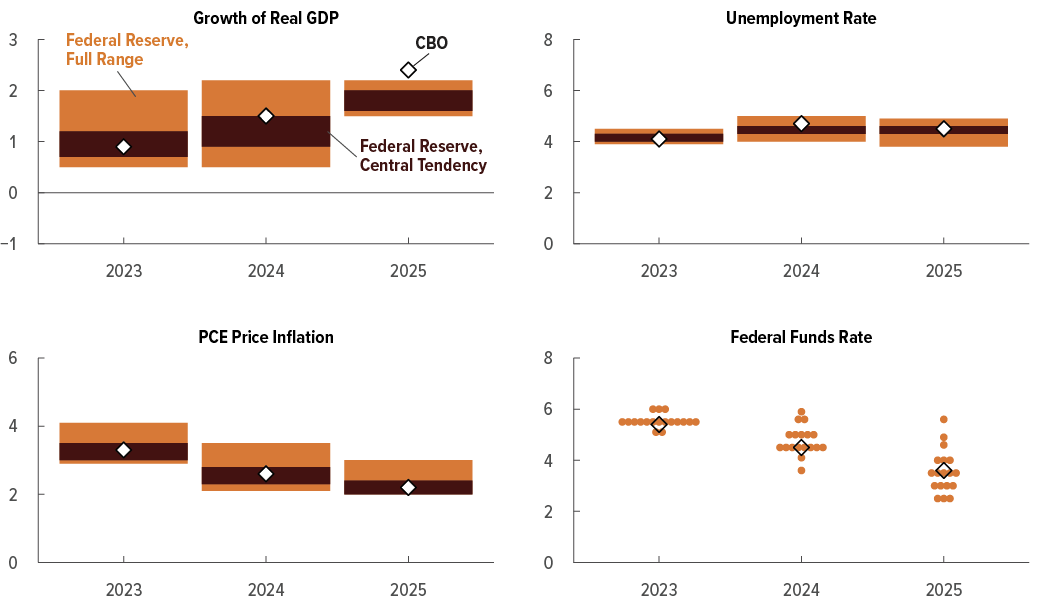
Data sources: Congressional Budget Office; Board of Governors of the Federal Reserve System, Summary of Economic Projections (June 14, 2023), Table 1, https://tinyurl.com/3nmsjb9a (PDF). See www.cbo.gov/publication/59258#data.
The full range of forecasts from the Federal Reserve is based on the highest and lowest of the 18 projections by the Board of Governors and the presidents of the Federal Reserve banks. The central tendency is, roughly speaking, the middle two-thirds of the full range, formed by removing the three highest and three lowest projections.
Real values are nominal values that have been adjusted to remove the effects of changes in prices. Real GDP growth is measured from the fourth quarter of one calendar year to the fourth quarter of the next.
The unemployment rate is the number of people not working who are available for work and are either seeking work or expecting to be recalled from a temporary layoff, expressed as a percentage of the labor force. The unemployment rate is a fourth-quarter value.
Inflation rates are measured from the fourth quarter of one calendar year to the fourth quarter of the next.
The federal funds rate is the interest rate that financial institutions charge each other for overnight loans of their monetary reserves. Each data point for the federal funds rate represents a forecast made in June 2023 by one of the members of the Federal Reserve Board or one of the presidents of the Federal Reserve banks. The Federal Reserve officials’ forecasts of the federal funds rate are for the rate at the end of the year, whereas CBO’s forecasts are fourth-quarter values.
GDP = gross domestic product; PCE = personal consumption expenditures.
1. See Board of Governors of the Federal Reserve System, “The April 2023 Senior Loan Officer Opinion Survey on Bank Lending Practices” (May 8, 2023), https://tinyurl.com/2npfy7yj, and “The January 2023 Senior Loan Officer Opinion Survey on Bank Lending Practices” (February 6, 2023), https://tinyurl.com/mtz8u9ns.
2. See Federal Reserve Bank of New York, Quarterly Report on Household Debt and Credit (May 2023), https://tinyurl.com/yr4deyde.
3. CBO’s measure of the exchange value of the dollar is an export-weighted average of exchange rates between the dollar and the currencies of leading U.S. trading partners.
4. CBO calculates the economic growth of leading U.S. trading partners by using a weighted average of their growth rates. That measure also uses shares of U.S. exports as weights.
5. The labor force participation rate is the percentage of people in the civilian noninstitutionalized population who are at least 16 years old and have jobs or are available for work and either seeking work or expecting to be recalled from a temporary layoff.
6. Shelter services, as defined by the Bureau of Labor Statistics, measure the flow of housing services that housing units provide to their occupants. The prices of such services are a component of inflation as measured by the PCE price index and the CPI-U, whereas house prices are not included in those measures.
7. The Federal Reserve is said to be normalizing monetary policy when it moves toward a policy setting that neither stimulates nor restrains economic activity.
8. CBO calculates the real federal funds rate by subtracting a measure of short-run expected inflation from the nominal federal funds rate. That measure of short-run expected inflation is CBO’s forecast for the average growth rate of the core PCE price index over the next four quarters.
9. The Federal Reserve’s balance sheet shows its assets and liabilities. The central bank pays for financial assets primarily by creating bank reserves and issuing Federal Reserve notes (or paper currency), which are liabilities. Reducing the size of its balance sheet means that the Federal Reserve reduces its assets and liabilities by an equal amount.
10. Spending that is funded through or controlled by appropriations is generally classified as discretionary. Discretionary spending encompasses an array of federal activities, including most defense spending and many nondefense activities, such as elementary and secondary education, housing assistance, the administration of justice, highway programs, and international affairs. For the effects of the act on federal debt, see Congressional Budget Office, How the Fiscal Responsibility Act of 2023 Affects CBO’s Projections of Federal Debt (June 2023), www.cbo.gov/publication/59235. After 2025, the smaller amount of federal borrowing projected under the act would boost private investment above what it otherwise would be, increasing economic growth.
11. See Congressional Budget Office, The Budget and Economic Outlook: 2023 to 2033 (February 2023), www.cbo.gov/publication/58848.
12. See Federal Reserve Bank of Philadelphia, Survey of Professional Forecasters: Second Quarter 2023 (May 12, 2023), https://tinyurl.com/3y2cshem.
13. See Board of Governors of the Federal Reserve System, Summary of Economic Projections (June 14, 2023), Table 1, https://tinyurl.com/3nmsjb9a (PDF). The full range of forecasts from the Federal Reserve is based on the highest and lowest projections made by the members of the Board of Governors and the presidents of Federal Reserve banks; the central tendency is the range formed by removing the three highest and three lowest forecasts.
This document is one of a series of reports on the state of the economy that the Congressional Budget Office issues each year. In keeping with CBO’s mandate to provide objective, impartial analysis, this report makes no recommendations.
CBO consulted members of its Panel of Economic Advisers during the development of this report. Although the agency’s outside advisers provided considerable assistance, they are not responsible for the contents of this report; that responsibility rests solely with CBO.
Mark Lasky wrote the report. Christina Hawley Anthony, Sebastien Gay, and John McClelland provided helpful comments. The economic forecast and related estimates were prepared by Nicholas Abushacra, Grace Berry, Aaron Betz, Daniel Fried, Edward Gamber, Ron Gecan, Mark Lasky, Chandler Lester, Michael McGrane, Christine Ostrowski, Jeffrey Schafer, and Matthew Wilson. Nicholas Abushacra and Grace Berry fact-checked the report. The writing of the report and the preparation of the forecast were supervised by Robert Arnold, Richard DeKaser, and Devrim Demirel.
Mark Doms, Jeffrey Kling, and Robert Sunshine reviewed the report. Christine Browne edited it, Jorge Salazar created the graphics, and R. L. Rebach prepared the text for publication. The report is available on CBO’s website at www.cbo.gov/publication/59258.
CBO seeks feedback to make its work as useful as possible. Please send comments to communications@cbo.gov.

Phillip L. Swagel
Director