
At a Glance
The Department of the Navy (DoN), which encompasses the Navy and the Marine Corps, uses two different databases to track the availability of its aircraft—that is, the percentage of time an aircraft can be flown on training or operational missions. Those databases are the Decision Knowledge Programming for Logistics Analysis and Technical Evaluation system (known as DECKPLATE) and the Aviation Maintenance Supply Readiness Report system (AMSRR). DECKPLATE is the official tracking program for Navy and Marine Corps aircraft. It contains monthly data on the availability of individual aircraft dating back to 1990. However, DoN says that the AMSRR system, which was introduced in the mid-2010s, better describes the availability of the department’s aircraft.
To compare the availability rates measured by DECKPLATE and AMSRR, the Congressional Budget Office examined monthly, aircraft-level data from 2017 to 2021 for F/A-18E/F Super Hornet fighter aircraft, part of the fleet that forms the mainstay of naval shipborne aviation. CBO’s analysis reached the following conclusions:
- AMSRR and DECKPLATE use different methods for measuring aircraft availability. AMSRR is forward-looking, allowing operational commanders to project whether aircraft will be able to fly that day. DECKPLATE is retrospective, measuring how many hours aircraft were actually available.
- Availability rates measured by AMSRR were higher than rates measured by DECKPLATE. Throughout the 2017–2021 period, AMSRR’s average availability rates for Super Hornets exceeded DECKPLATE’s average availability rates. The difference between the two systems’ average rates widened in each year of that period. In addition, AMSRR showed an increase in Super Hornet availability from 2018 to 2021 that was not as clearly visible in DECKPLATE.
- AMSRR’s availability rates better predict actual flying hours for Super Hornets. Although DECKPLATE’s availability rates are supposed to reflect the actual hours aircraft were available, CBO found what appear to be data errors in DECKPLATE. As a result, AMSRR’s availability rates more closely correlated with the actual hours that Super Hornets were flown.
- Apparent data errors in DECKPLATE reduce its value in predicting flying hours. Both databases raise some concerns about data integrity. However, CBO found many fewer data problems in AMSRR than in DECKPLATE. For example, both systems showed that certain aircraft had 100 percent availability in months when they were not flown, which DoN experts told CBO is probably not accurate. In the case of DECKPLATE, aircraft did not fly in 59 percent of the months that showed 100 percent availability; the corresponding figure for AMSRR was 2 percent.
- Removing data with apparent errors makes DECKPLATE’s correlation between availability and actual flying hours similar to AMSRR’s. DoN told CBO that the department is working to improve the quality of its aircraft availability data. If the data in DECKPLATE were more accurate, that system’s measurements of availability might match actual flying hours just as well as, or even better than, AMSRR’s measurements do.
Notes
Unless this report indicates otherwise, the years referred to are federal fiscal years, which run from October 1 to September 30 and are designated by the calendar year in which they end.
The figures in this report were created by the Congressional Budget Office using data from the Department of the Navy’s Decision Knowledge Programming for Logistics Analysis and Technical Evaluation (DECKPLATE) and Aviation Maintenance Supply Readiness Report (AMSRR) systems.
On the cover: An F/A-18F Super Hornet flying over the aircraft carrier USS Gerald R. Ford in 2017. U.S. Navy photo by Erik Hildebrandt.
The availability of military aircraft is an important metric that the Congress and the Department of Defense track carefully. Often expressed as a mission-capable rate, availability is the percentage of time a military service’s aircraft are ready to perform missions. The Congress and the military also pay close attention to the number of hours that aircraft are flown. The Congressional Budget Office has reported extensively on availability and flying hours for aircraft operated by the Air Force or by the Navy and Marine Corps, which are part of the Department of the Navy (DoN).1
CBO’s previous analyses of DoN aircraft were based on data from the Decision Knowledge Programming for Logistics Analysis and Technical Evaluation (DECKPLATE) system. In recent years, the Navy has been using a second data system, the Aviation Maintenance Supply Readiness Report (AMSRR), to report aircraft availability rates to the Congress. In this analysis, CBO compares availability data from DECKPLATE and AMSRR for F/A-18E/F Super Hornet fighter aircraft. AMSRR shows higher availability rates for those aircraft than DECKPLATE does. CBO finds that AMSRR’s availability rates correlate more closely with actual flying hours for Super Hornets, in part because data errors appear to be more common in DECKPLATE than in AMSRR.
Overview of the Two Data Systems for Aircraft Availability
DECKPLATE is DoN’s official program for accounting for its inventory of Navy and Marine Corps aircraft. The system is designed to be used by maintenance and logistics personnel. It records monthly availability rates and flying hours for individual aircraft (identified by bureau numbers) back to 1990. Availability rates in DECKPLATE are calculated using details of maintenance tasks performed on aircraft.
AMSRR is a newer system that is designed to be used daily by commanders. Whereas DECKPLATE records the actual number of hours in a month that aircraft were coded as being available, AMSRR is a once-per-day snapshot that projects an aircraft’s ability to perform missions that day. According to DoN, the AMSRR system better describes the availability of aircraft for operations. For instance, DoN says that if an aircraft does not need to be flown at night, its operational value is not diminished if it is undergoing maintenance overnight. AMSRR records an operational commander’s answer to the question, “Will an aircraft be ready to operate today?” rather than, “Is it ready now?” Thus, AMSRR is arguably more subjective than DECKPLATE.
Although AMSRR is updated daily, the data that DoN gave CBO to analyze were monthly summaries for individual Super Hornet aircraft. Those monthly data go back to March 2017, which is too recent for the sort of long-term trend analyses that CBO has performed with DECKPLATE data. As the period of time covered by AMSRR grows in the future, opportunities for longer trend analyses will increase.
CBO’s Approach to Analyzing Availability Data
CBO analyzed monthly availability rates from DECKPLATE and AMSRR for individual aircraft in the Super Hornet fleet over the 55 months from March 2017 to September 2021. The analysis covered 585 Super Hornets and 30,451 aircraft-month observations. (Not all of the aircraft were in the fleet for all 55 months.) Data on flying hours for each aircraft came from DECKPLATE.
CBO augmented the data from both systems to fill in missing months. If a Navy aircraft spends an entire month undergoing maintenance in a depot, it is termed “out of reporting,” and that month is usually missing from the databases. Missing months could be identified for a specific aircraft because that aircraft would reappear in the data once it returned to reporting. CBO inserted the missing months into both databases by showing the total hours the aircraft was in the Navy’s possession as equal to the hours in the month (such as 744 hours in a 31-day month) but with zero available hours and zero flying hours. Those additions allowed CBO to analyze all of the months from March 2017 to September 2021 that a specific Super Hornet was in the Navy’s possession.
For each aircraft and month, CBO compared actual flying hours from DECKPLATE with the measures of aircraft availability from DECKPLATE and AMSRR. CBO’s hypothesis was that more flying hours would be seen in months with higher aircraft availability rates.
Measurements of Monthly Availability Rates and Usage for Super Hornets in DECKPLATE and AMSRR
CBO analyzed how each database measured monthly availability rates and compared those rates with how Super Hornets were actually used from March 2017 to September 2021.
DECKPLATE and AMSRR Measure Availability Differently
To compute annual fleetwide availability rates from DECKPLATE and AMSRR, CBO aggregated the monthly data for all Super Hornets to calculate the percentage of those aircraft that were available, on average, at a given point in a year. For each year of the 2017–2021 period, AMSRR reported greater fleetwide availability than DECKPLATE did, and the difference between the two measures increased through that period.
AMSRR was designed to give commanders a sense of how many aircraft can fly during the current day, so it reports the expected readiness of aircraft that day. If a commander says an aircraft will be ready to operate that day, the aircraft is credited with being 100 percent available. By contrast, DECKPLATE was designed for aircraft maintenance personnel, so it reports the number of hours in a day that an aircraft was actually available.
Annual Availability Rates for the Super Hornet Fleet
Percent

In recent years, AMSRR reported higher fleetwide availability rates for Super Hornets than DECKPLATE did. AMSRR also showed an increase in availability from 2018 to 2021 that was not as clearly visible in DECKPLATE’s data.
Availability Rates for Individual Aircraft Were Often Higher in AMSRR
From March 2017 to September 2021, AMSRR frequently reported higher availability rates than DECKPLATE did for the same aircraft. During that period, AMSRR’s availability rates were higher than DECKPLATE’s in 66 percent of the aircraft-month observations for individual Super Hornets. The two databases had equal rates in 25 percent of the observations, and DECKPLATE’s rates were higher than AMSRR’s in the other 9 percent.
That difference is evident from a comparison of availability rates for a specific F/A-18F (bureau number 165669). For that aircraft, AMSRR reported a higher availability rate than DECKPLATE did in 39 of the 55 months in CBO’s analysis. The opposite was true in 9 of those months, and the two systems showed equal rates in the other 7 months. The months when AMSRR showed a higher rate may reflect a situation in which a few hours of maintenance were needed each day but the aircraft was otherwise available. The months when AMSRR showed a lower rate may reflect a situation in which the Super Hornet was available to fly when operational commanders had not thought it would be able to.
Monthly Availability Rates for a Specific Super Hornet
Percent
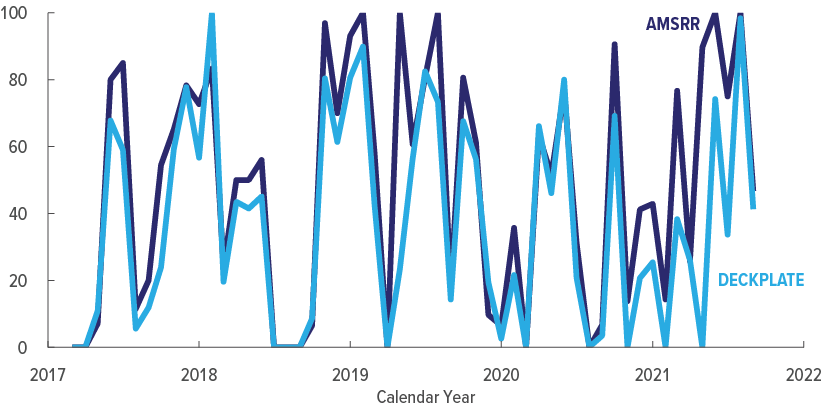
For an illustrative F/A-18F aircraft, availability rates from AMSRR and DECKPLATE were positively correlated (meaning that they generally moved in tandem), but AMSRR’s rates were usually higher.
Months With 100 Percent Availability Were Much More Common in AMSRR
Certain availability rates appear with different frequency in the two databases. Nearly half of AMSRR’s monthly availability rates were either zero or 100 percent. DECKPLATE had many more aircraft-month observations with availability rates between 10 percent and 60 percent than AMSRR did. DECKPLATE rarely reported 100 percent availability of an aircraft for a month, perhaps because aircraft were often receiving routine maintenance overnight.
The differences in the frequency of specific availability rates reflect the different approaches used in the two databases. Because AMSRR reports 100 percent availability for aircraft expected to fly that day, whereas DECKPLATE reports the actual number of hours each day an aircraft was available, it follows that AMSRR would report more aircraft with 100 percent availability in a month and that DECKPLATE would report a broader distribution of monthly rates.
Frequency of Various Monthly Availability Rates
Percentage of Observed Months

Over the 2017–2021 period, AMSRR reported many more months with 100 percent availability for Super Hornets than DECKPLATE did. The two data systems reported similar numbers of months with zero availability.
AMSRR’s Fleet Availability Rates Have Risen Relative to DECKPLATE’s
The gap between the two systems’ annual measures of fleetwide availability for Super Hornets grew from 9 percentage points in 2017 to 22 percentage points in 2021. One reason for the widening gap is that the share of aircraft-month observations in AMSRR showing 100 percent availability has increased since 2018. In 2021, 28 percent of monthly observations for individual Super Hornets showed 100 percent availability in AMSRR, compared with 2 percent of observations in DECKPLATE.
It is not surprising that AMSRR’s rates are higher than DECKPLATE’s, given that the data in AMSRR reflect near-term predictions of an aircraft’s availability that may not be realized. But there is no clear reason why AMSRR’s availability rates have increased over time relative to DECKPLATE’s. One possibility is that the widening gap reflects an increase in operational commanders’ optimism about the likelihood that aircraft would fly.
Difference Between AMSRR’s and DECKPLATE’s Annual Availability Rates for the Super Hornet Fleet
Percentage Points

The extent to which AMSRR’s annual availability rate for the Super Hornet fleet exceeds DECKPLATE’s rate has grown in recent years.
Share of Months With 100 Percent Availability Rates for Super Hornets
Percent

In 2020 and 2021, AMSRR reported markedly more Super Hornets with 100 percent monthly availability rates than DECKPLATE did.
Data Show No Clear Trend in Super Hornet Usage
In addition to reporting availability, DECKPLATE tracks how much individual aircraft have been flown. From March 2017 to September 2021, Super Hornets averaged 21 flying hours per month each. During that period, 29 percent of aircraft-month observations showed no flying hours—a large portion of which represented aircraft undergoing depot maintenance. When Super Hornets did fly, they most often logged between 15 hours and 20 hours in a month.
Monthly Flying Hours per Super Hornet Aircraft
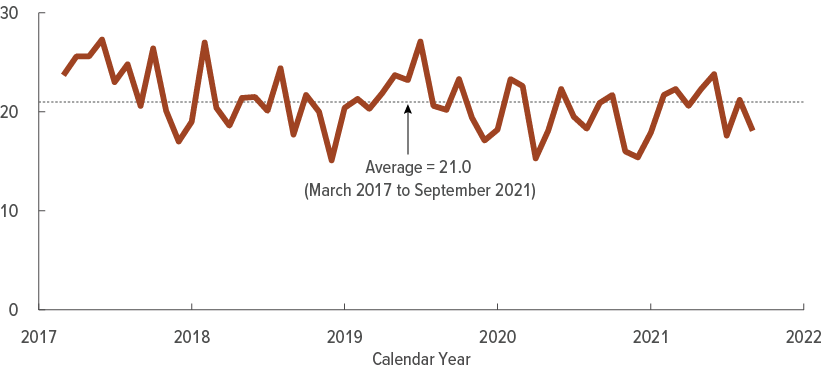
The average amount of time a Super Hornet spends in the air has varied widely from month to month in recent years, with no clear trend over time.
Frequency of Various Amounts of Monthly Flying Hours
Percentage of Observed Months
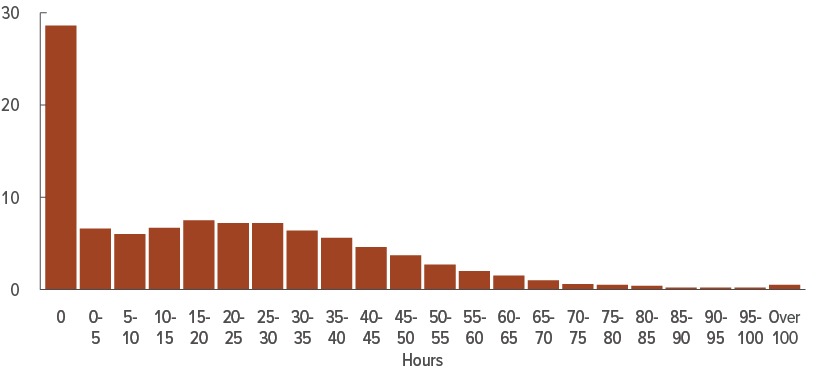
In 90 percent of the aircraft-month observations in CBO’s analysis, Super Hornets flew 50 or fewer hours in a month, although occasionally an aircraft had much higher monthly usage.
Comparing Availability Rates and Flying Hours for Super Hornets
For this analysis, CBO explored relationships between availability rates measured using DECKPLATE and AMSRR and the amount of time Super Hornets were flown. CBO’s hypothesis was that an aircraft’s monthly availability rates would be positively correlated with its flying hours (meaning that both would generally move in the same direction). CBO found that AMSRR’s availability rates were more highly correlated with flying hours than DECKPLATE’s, largely because of apparent errors in availability data in DECKPLATE.
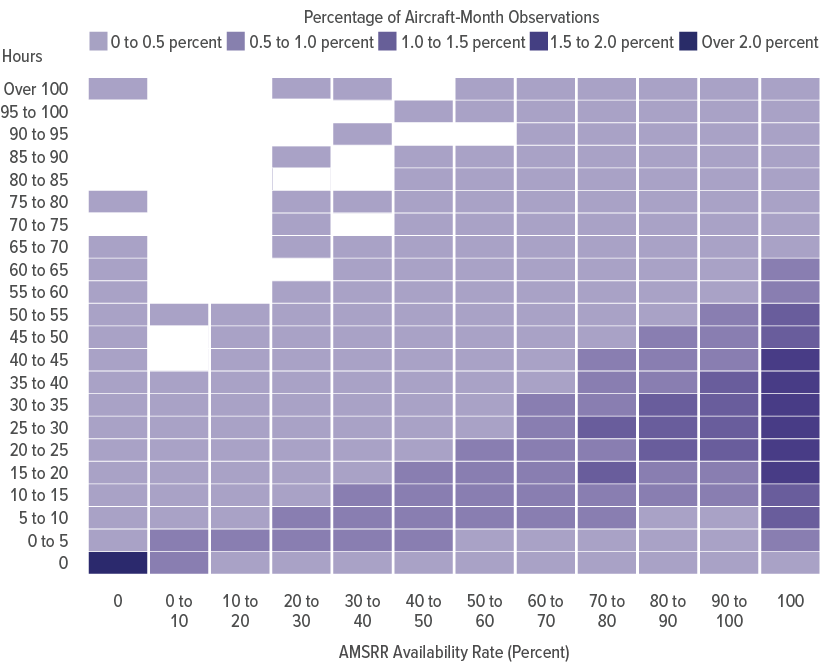
The three graphics in this section are “heat maps,” which compare the frequency with which various pairs of values occur for two variables (either availability rates in DECKPLATE and AMSRR, as below, or one database’s availability rates and actual flying hours). In each heat map, the darkest color corresponds to the pairs of values that appear most frequently in the data—in this case, in more than 2.0 percent of total observations. Increasingly lighter colors represent combinations of values that appear less frequently. Blank cells represent combinations not seen in the data, such as months in which an aircraft has an availability rate of 80 percent to 90 percent according to DECKPLATE but zero to 10 percent according to AMSRR.
Comparing DECKPLATE’s and AMSRR’s Availability Rates
A positive correlation existed between availability rates for Super Hornets in the two databases during the 2017–2021 period (with a correlation coefficient of 0.72 on a scale of -1 to 1). Many aircraft-month observations showed zero availability in both databases; those observations often represented aircraft undergoing maintenance in depots. When both databases showed positive availability rates, AMSRR’s rates were typically higher.
Frequency of Various Monthly Availability Rates in DECKPLATE Versus in AMSRR

Aircraft that DECKPLATE showed as being 60 percent to 90 percent available in a month were frequently reported as 100 percent available in AMSRR. That difference is consistent with the different purposes of the two databases.
Comparing DECKPLATE’s Availability Rates and Flying Hours
Availability rates and monthly flying hours for Super Hornets in DECKPLATE have been positively correlated (with a correlation coefficient of 0.60). A puzzling aspect of that relationship is the frequency with which aircraft had a 100 percent availability rate in a month but no flying hours (the cell in the bottom right-hand corner of the heat map). Of the 804 aircraft months in which a Super Hornet was recorded as 100 percent available in DECKPLATE, the aircraft was not flown in 476 (59 percent) of those months. Experts at the Department of the Navy told CBO that those results were largely data errors in which an aircraft should not have been recorded as being 100 percent available.
If the observations of nonflying aircraft with 100 percent availability were removed from the sample, the average availability rate for Super Hornets measured by DECKPLATE over the 2017–2021 period would decline from 40 percent to 39 percent.
Frequency of Various Availability Rates in DECKPLATE Versus Monthly Flying Hours

Most Super Hornets reported in DECKPLATE as having zero availability in a month did not fly. There was a positive correlation between DECKPLATE’s availability rates and flying hours, except for aircraft that were shown as 100 percent available.
Comparing AMSRR’s Availability Rates and Flying Hours
The positive correlation between Super Hornet availability rates and monthly flying hours was greater for AMSRR than for DECKPLATE (a correlation coefficient of 0.68 versus 0.60), CBO found. One reason for AMSRR’s higher correlation is that, of the 6,026 aircraft months in which a Super Hornet had 100 percent availability, the aircraft was not flown in just 125 (2 percent) of those months—a much lower percentage than the 59 percent seen in DECKPLATE. Those 125 observations with 100 percent availability and no flying hours in a month (the cell in the bottom right-hand corner) made up only 0.4 percent of total observations in AMSRR, compared with 1.6 percent in DECKPLATE.
Frequency of Various Availability Rates in AMSRR Versus Monthly Flying Hours
Most Super Hornets reported in AMSRR as having zero availability in a month did not fly. Aircraft with 100 percent availability most frequently flew between 15 hours and 45 hours per month.
Possible Explanations for the Greater Correlation Between AMSRR’s Availability Rates and Flying Hours
The finding that AMSRR’s availability rates for Super Hornets were more highly correlated than DECKPLATE’s rates with monthly flying hours was surprising. AMSRR’s availability rates represent projections of whether an aircraft will be able to fly that day, not what actually happened, as in DECKPLATE. Yet DECKPLATE’s availability rates were not as highly correlated with monthly flying hours.
To learn more about the reasons for the differing results from the two databases, CBO conducted three examinations:
- Analyzing fleetwide availability rates and flying hours to see whether the rising availability rates reported in AMSRR were associated with more flying hours,
- Analyzing statistical relationships between aircraft-level availability rates and flying hours, and
- Analyzing the integrity of the data.
Those analyses suggest that, in light of DECKPLATE’s data errors, AMSRR’s availability rates better relate to flying hours for Super Hornet aircraft (though both databases’ availability rates are positively correlated with flying hours). DECKPLATE’s correlation with flying hours would approach that of AMSRR if apparent data errors, such as 100 percent available nonflying aircraft, were corrected.
Rising Availability in AMSRR, Trendless Availability in DECKPLATE, and Falling Fleetwide Flying Hours
CBO found that although AMSRR’s annual availability rates for the Super Hornet fleet rose from 2018 to 2021 (while DECKPLATE’s were largely trendless), annual flying hours per aircraft declined over the 2017–2021 period. That result, which may seem counterintuitive, occurred because total flying hours for Super Hornets became more evenly distributed across the fleet during that period. Fewer aircraft did not fly at all; in addition, fewer aircraft flew large numbers of hours. Total flying time decreased, but the percentage of aircraft that flew increased, consistent with AMSRR’s reported increase in availability rates.
Annual Fleetwide Availability Rates and Flying Hours per Aircraft
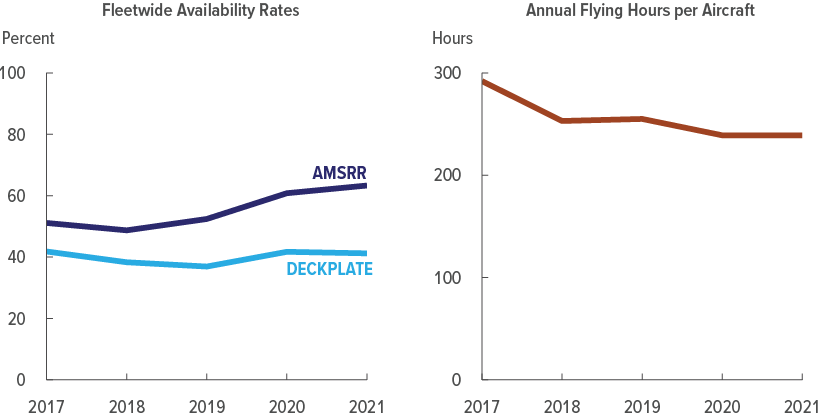
Annual flying hours per Super Hornet declined between 2017 and 2021, while annual availability rates for the Super Hornet fleet increased in AMSRR and showed no clear trend in DECKPLATE. (Numbers for fiscal year 2017 are annualized values based on data from March to September of that year.)
Frequency of Various Amounts of Monthly Flying Hours per Aircraft, by Year
Percent
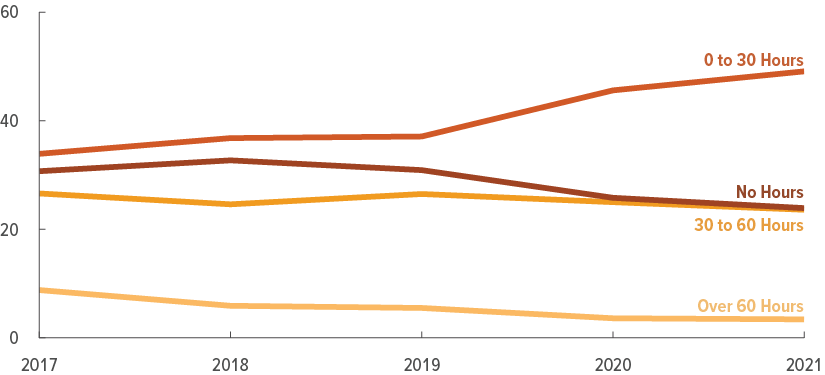
The 2019–2021 period saw an increase in the number of Super Hornets flying a modest number of hours per month and decreases in the number of aircraft not flying at all or flying more than 60 hours per month.
Correlations Between Availability Rates and Flying Hours
Correlation coefficients suggest that AMSRR’s availability rates better predict flying hours for Super Hornets than DECKPLATE’s availability rates do. In addition, the difference between the correlation coefficients for the two databases has been roughly the same each year. Although the gap between AMSRR’s and DECKPLATE’s availability rates for Super Hornets has widened over time, that growing difference has not had a noticeable effect on the correlations with flying hours seen here. If, for instance, AMSRR’s availability rates had been artificially inflated, the correlation between those rates and actual flying hours would be expected to have declined markedly. CBO did not find that outcome.
Correlations of Availability Rates With Flying Hours
Percent
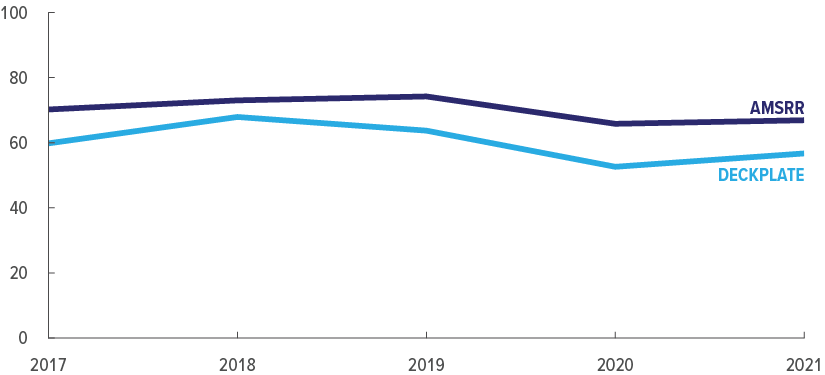
Each year from 2017 to 2021, there was a higher correlation between available hours reported in AMSRR and actual flying hours than between available hours reported in DECKPLATE and flying hours.
Apparent Data Errors That Reduce the Correlation Between DECKPLATE’s Availability Rates and Flying Hours
From 2017 to 2021, Super Hornets reported as 100 percent available in DECKPLATE were much more likely to not fly in a month than those reported as 100 percent available in AMSRR (59 percent of the time versus 2 percent). In addition, Super Hornets reported in DECKPLATE as having zero availability were more likely to fly than aircraft with that designation in AMSRR (14 percent of the time versus 4 percent).
According to DoN, its aircraft need to be flown at least once every 30 days; otherwise, they require a functional test flight. Thus, the finding of a large number of aircraft with 100 percent availability but no flying hours in a month is probably an issue of data integrity, department staff told CBO. Removing those problematic data makes the correlation between DECKPLATE’s availability rates and flying hours much more like that of AMSRR. DoN indicated to CBO that department leaders will continue to educate and train maintenance personnel to adhere to published reporting standards.
Similar data errors appear to exist in DECKPLATE for Super Hornets before 2017 and for other types of aircraft. However, for Super Hornets over the 2017–2021 period, DECKPLATE recorded particularly high rates of aircraft with 100 percent availability that did not fly and aircraft with zero availability that did fly.
Percentage of Aircraft Months With 100 Percent Availability That Had No Flying Hours
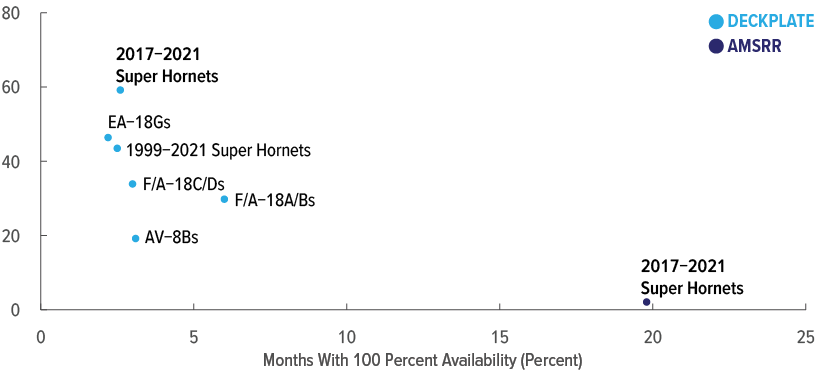
Fighter aircraft rarely had 100 percent availability rates in DECKPLATE (typically less than 5 percent of the time). But in months when they did, many of those aircraft were not flown.
Percentage of Aircraft Months With Zero Availability That Had Flying Hours
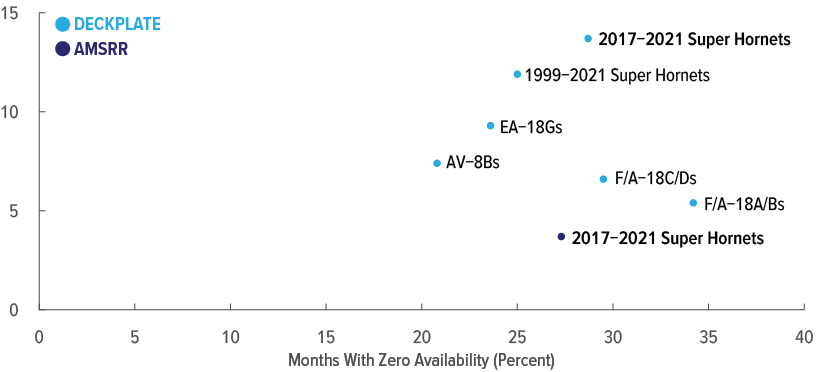
Fighter aircraft that were reported as having no availability in a month but that were flown nonetheless have not been uncommon in DECKPLATE.
1. See Congressional Budget Office, Availability and Use of Aircraft in the Air Force and Navy (January 2022), www.cbo.gov/publication/57433, and Availability and Use of the F/A-18E/F Super Hornet Fighter Aircraft (February 2023), www.cbo.gov/publication/58687.
About This Document
This report was prepared at the request of the Chairman and Ranking Member of the Subcommittee on Readiness of the House Armed Services Committee in the 117th Congress. In keeping with the Congressional Budget Office’s mandate to provide objective, impartial analysis, the report makes no recommendations.
Edward G. Keating, Kathryn McGinnis (formerly of CBO), and R. Derek Trunkey prepared the report with guidance from David Mosher. David Arthur, Ron Gecan, and Nianyi Hong provided assistance. Corinne Kramer fact-checked the report. S. Craig Goodwyn of CNA and Daniel Norton of the RAND Corporation provided comments on an earlier draft. The assistance of external reviewers implies no responsibility for the final product; that responsibility rests solely with CBO.
Mark Doms, Jeffrey Kling, and Robert Sunshine reviewed the report. Christian Howlett edited it, and R. L. Rebach created the graphics and prepared the text for publication. The report is available at www.cbo.gov/publication/59098.
CBO seeks feedback to make its work as useful as possible. Please send comments to communications@cbo.gov.

Phillip L. Swagel
Director
July 2023