
At a Glance
The Department of Defense uses unmanned aerial systems (UASs) for some intelligence, surveillance, and reconnaissance (ISR) missions. In this report, the Congressional Budget Office analyzes the usage patterns and costs of three UASs and six manned aircraft with similar ISR missions and compares the life-cycle costs per flying hour (acquisition costs per flying hour plus recurring costs per flying hour) of the Air Force’s unmanned RQ-4 and the Navy’s manned P-8.
Usage Patterns. Annually, UASs have flown about twice as many flying hours as manned ISR aircraft because they have flown longer sorties. They have also been destroyed at a considerably higher rate than manned systems.
Costs. UASs have had both lower acquisition costs and recurring costs per flying hour.
Comparison of the RQ-4 and the P-8. In CBO’s estimation, the life-cycle costs per flying hour of the RQ-4 are 17 percent less than those of the P-8, which is significantly smaller than the 38 percent difference between the recurring costs per flying hour of the two aircraft. Although RQ-4s cost less to acquire than P-8, the difference in life-cycle costs per flying hour is narrower than the difference in recurring costs per flying hour because RQ-4s are expected to have shorter life spans. On average, each RQ-4’s acquisition cost would be amortized over fewer flying hours than the acquisition cost of each P-8 would be; that difference would more than offset the lower acquisition costs of the RQ-4s.
Other Considerations. Cost is only one factor to consider when choosing between UASs and manned aircraft. In some situations and for some missions, UASs may be preferable because they may provide important operational advantages over manned aircraft. For example, UASs are especially well-suited for long duration ISR missions and operations in particularly dangerous settings because there is no risk of personnel onboard being captured or killed. But for some types of situations and missions, having people on board may enhance the mission’s military value and likelihood of success.
Usage Patterns and Costs of Unmanned Aerial Systems
For the past two decades, the Department of Defense (DoD) has been selectively using unmanned aerial systems (UASs) in place of manned intelligence, surveillance, and reconnaissance (ISR) aircraft, flying them for much longer durations, on average. UASs generally have lower recurring costs per flying hour than manned aircraft. However, comparing the life-cycle costs (including acquisition costs) per flying hour of the Air Force’s unmanned RQ-4 and the Navy’s manned P-8, the Congressional Budget Office found that UASs’ cost advantage may not be as large when the costs of acquiring the aircraft are considered.
Background
Conventional wisdom holds that UASs cost less than manned aircraft because they do not need life support equipment such as oxygen systems, cabin pressurization, and ejection seats. However, an earlier CBO analysis noted that the magnitude of UASs’ cost advantages was uncertain. (See Congressional Budget Office, Policy Options for Unmanned Aircraft Systems [June 2011], www.cbo.gov/publication/41448.) This report further assesses evidence about differences in usage patterns and life-cycle costs per flying hour associated with UASs, considering both up-front and recurring costs.
Although all nine manned and unmanned aircraft discussed in this report perform broadly similar missions, they have different capabilities:
- Unmanned aircraft may provide important operational advantages over manned aircraft in certain situations and for certain missions (and vice versa). For example, UASs are especially well-suited for long duration ISR missions and operations in particularly dangerous settings because there is no risk of personnel onboard being captured or killed.
- By contrast, missions requiring rapid responses, such as air-to-air combat, may require an operator on board because of UASs’ communication lags. In addition, a manned aircraft might generate more valuable intelligence per flying hour because experts are on board the aircraft. Thus, manned aircraft may provide military value relative to UASs that justifies a cost premium, although advances in technology may reduce or eventually eliminate those differences in capability.
CBO has no basis for comparing the value of ISR data produced by manned aircraft with that produced by UASs. Therefore, this analysis provides information about only one aspect (life-cycle costs) of the broader question of when UASs might be used in place of manned aircraft.
To conduct its analysis, CBO used the Air Force’s Reliability and Maintainability Information System (REMIS), which tracks the availability and flying hours of specific Air Force aircraft, and the Air Force Total Ownership Cost (AFTOC) system, which provides data on costs to maintain and operate the aircraft. CBO separately gathered estimates of the up-front acquisition costs of Air Force aircraft from historical Selected Acquisition Reports (SARs). For the P-8, CBO used the Navy’s DECKPLATE system and the P-8’s December 2019 SAR, which provide information about its availability, flying hours, acquisition costs, and maintenance and operating costs.
Aircraft
CBO examined three Air Force UASs (the MQ-1, MQ-9, and RQ-4), five manned Air Force aircraft (the E-3, E-8, RC-26, RC-135, and U-2), and one manned Navy aircraft (the P-8). The MQ-1 is now retired, but its data and usage patterns provide insight as to how Air Force UASs have performed.
Although those aircraft differ in many ways, all nine conduct broadly similar ISR missions. The manned ISR aircraft are capable of flying missions lasting many hours, and, with the exception of the U-2, they are all derivatives of commercial aircraft. (The U-2 was designed specifically for ISR.) The unmanned aircraft were also designed for ISR and can fly longer missions than the manned aircraft. The five manned Air Force ISR aircraft are the oldest of the group, and the Navy’s P-8 is the newest.
Appearance and Relative Size of Unmanned and Manned ISR Aircraft
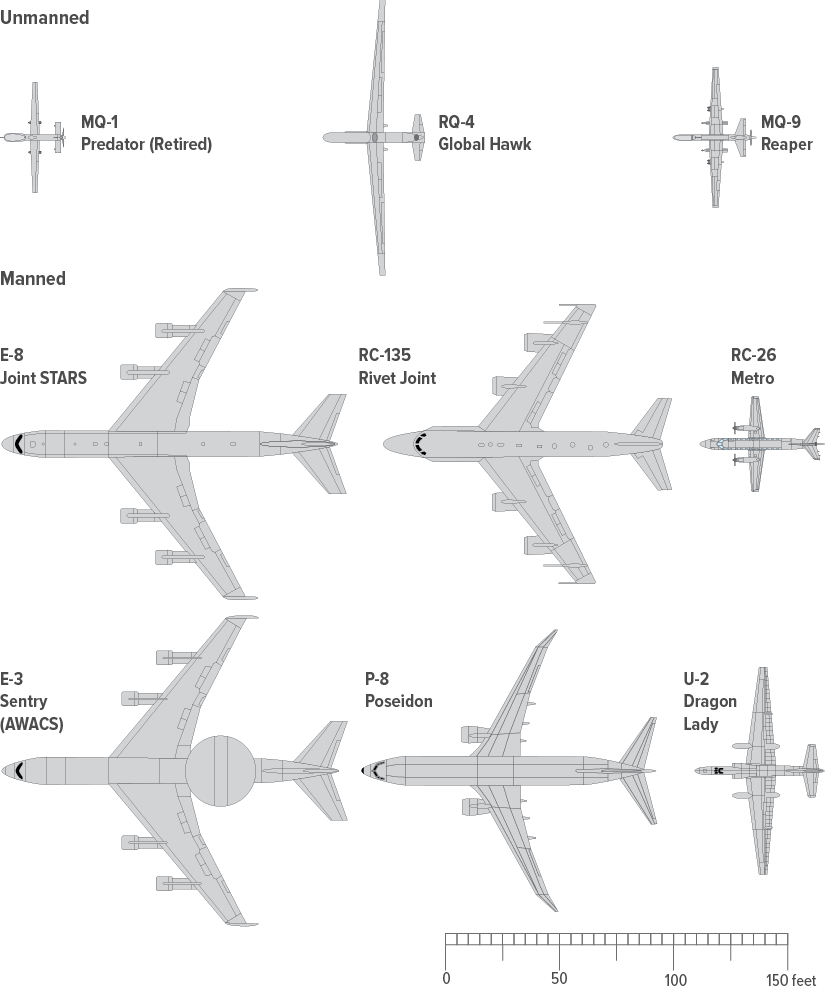
Unmanned systems that perform ISR missions are generally much smaller than manned systems. All of the unmanned aircraft have a single engine. By contrast, almost all of the manned aircraft (except the U-2) have at least two engines.
Flying Hours
Air Force UASs have flown considerably more hours per aircraft per year than manned aircraft have because they have flown longer sorties, not because they have flown more sorties. Although the MQ-1 is no longer in the force, its data remain relevant in a comparison of ISR aircraft usage patterns.
Average Flying Hours per Aircraft per Year, 2014 to 2018

Air Force UASs have flown roughly twice as many hours per aircraft per year, on average, as its manned ISR aircraft have flown.
Average Sortie Duration per Aircraft, 2014 to 2018

Air Force UASs can be airborne for lengths of time that would be challenging for human crews. However, depending on the situation, DoD may prefer two 8-hour manned sorties to one 16-hour UAS sortie.
Average Sorties per Aircraft per Year, 2014 to 2018

Air Force MQ-1s and RQ-4s have flown fewer sorties per year than manned aircraft have.
Availability
Aircraft availability refers to the percentage of mission-capable aircraft that is not in storage or undergoing repairs. (The Navy terms that rate  .) The availability of Air Force UASs has been higher than that of most manned ISR aircraft.
Aircraft Availability Rates, 2014 to 2018

Accidental Destruction
UASs have been destroyed in accidents at considerably greater rates than manned ISR aircraft.
Destroyed Aircraft per Million Flying Hours, 1994 to 2019

There are several possible explanations for the higher rate of UAS destruction shown here: They have a single engine (multi-engine aircraft are typically able to safely fly and land if one engine is disabled); they may be designed to lower safety standards because they do not carry people; and they have greater risk of destruction if they lose communication connectivity.
Aircraft Age
Measured by years in service, the Air Force’s oldest UASs are considerably newer than the Air Force’s oldest manned ISR aircraft; the Navy’s P-8 is even newer. The median ages (in years) of the UAS fleets and the P-8s are much lower than those of the Air Force’s manned aircraft.
The median lifetime flying hours of the UAS fleets is also lower than the Air Force’s manned ISR fleets’ median lifetime flying hours because the unmanned aircraft have been in service for less time—but the gap is narrower because the manned aircraft have been flown for fewer hours per year.
Fleet Ages, by Years of Service, as of December 31, 2019

The Air Force’s oldest UAS, an MQ-1, was about 20 years old when it was retired. By contrast, the RC-135s and some U-2s (both manned) have been in operation for more than 50 years.
The median ages of the P-8 and the UAS fleets are all less than 12 years; the median ages of the Air Force’s manned ISR fleets range from 19 years to 55 years.
Lifetime Flying Hours of Aircraft in Service on December 31, 2019
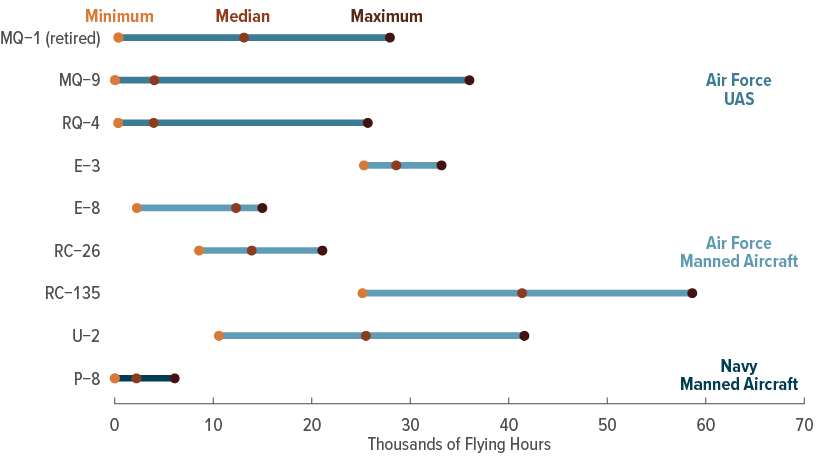
The UAS with the most lifetime flying hours (an MQ-9) has about 60 percent as many flying hours as the manned ISR aircraft with the most lifetime flying hours (an RC-135).
This figure shows lifetime flying hours of aircraft still in service as of December 31, 2019. (Other aircraft were retired or destroyed with fewer lifetime flying hours.)
How CBO Compared Aircraft Costs
Manned systems and UASs have different missions, are used in different ways, and process and analyze data in different places (onboard versus on the ground); those differences make comparing the systems complicated. Several existing manned ISR aircraft, such as the E-3, E-8, and RC-135, are based on 1960s-vintage 707 aircraft and may be more expensive to operate than future manned systems would be. Additionally, if one is considering future purchases, comparisons should include acquisition costs as well as operating costs.
CBO considered three types of costs for comparing aircraft:
- Recurring costs per flying hour, which are the annual operating and maintenance costs of a fleet divided by the number of flying hours that fleet accumulated during a year;
- Acquisition costs; and
- Life-cycle costs per flying hour, which include acquisition costs and costs per flying hour.
All costs in this analysis are expressed in 2020 dollars.
Recurring and Acquisition Costs
Air Force UASs have generally had lower recurring costs per flying hour and lower acquisition costs than manned aircraft. Many of the Air Force’s manned ISR aircraft that CBO analyzed are relatively old. (The RC-26, RC-135, and U-2 aircraft are old enough that CBO does not have reliable estimates of their acquisition costs.) Newer aircraft would probably have lower recurring costs per flying hour because, for example, they would have more efficient engines and smaller flight crews. However, those newer aircraft might also have greater constant-dollar acquisition costs (costs adjusted for economywide inflation) than those of the older aircraft. Additionally, the SAR’s projection of the P-8’s average recurring costs per flying hour uses a 25-year service life, but P-3s, the P-8’s antecedent system, range in age from 28 years to 54 years. Older P-8s would probably have greater recurring costs per flying hour; if the P-8 fleet remained in service for more than 25 years, its average recurring costs would probably be higher. CBO did not adjust for that factor.
Average Recurring Costs per Flying Hour, 2014 to 2018
Thousands of 2020 Dollars

Recurring costs of unmanned systems have generally been lower because the aircraft are smaller, have only one engine, and may not be maintained to the same safety standards as manned aircraft.
The manned RC-26 had especially low recurring costs because it is a small, commercially derived, turboprop aircraft.
Acquisition Costs per Aircraft
Millions of 2020 Dollars
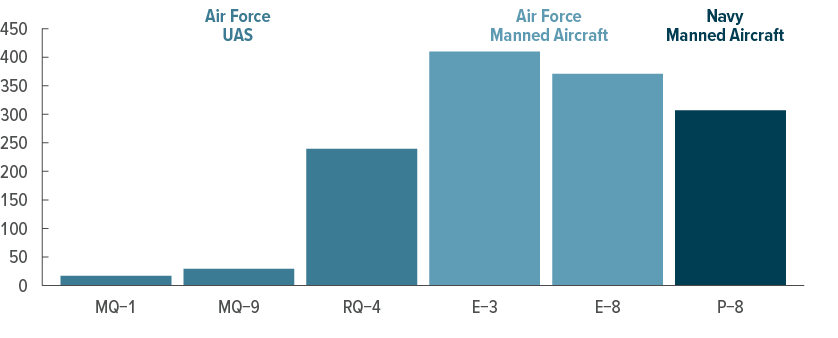
The MQ-1 and MQ-9 have cost less to acquire than the manned ISR aircraft, but the RQ-4 was much more costly than those other unmanned systems, in part because of its larger size and the sophistication of its sensors.
A Comparison of Life-Cycle Costs per Flying Hour
CBO examined the costs of the Air Force’s unmanned RQ-4 and the Navy’s manned P-8 to illustrate how the life-cycle costs per flying hour of an unmanned aircraft might be compared with those of a manned aircraft. CBO selected them because they have similar missions and technologies that are from the same era. (The Air Force’s manned aircraft considered in this report are much older than the RQ-4s and P-8s.) Although the P-8’s missions include antisubmarine and anti-surface ship warfare in addition to maritime ISR, it is similar to the RQ-4 in that it undertakes patrol missions lasting many hours.
When estimating life-cycle costs per flying hour, CBO included both acquisition and recurring costs. Considering the following factors, CBO found that the life-cycle costs per flying hour of the RQ-4 and P-8 are about $35,200 and $42,300, respectively; that 17 percent difference is much smaller than the estimated 38 percent difference in recurring costs for the two aircraft:
- Flying Hours. The RQ-4 averaged 945 flying hours per aircraft per year between 2014 and 2018. The P-8 SAR projects an average of 589 flying hours per aircraft per year, about 40 percent fewer than the RQ-4—although the P-8 fleet has had more flying hours in recent years.
- Attrition. The RQ-4 fleet has suffered a higher rate of attrition: Between 1994 and 2019, RQ-4s were destroyed at a rate of 23 aircraft per million flying hours, whereas the Navy has not lost a single P-8 to date. (The UAS accident rate has fallen over time.)
- Operating Costs. Between 2014 and 2018, RQ-4s had a recurring cost per flying hour of about $18,700, or 62 percent of the projected cost of about $29,900 for the P-8.
- Acquisition Costs. The RQ-4 was also less expensive to purchase. It had an average acquisition cost of $239 million per aircraft compared with $307 million for a P-8.
CBO used a 20-year life span as a starting point for its calculations because the Air Force has so far retired all of its UASs after about 20 years of service, but the agency also examined the effect that longer service lives would have on the RQ-4’s life-cycle costs. CBO projects that a P-8 could be operated for 50 years. That projection is double what is presented in the P-8’s SAR, but it is consistent with how long DoD has operated other manned ISR aircraft, including the P-3.
The RQ-4’s estimated costs reflect replacement every 20 years, plus 945 flying hours per aircraft per year. Because the RQ-4 faces a destruction rate of 23 per million flying hours, a larger fleet (about 22 percent larger than if the fleet faced no risk of accidental destruction) must be acquired to generate a desired number of fleet-wide flying hours. The P-8’s estimated costs reflect replacement every 50 years, plus 589 flying hours per aircraft per year.
To estimate life-cycle costs per flying hour, CBO used a present-value calculation, expressing future costs paid and hours flown in terms of up-front equivalent lump sums, discounting using a 0.7 percent long-term real interest rate. For more details on CBO’s calculations, see the appendix.
A Comparison of Unmanned RQ-4s and Manned P-8s

Sensitivity of the Life-Cycle Cost Comparison
A number of factors could affect the comparison between the life-cycle costs per flying hour of the two aircraft. For example, if RQ-4s were destroyed at a greater rate than they have been to date, their cost advantage relative to P-8s would decrease. Conversely, considering the possibility that P-8s could be accidentally destroyed would increase the RQ-4’s cost advantage.
The cost comparison could also change if the RQ-4s remained in the fleet for more than 20 years. If the operational service life of the RQ-4 was increased, its life-cycle costs per flying hour would diminish, but the effect would be modest. Holding other parameters constant, if RQ-4s operated for 50 years rather than 20 years, their life-cycle costs per flying hour would fall to about $28,200, a 20 percent reduction. However, that result incorporates projections that a much older RQ-4 would continue to have its current recurring costs per flying hour and would not need additional investment to keep it flying, which is unlikely. Adding in an age-driven increase in recurring costs per flying hour would reduce the cost advantage associated with keeping RQ-4s in operation for longer.
The Effects of Changing the RQ-4’s Destroyed Aircraft Rate
Life-Cycle Costs per Flying Hour (Thousands of 2020 dollars)

The cost advantage of the RQ-4s would disappear completely if they were destroyed at a rate of about 70 per million flying hours (triple the observed rate, denoted by the vertical line, and above the rate experienced by the MQ-1, the aircraft in this analysis with the highest accidental destruction rate).
The Effects of Longer RQ-4 Life Spans
Life-Cycle Costs per Flying Hour (Thousands of 2020 dollars)

Longer life spans would reduce the RQ-4’s life-cycle costs per flying hour, but the amount of those reductions would diminish as the aircraft aged.
AppendixThe Estimation of Life-Cycle Costs per Flying Hour
This appendix describes how the Congressional Budget Office estimated the life-cycle cost per flying hour of manned aircraft ( ) and unmanned aircraft (
 ).
).
The aircraft vary in certain ways, including the following:
- Up-front acquisition cost
 ;
; - Annual flying hours per aircraft
 ;
; - Recurring costs per flying hour
 ;
; - Life span in years
 ; and
; and - Destruction rate per million flying hours
 .
.
Consider a hypothetical manned aircraft. Its up-front acquisition cost would be  . If the aircraft was not at risk for being destroyed in an accident
  , the aircraft would fly
  hours per year, incurring costs of
  per year for
  years.
The discounted sum of costs and the discounted sum of flying hours (where  represents the real interest rate) would be, respectively,


The life-cycle cost per manned flying hour would therefore be

Now consider a hypothetical unmanned aircraft. As with a manned aircraft, it would have an up-front acquisition cost ( ). In the first year, the aircraft would fly
  hours, incurring costs of
  . However, the additional consideration of a destruction rate greater than zero
  modestly complicates the calculation for unmanned aircraft because it requires consideration of fractional “expected aircraft.” For each flying hour, there would be a probability
  that the aircraft would be accidentally destroyed. The probability that the aircraft would not be destroyed after one year of operation would be
  , so in the second year, the aircraft would be expected to fly
  hours, incurring costs of
  . Annual flying hours per aircraft would remain
  , but the number of aircraft would be expected to fall. In the third year, expected unmanned flying hours would again decrease to
  .
.
The unmanned aircraft’s discounted sum of costs and discounted sum of flying hours (where, again,  represents the real interest rate) would be, respectively,


In its analysis of the manned P-8’s and unmanned RQ-4’s life-cycle costs per flying hours, CBO used the following base case parameters for the six variables:
- Real Interest Rate. = 0.007.
- P-8. $307 million; 589; $29,896; 50; 0.
- RQ-4. $239 million; 945; $18,678; 20; 23.
The real interest rate is based on CBO’s projection of the average interest rate over the next 10 years after removing the effects of inflation—specifically, of the real rate on 30-year inflation-indexed securities.
Using those parameters, CBO found that the P-8’s life-cycle cost per flying hour would be about $42,300 and the RQ-4’s life-cycle cost per flying hour would be about $35,200, or 17 percent less.
About This Document
This Congressional Budget Office report was prepared at the request of the Ranking Member of the Senate Armed Services Committee. In keeping with CBO’s mandate to provide objective, impartial analysis, it makes no recommendations.
Edward G. Keating, John Kerman, and David Arthur of CBO’s National Security Division prepared the report with guidance from David Mosher. Alice Burns, Caroline Dorminey, Michael Falkenheim, and Avi Lerner provided assistance. Robert Carter and Joshua Wolfson, visiting fellows at CBO from the Air Force, also assisted. Michael Bennett fact-checked the report. Thomas Light of the RAND Corporation and J. J. Gertler and John Hoehn of the Congressional Research Service also provided comments. (The assistance of external reviewers implies no responsibility for the final product, which rests solely with CBO.)
Mark Doms, Jeffrey Kling, and Robert Sunshine reviewed the report. Caitlin Verboon was the editor, and R. L. Rebach was the graphics editor and cover illustrator. The report is available on CBO’s website (www.cbo.gov/publication/57090).
CBO continually seeks feedback to make its work as useful as possible. Please send any comments to communications@cbo.gov.

Phillip L. Swagel
Director
June 2021