
At a Glance
The federal government subsidizes health insurance for most Americans under age 65 through various programs and tax provisions. This report describes updated baseline projections by the Congressional Budget Office and the staff of the Joint Committee on Taxation (JCT) of the federal costs associated with each kind of subsidy and the number of people with different types of health insurance. Those projections incorporate an assumption that current laws governing health insurance coverage and federal subsidies for that coverage remain in place.
Federal Subsidies. In CBO and JCT’s projections, net federal subsidies (that is, the cost of all the subsidies minus the taxes and penalties) in 2021 for insured people are $920 billion, or 4.4 percent of gross domestic product (GDP). In 2030, that annual amount is projected to reach $1.4 trillion, also 4.4 percent of GDP. Over the 2021–2030 period, subsidies are projected to total $10.8 trillion.
- Medicaid and the Children’s Health Insurance Program (CHIP) account for about 45 percent of the federal subsidies annually during the period;
- Subsidies for employment-based coverage, about 35 percent;
- Payments for Medicare, about 15 percent; and
- Subsidies for coverage obtained through the marketplaces established by the Affordable Care Act or through the Basic Health Program, about 5 percent.
Health Insurance Coverage. In an average month each year during that period, between 238 million and 241 million people are projected to have health insurance, mostly from employment-based plans. Between 31 million and 32 million people are projected to be uninsured.
Effects of the Pandemic. Since CBO last issued baseline projections, in March 2020, the coronavirus pandemic has disrupted the economy, and millions of jobs have been lost. In the projections for the next few years, the loss of employment has these effects:
- It decreases estimated enrollment in and subsidies for employment-based insurance;
- It increases estimated enrollment in and subsidies for Medicaid and CHIP; and
- It increases, on net, the number of people estimated to be uninsured.
Legislative responses to the pandemic have, among other things, temporarily increased the share of Medicaid and CHIP costs paid by the federal government, allowed Medicaid and CHIP enrollees to remain enrolled through the end of the public health emergency regardless of changes in income, and provided forgivable loans and tax credits to businesses to help them retain employees. By CBO and JCT’s estimates, those laws have increased enrollment in Medicaid, as well as the average cost of Medicaid, and lessened the decline in employment-based insurance.
Compared with the March 2020 estimates, current projections show about 1 million more people uninsured in 2021, largely reflecting the effects of the pandemic.
Notes
Notes
The estimates presented here are based on the Congressional Budget Office’s economic forecast as of June 26, 2020, and premium forecast as of July 1, 2020, and on an assumption that current laws governing health insurance coverage and federal subsidies for that coverage remain in place. CBO and the staff of the Joint Committee on Taxation (JCT) have endeavored to develop budgetary estimates that are in the middle of the distribution of potential outcomes.
Given the rapidly changing economic environment and the uncertainty surrounding the length and severity of the 2020 coronavirus pandemic, the agencies’ estimates of health insurance coverage and federal subsidies are subject to significant uncertainty. Further, changes in federal laws could affect health insurance markets and federal subsidies for coverage.
Numbers may not add up to totals because of rounding. The sources of all figures in this report may be cited this way: Congressional Budget Office; staff of the Joint Committee on Taxation.
Estimates of health insurance coverage reflect average monthly enrollment during a calendar year and include spouses and dependents covered under family policies. The estimates are for the civilian noninstitutionalized population under age 65, which excludes members of the armed forces on active duty and people in penal or mental institutions or in homes for the elderly or infirm. The majority of individuals over age 65 are covered by Medicare.
Unless the report indicates otherwise, all years referred to in describing estimates of spending and revenues are federal fiscal years, which run from October 1 to September 30 and are designated by the calendar year in which they end.
Estimates by level of income are calculated using the projected income distribution from CBO’s health insurance model, HISIM2. Income in HISIM2 is based on income reported in the Current Population Survey—with various adjustments to better match tax data—that is then extended over the projection period to be consistent with CBO’s macroeconomic forecast of economic growth and projections of employment.
In most states, the federal poverty level (FPL) is $12,760 for a single person in 2020. For each additional person in a household, $4,480 is added. Income levels reflect modified adjusted gross income (MAGI) for the calendar year. MAGI equals gross income plus untaxed Social Security benefits, foreign earned income that is excluded from adjusted gross income, tax-exempt interest, and the income of dependent filers.
The sum of the estimates of the number of people enrolled in health insurance plans and the number of people who are uninsured exceeds the estimate of the total population under age 65 by between 12 million and 14 million every year of the projection period, because some people (about 5 percent of the insured population) will have multiple sources of coverage. To arrive at the estimates given in this report, CBO and JCT did not assign a primary source of coverage to people who reported multiple sources; the resulting amounts align better with estimates of spending as well as with information about health insurance coverage from household surveys and administrative data. (By contrast, when CBO and JCT have reported changes in the sources of insurance coverage stemming from proposed legislation, the agencies have used only people’s primary source of coverage to count them, an approach that has generally proved more useful for that purpose.)
Under the Affordable Care Act, states have the option to establish a Basic Health Program, which is primarily for people whose income is between 138 percent and 200 percent of the FPL. To subsidize that coverage, the federal government provides states with funding equal to 95 percent of the subsidies for which those people would have been eligible through a marketplace. States can use those funds, in addition to funds from other sources, to offer health insurance that covers a broader set of benefits or requires smaller out-of-pocket payments than coverage in the marketplaces does. Minnesota and New York have created a Basic Health Program.
In 2020, the Centers for Medicare & Medicaid Services made about $100 billion in accelerated and advance payments to certain providers under the Medicare program, and in its September baseline, CBO expects those amounts to be recouped through 2021. CBO has not estimated how much of the accelerated and advance payments was for beneficiaries under age 65. Accordingly, figures for Medicare spending for beneficiaries under age 65 exclude those payments and expected recoupment.
For details about the methods underlying the projections, see Congressional Budget Office, Federal Subsidies for Health Insurance Coverage for People Under 65: 2019 to 2029 (May 2019), www.cbo.gov/publication/55085.
For a discussion of how CBO and JCT project premiums, see Congressional Budget Office, Private Health Insurance Premiums and Federal Policy (February 2016), pp. 9–11, www.cbo.gov/publication/51130.
For a discussion of how CBO and JCT define health insurance coverage and the uninsured population, see Congressional Budget Office, Health Insurance Coverage for People Under Age 65: Definitions and Estimates for 2015 to 2018 (April 2019), www.cbo.gov/publication/55094.
For details about the uninsured population in 2019, see Congressional Budget Office, Who Went Without Health Insurance in 2019, and Why? (forthcoming, September 2020), www.cbo.gov/publication/56504.
Federal Subsidies for Health Insurance Coverage for People Under 65: 2020 to 2030
In a report issued each year, the Congressional Budget Office and the staff of the Joint Committee on Taxation (JCT) provide projections of health insurance coverage for people under age 65 and the federal costs of that coverage for that year and the following decade. Net federal subsidies for that coverage are projected to total $920 billion in 2021 and $1.4 trillion in 2030. Measured as a share of gross domestic product (GDP), the subsidies are an estimated 4.4 percent in both years.
Projected Subsidies for Health Insurance Coverage
For people under 65, the federal government subsidizes health insurance in several ways: by giving tax benefits for employment-based coverage, by providing a majority of funding for Medicaid and the Children’s Health Insurance Program (CHIP) (states provide the remainder), and by offering tax credits to eligible people who purchase coverage through the health insurance marketplaces established by the Affordable Care Act (ACA). The federal government also provides coverage through the Medicare program to people under 65 who receive benefits from the Social Security Disability Insurance program or who have been diagnosed with end-stage renal disease.
Average federal subsidies for health insurance per recipient differ because the people who are eligible for and enrolled in each type of insurance differ by age, health status, income, and disability status; because the federal government subsidizes the coverage to different extents; and because the prices paid to providers differ for different types of coverage.
Federal Health Insurance Subsidies
Billions of Dollars

In 2021, the federal government is projected to spend $433 billion for Medicaid and the Children’s Health Insurance Program and $303 billion on support for employment-based coverage for people under age 65. By the end of the decade, the costs for those two largest categories of subsidies are projected to rise to $569 billion and $516 billion, respectively.
Percentage of Gross Domestic Product

As a percentage of GDP, federal subsidies for employment-based coverage and Medicare are projected to grow over the coming decade, while those for Medicaid and CHIP and for nongroup coverage and the Basic Health Program are projected to decrease.
Average Federal Subsidies for Recipients, by Type of Health Insurance
Dollars

Over the 2021–2030 period, average subsidies are projected to grow—those for employment-based coverage and Medicare at higher rates than those for other forms of insurance. Differences in the rates of growth are mainly due to policy changes that are scheduled to take effect during the period, including changes in tax rates pertaining to employment-based coverage and the expiration of an increase in the share of Medicaid costs paid by the federal government.
Projected Private Health Insurance Premiums
Total federal subsidies for employment-based insurance and nongroup coverage depend on total premiums. In the case of employment-based coverage, a person’s contributions toward premiums are excluded from taxable income, so as premiums rise, the subsidy the person receives increases as his or her contribution toward premiums increases—so larger subsidies go to people with higher income. In the case of nongroup coverage, someone who is eligible to receive a subsidy through a marketplace and selects the benchmark plan is required to pay a designated amount of his or her income toward premiums, and the subsidy covers the remainder. (A benchmark plan is the second-lowest-cost silver plan available in the marketplace in any given area.)
CBO and JCT project spending by private health insurers on health care and administration on the basis of trends in premium growth and of projected growth in personal income, which affects people’s ability to buy health insurance.
Between 2020 and 2030, private health insurance spending per enrollee, which is the basis for nongroup and employment-based premiums, is projected to grow by an average of 5 percent per year. In that same period, premiums for benchmark plans used to determine subsidies in the nongroup market are projected to grow by an average of 4 percent per year. Most of the premium growth over time is attributable to the changes in projected health care spending per person.
Annual Percentage Change in Gross Premiums for Benchmark Plans and Private Health Insurance Spending

The decline in marketplace benchmark premiums in 2020 occurred for three main reasons: Insurers recorded profits in 2019; fewer people lived in areas where there was little competition among insurers; and federal programs implemented in some states protected insurers from risks of high medical costs. Those premiums are expected to increase in 2021 because, CBO and JCT anticipate, insurers will set premiums with the expectation that much of the care deferred in 2020 will occur in 2021.
Projected Health Insurance Coverage
To estimate the net effects that subsidies have on the federal budget, CBO and JCT project the number of people with different types of health insurance coverage. By those estimates, of the 271 million people under age 65 in 2021, 151 million will have coverage through an employer, and close to 32 million will be uninsured. In 2030, when the population is estimated to be the same size, 155 million are projected to have coverage through an employer, and 31 million, to be uninsured. In percentage terms, enrollment in Medicaid and CHIP is estimated to be slightly smaller in 2030 than in 2021, and the portion of the population that will be enrolled in employment-based coverage, slightly larger.
The types of coverage that people enroll in vary substantially depending on their income.
Health Insurance Coverage by Type and Income

In 2021, of the 93 million people under age 65 with income below 150 percent of the federal poverty level (FPL), a majority, 57 million, are estimated to be enrolled in Medicaid or CHIP, and 13 million, to be uninsured.
Of the 89 million people under age 65 with income between 150 percent and 400 percent of the FPL, 54 million are estimated to be enrolled in employment-based insurance, and 12 million are estimated to be uninsured.
The vast majority of people under age 65 with income above 400 percent of the FPL are estimated to be enrolled in employment-based insurance. In the underlying data, the income of some Medicaid and CHIP enrollees appears higher than the programs’ upper income limits. That can be the case, for example, when income is low during the initial months of enrollment but much higher in others.
Composition of the Uninsured Population
CBO and JCT consider people uninsured if they are not covered by an insurance plan or enrolled in a government program that provides financial protection from major medical risks. Uninsured people receive some types of health care and are often not required to pay the full cost of that care, but they have substantially less access to care and financial protection than do insured people. Uninsured people who are eligible for Medicaid have more financial protection than others because they can enroll at any time—in some cases, as they are seeking care in hospitals or other settings—and may receive coverage retroactively. Some people may be eligible for multiple sources of coverage. To characterize the uninsured population, CBO and JCT classified people who lack insurance into mutually exclusive groups on the basis of the most heavily subsidized option available to them or the primary reason they were ineligible for subsidized coverage.
Composition of the Uninsured Population, 2021
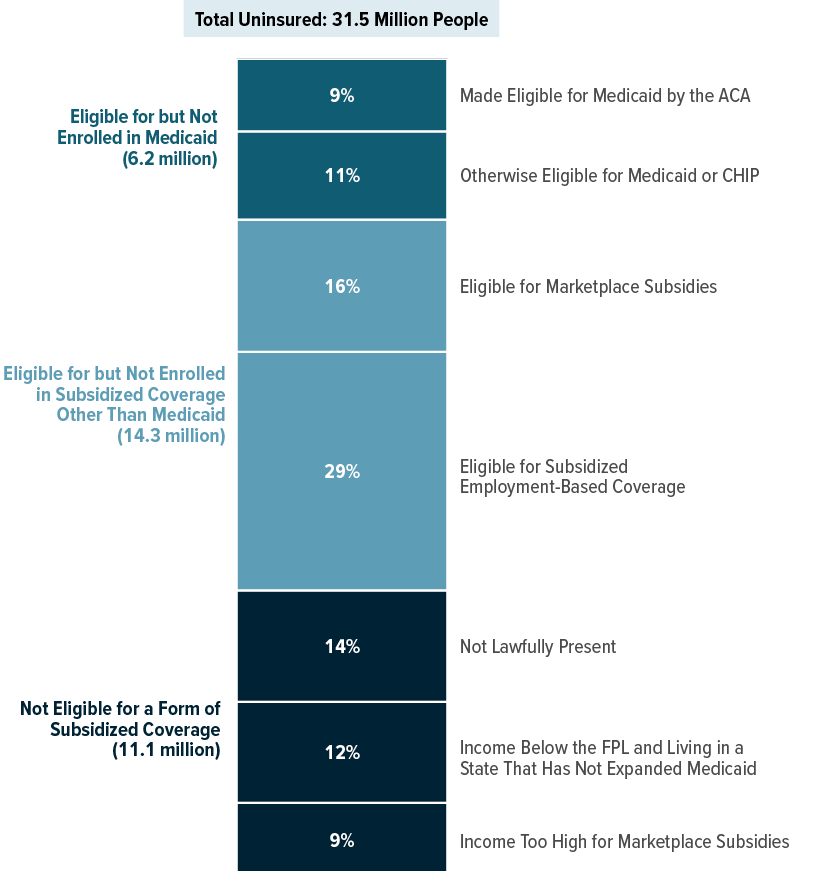
In CBO and JCT’s projections, among the 31.5 million people uninsured in 2021, 65 percent, or 20.5 million people, are eligible for but not enrolled in a form of subsidized coverage, including employment-based coverage, Medicaid, or subsidies in one of the marketplaces.
Composition of the Uninsured Population by Income, 2021

In CBO and JCT’s projections, in 2021, among the 13.0 million uninsured people with income under 150 percent of the FPL, about 4 million, or 30 percent, have income less than 100 percent of the FPL and live in a state that has not expanded Medicaid.
Among the 11.6 million uninsured people with income between 150 percent and 400 percent of the FPL, about 5 million, or 40 percent, are eligible for marketplace subsidies.
Of the 6.9 million uninsured people with income above 400 percent of the FPL, about 60 percent have access to subsidized employment-based coverage but declined the offer.
* = Between 1 and 100,000.
Enrollment in and Spending for Medicaid and CHIP
Medicaid is jointly financed by state governments and the federal government; the federal government pays for roughly 65 percent of the cost of services, on average. Like Medicaid, the Children’s Health Insurance Program (CHIP) is also jointly financed by state governments and the federal government. In that program in 2020, the federal government will pay roughly 80 percent of the cost of services, and from 2021 to 2029, about 70 percent, as higher matching rates established by the ACA and the HEALTHY KIDS Act end.
The Families First Coronavirus Response Act (enacted on March 18, 2020) increased the federal medical assistance percentage, or FMAP (the formula that determines the matching rate for Medicaid), by 6.2 percentage points for the duration of the public health emergency for most enrollees. The law also increased the matching rate for CHIP by about 5 percentage points for the same period. Additionally, the law required states to allow people to remain enrolled in Medicaid and CHIP during that period regardless of changes in their circumstances.
Share of Enrollment in and Spending for Medicaid and CHIP, by Eligibility Category, 2021
Percentage of Total

People in different eligibility categories for Medicaid and CHIP account for very different shares of enrollment and spending. For example, children are projected to constitute 43 percent of Medicaid enrollment but only 24 percent of spending in 2021, whereas people with disabilities are projected to account for 10 percent of enrollment and 33 percent of spending. Individuals made eligible for Medicaid by the ACA are estimated to constitute 18 percent of enrollment and 22 percent of spending.
Effects of Recently Enacted Legislation on Medicaid and CHIP Spending, by Eligibility Category, 2021
Percentage of Total Additional Spending

The increased FMAP accounts for $30 billion, or 7 percent, of total federal spending on Medicaid and CHIP in 2021. By CBO’s estimates, a majority of the added funds will be spent on individuals eligible for Medicaid because they are blind or disabled. Under the law, the increased FMAP does not apply to spending for those made eligible by the ACA.
Effects of Employment Loss on Insurance Coverage in 2020
The coronavirus pandemic has caused major economic disruptions. However, less than 30 percent of job losses in 2020 are projected to also result in a loss of access to employment-based insurance, in large part because those job losses are concentrated among small firms and lower-wage service industries, where health insurance offers are less common, and because many job losses are temporary, with firms allowing workers to retain their offer during the furlough. Among those losing access to employment-based coverage, about one-third are projected to enroll in Medicaid or subsidized nongroup coverage.
CBO and JCT estimate that the full-year-equivalent number of people who have lost or will lose their job—permanently or temporarily—as a result of the pandemic will be 14.3 million for 2020. (That figure is smaller than the number of people who lost jobs at specific points of the year because nearly all of them worked the first few months of 2020, and many will resume work before the year ends.) In the projections, of those 14.3 million people, many did not lose employment-based insurance: 7.1 million (slightly less than 50 percent) did not have an offer of employment-based insurance, and 3.3 million (slightly more than 20 percent) temporarily lost their job but retained an offer of employment-based insurance and their employer’s contributions to premiums while furloughed.
The remaining 3.9 million people (less than 30 percent) permanently have lost or will lose their job in 2020; they had an offer of employment-based insurance through that job that they also lost. (That change in the number of offers to employees differs from the estimates of changes in the numbers of people with employment-based coverage discussed elsewhere in this report for three reasons: not all offers are accepted, some accepted offers that are lost result in a loss of coverage for dependents as well as employees, and some employees who lose coverage through their own job are able to enroll in employment-based coverage through a spouse or parent.)
Employment Loss Due to the Coronavirus Pandemic and Resulting Insurance Coverage, 2020
Millions of People

In CBO and JCT’s projections for 2020, the loss of employment-based coverage is almost all among the (full-year-equivalent) 3.9 million people who permanently have lost or will lose their job and had an offer of employment-based insurance through that job: 1.3 million of them are uninsured, and the others obtain new coverage. Despite losing their offer of employment-based insurance, slightly more than 1 million still have employment-based coverage by either opting to continue their coverage under provisions of COBRA (the Consolidated Omnibus Budget Reconciliation Act) or enrolling in coverage through the employer of a spouse or parent.
Changes Since March 2020 in Projections of Subsidies and Sources of Coverage
Since CBO and JCT’s previous projections, in March 2020, the agencies have increased their estimate, for the 2021–2030 period, of the net federal subsidies for health insurance coverage for people under age 65 from $10.7 trillion to $10.8 trillion. The net increase results primarily from including the federal government’s spending on Part D (prescription drugs) of Medicare in the September 2020 estimates to more accurately represent the government’s expenditures for individuals under 65 enrolled in Medicare. Without that change, the current estimate of net federal subsidies would show a reduction from the previous one, reflecting the effects of the coronavirus pandemic, tempered by the legislation enacted in response.
The agencies’ estimates account for the effects of the Coronavirus Aid, Relief, and Economic Security (CARES) Act (enacted on March 27, 2020) and the Paycheck Protection Program and Health Care Enhancement Act (enacted on April 24, 2020), which provided forgivable loans and new tax credits to offset employers’ payroll costs and some of their other expenses.
Since CBO and JCT’s previous estimates in March, the Families First Coronavirus Relief Act (enacted on March 18, 2020) required states to allow people to remain enrolled in Medicaid for the duration of the public health emergency even if their circumstances change, providing them with continuous coverage during that period. During the emergency, states receive higher matching rates from the federal government if they maintain coverage for all Medicaid enrollees regardless of changes in income or circumstances that otherwise would cause them to lose eligibility. In addition, states must not enact stricter eligibility standards, increase Medicaid premiums, or establish any cost sharing for services related to COVID-19, the disease caused by the coronavirus.
Comparison of Estimates of Employment-Based Coverage
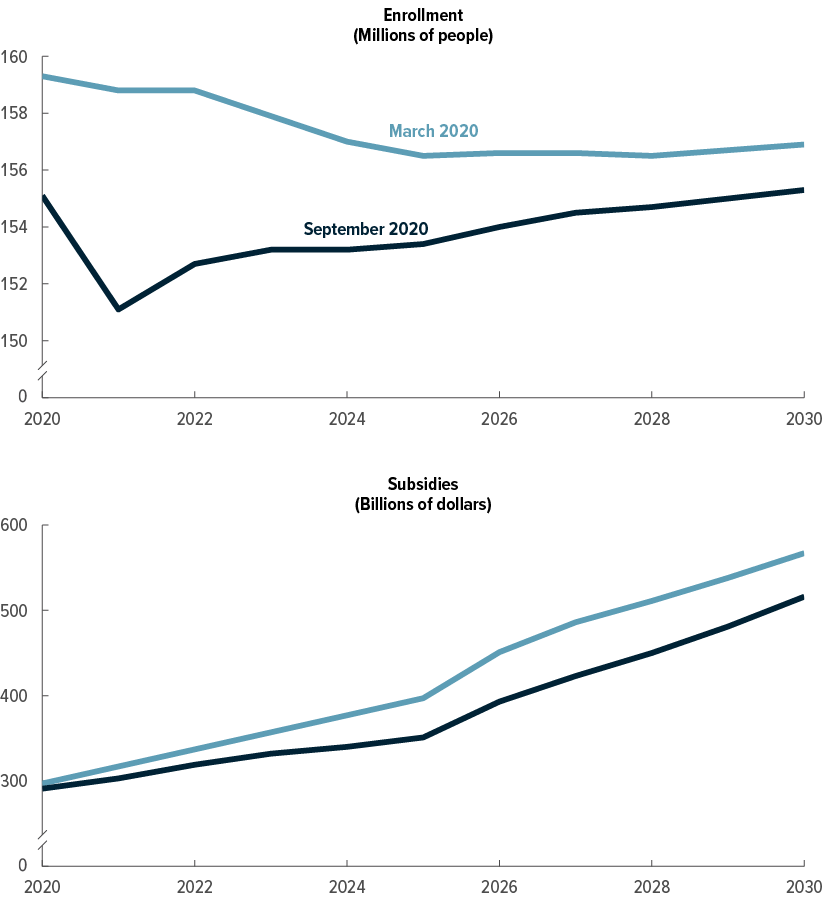
CBO and JCT now estimate lower enrollment in employment-based health insurance every year between 2020 and 2030. The decrease since March results from job losses during the coronavirus pandemic and declines in CBO’s population projections. The decreases are smaller in 2020 than in 2021 because more of the job losses in 2020 are projected to be temporary furloughs or for only part of the year.
Like the estimates of enrollment, estimates of subsidies for employment-based coverage are lower now than they were in March. Besides lower enrollment, lower anticipated premiums (reflecting a constraint imposed by people’s having less personal disposable income) also contribute to the decrease in subsidies.
Comparison of Estimates for Medicaid and CHIP

About half of the projected increase in enrollment in Medicaid and CHIP in 2021 (an additional 9 million people since the previous estimate) results from the new requirement that states allow people to remain enrolled in Medicaid longer, and half results from the economic effects of the pandemic.
Current projections of subsidies for Medicaid and CHIP are higher in the near term than previously estimated because of increases in enrollment as well as the increases in federal matching rates. After the elevated matching rates end, subsidies are projected to be slightly lower than previously estimated, as enrollment during the public health emergency begins to decline and a lower forecast for price inflation leads to slower growth in payment rates for providers.
Comparison of Estimates for Subsidized Nongroup Coverage and the Basic Health Program

Since their previous projections in March, CBO and JCT now estimate slightly higher enrollment in 2020 in plans purchased through the marketplaces and in the Basic Health Program. That upward revision is mostly owing to the loss of jobs by people who had employment-based coverage (and subsequently qualify for subsidized nongroup coverage) and to special enrollment periods established by some states to allow otherwise uninsured people to acquire coverage in the marketplaces. Lower enrollment over the next several years reflects people’s circumstances after losing their job: More are projected to sign up for Medicaid or go uninsured than enroll in nongroup coverage.
CBO and JCT have lowered their estimates of outlays for premium tax credits for nongroup coverage and for the Basic Health Program. The reduction is largely the result of a net reduction in nongroup premiums since the March estimates due to declines in personal disposable income, as projected in CBO’s economic forecast.
Changes Since March 2020 in Projections of the Number of Uninsured People
Compared with the amounts estimated in March, CBO and JCT’s current estimates of the number of uninsured people—incorporating effects of the pandemic—are about 1 million larger over the next few years. The current estimates reflect decreases in employment-based coverage resulting from job losses as well as increases in enrollment in Medicaid brought about by policy changes that extend the eligibility period for enrollees and declines in income that make more people eligible.
The estimates for 2021 show 1 million more individuals uninsured, for example. That revision is the net result of larger changes in the sources of coverage: 8 million fewer are enrolled in employment-based insurance, 9 million more are enrolled in Medicaid and CHIP, and 2 million more have multiple sources of coverage over the course of the year.
The increase in the number of people with multiple sources of coverage does not change the total number of people estimated to have coverage and explains how the number of uninsured people can increase at the same time the increase in enrollment in Medicaid and CHIP exceeds the decline in employment-based insurance. For example, some people enrolled in Medicaid at the beginning of 2021 continue to be covered by Medicaid but also obtain employment-based coverage later in the year. CBO counts multiple sources of coverage because doing so aligns better with estimates of spending and health insurance coverage as reported on household surveys and administrative data.
Comparison of Estimates of the Number of People Without Insurance
Millions of People

In CBO and JCT’s current projections, an average of about 1 million more people are uninsured each year between 2020 and 2025 than in the prior baseline projections because of the pandemic and its aftereffects. In the second half of the coming decade, economic conditions are anticipated to be more like those projected in March than what is occurring now. Relative to the March 2020 estimates for the second half of the decade, the current estimates reflect a lower overall population and lower premiums for nongroup coverage, resulting in a decrease in the number of uninsured individuals.
Appendix: Details of the Projections of Health Insurance Coverage and Federal Subsidies
The tables in this appendix show the Congressional Budget Office and the staff of the Joint Committee on Taxation’s previous and current projections of health insurance coverage and federal subsidies for health insurance for each year from 2020 to 2030. For the current projections of health insurance coverage, from September 2020, see Table A-1; for the current projections of federal subsidies for health insurance, see Table A-2. For the previous projections of health insurance coverage, from March 2020, see Table A-3; for the previous projections of federal health insurance subsidies, see Table A-4. For a comparison of the March 2020 and September 2020 projections, see Table A-5.
Table A-1.
CBO’s September 2020 Projections for Health Insurance Coverage, 2020 to 2030
Millions of People, by Calendar Year

Sources: Congressional Budget Office; staff of the Joint Committee on Taxation.
These projections reflect legislation, administrative actions, and regulatory changes through early July 2020, as well as premiums at that time. They are based on the economic forecast that CBO completed on June 26, 2020, and do not account for changes to the nation’s economic outlook and fiscal situation arising since then from the current public health emergency.
The table shows coverage for the civilian noninstitutionalized population under age 65. The components do not sum to the total population because some people report multiple sources of coverage. CBO and JCT estimate that in every year of the projection period, between 12 million and 14 million people (about 5 percent of the insured population) have multiple sources of coverage, such as employment-based coverage and Medicaid.
Estimates reflect average monthly enrollment over the course of a year and include spouses and dependents covered under family policies.
ACA = Affordable Care Act; CHIP = Children’s Health Insurance Program; JCT = Joint Committee on Taxation.
a. Includes only noninstitutionalized enrollees with full Medicaid benefits. Estimates are adjusted to account for people enrolled in more than one state.
b. Many people can purchase subsidized health insurance coverage through marketplaces established under the ACA, which are operated by the federal government, state governments, or partnerships between the federal and state governments.
c. The Basic Health Program, created under the ACA, allows states to establish a coverage program primarily for people with income between 138 percent and 200 percent of the federal poverty guidelines. To subsidize that coverage, the federal government provides states with funding equal to 95 percent of the subsidies for which those people would otherwise have been eligible through a marketplace.
d. Includes noninstitutionalized Medicare enrollees under age 65. Most Medicare-eligible people under age 65 qualify for Medicare because they participate in the Social Security Disability Insurance program.
e. Includes people with other kinds of insurance, such as student health plans, coverage provided by the Indian Health Service, or coverage from foreign sources.
f. CBO and JCT consider people uninsured if they are not covered by an insurance plan or enrolled in a government program that provides financial protection from major medical risks. See Congressional Budget Office, Health Insurance Coverage for People Under Age 65: Definitions and Estimates for 2015 to 2018 (April 2019), www.cbo.gov/publication/55094.
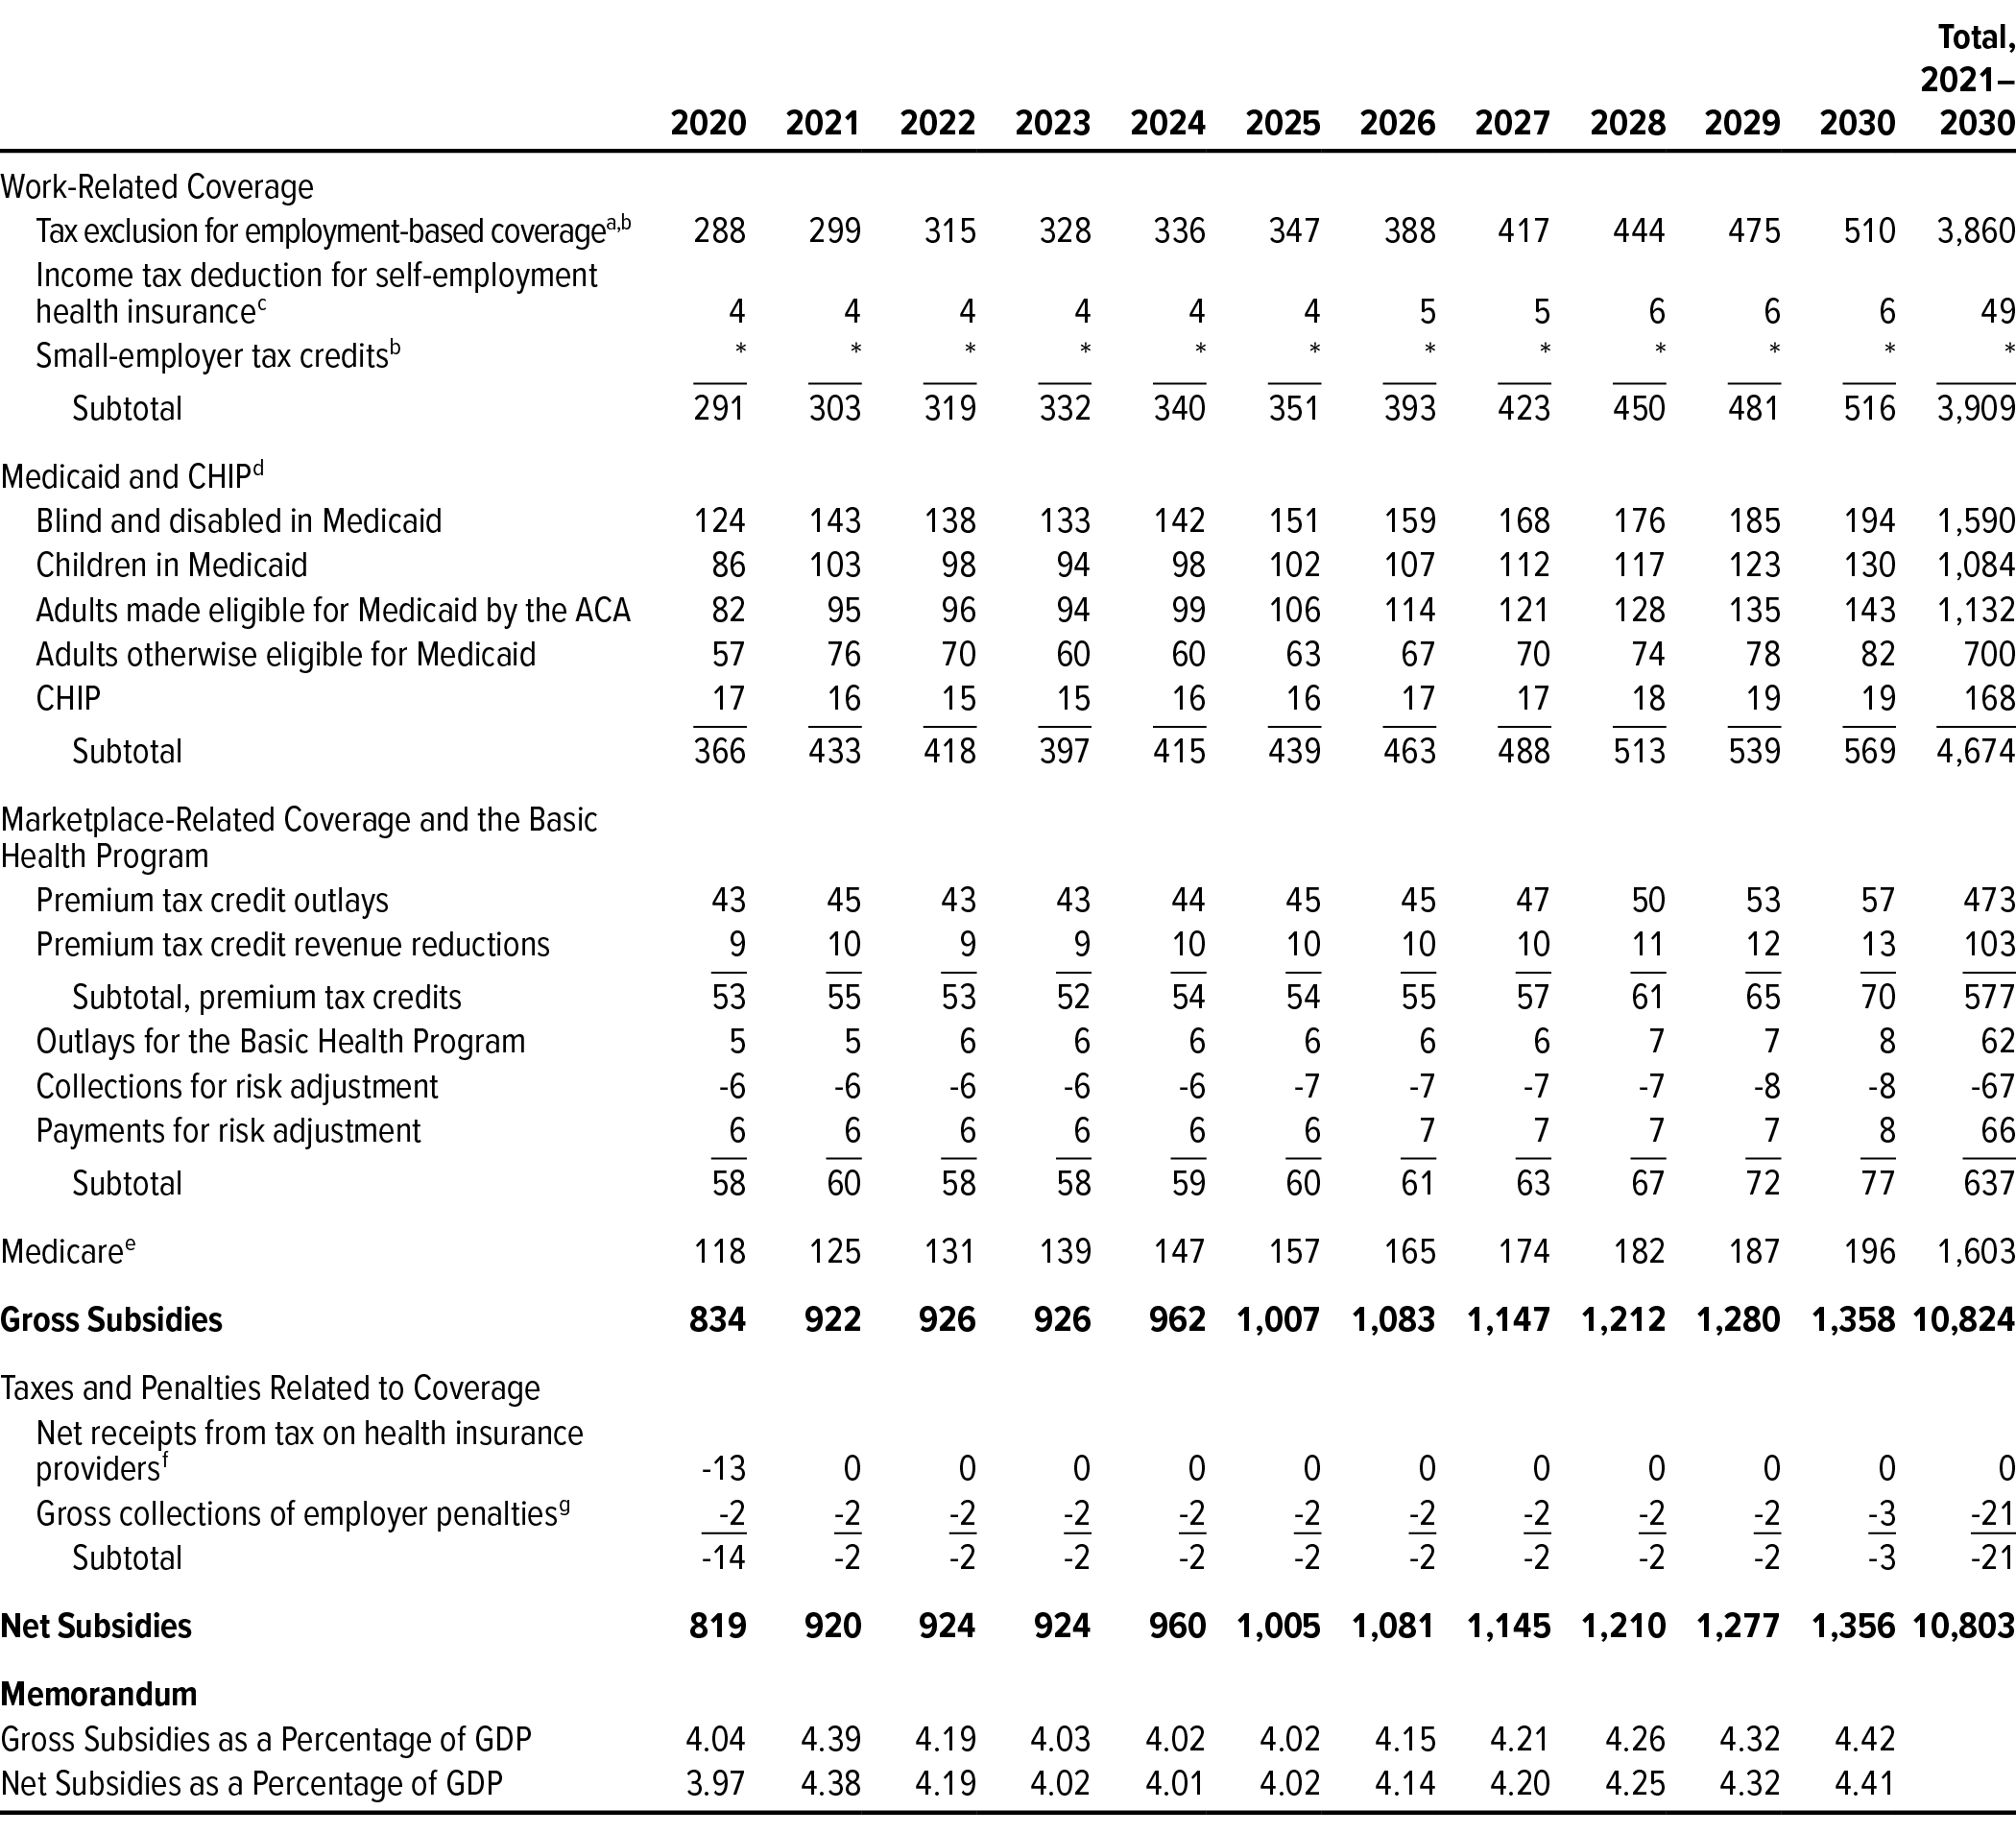
Table A-2.
CBO’s September 2020 Projections for Net Federal Subsidies for Health Insurance Coverage, 2020 to 2030
Billions of Dollars, by Fiscal Year
Sources: Congressional Budget Office; staff of the Joint Committee on Taxation.
These budget projections reflect legislation, administrative actions, and regulatory changes through early July 2020, as well as premiums at that time. They are based on the economic forecast that CBO completed on June 26, 2020, and do not account for changes to the nation’s economic outlook and fiscal situation arising since then from the current public health emergency.
The table shows subsidies for the civilian noninstitutionalized population under age 65.
Positive numbers indicate an increase in the deficit, and negative numbers indicate a decrease in the deficit.
The table excludes outlays made by the federal government in its capacity as an employer.
ACA = Affordable Care Act; CHIP = Children’s Health Insurance Program; GDP = gross domestic product; JCT = Joint Committee on Taxation; * = between zero and $500 million.
a. The estimates shown, produced by JCT, reflect the tax value of the exclusion from federal income and payroll taxes for employment-based health insurance for people under age 65, as well as the penalty payments by employers. The tax value represents the change in tax revenues if the exclusion from federal income and payroll taxes was repealed and the total compensation paid by the employer (including the employer’s payroll taxes) remained constant by increasing wages. The estimates differ from those of the tax expenditure for the exclusion. The tax expenditure represents the change in tax revenues if the amount of excluded compensation was taxed and is larger than the tax value. Neither measure reflects employees’ behavioral responses to the change.
b. Includes increases in outlays and reductions in revenues.
c. The estimates shown, which JCT produced, do not include effects stemming from the deduction for people over age 65.
d. For Medicaid, the outlays reflect only medical services for noninstitutionalized enrollees under age 65 who have full Medicaid benefits.
e. For Medicare, the outlays are for benefits net of offsetting receipts for noninstitutionalized Medicare beneficiaries under age 65. Estimates include Part D spending by the federal government for Medicare beneficiaries under 65.
f. Net receipts include effects on individual and corporate tax receipts. Health insurers are subject to the excise tax in calendar year 2020. The Further Consolidated Appropriations Act, 2020, eliminated the excise tax beginning in calendar year 2021.
g. Excludes the associated effects on revenues of changes in taxable compensation, which are included in the estimate of the tax exclusion for employment-based insurance. If those effects were included, net revenues from penalty payments by employers would total $15 billion over the 10-year period.
Table A-3.
CBO’s March 2020 Projections for Health Insurance Coverage, 2020 to 2030
Millions of People, by Calendar Year

Sources: Congressional Budget Office; staff of the Joint Committee on Taxation.
These projections reflect legislation, administrative actions, and regulatory changes through early March 2020, as well as premiums at that time. They are based on the economic forecast that CBO completed on January 7, 2020, and do not account for changes to the nation’s economic outlook and fiscal situation arising from the current public health emergency.
The table shows coverage for the civilian noninstitutionalized population under age 65. The components do not sum to the total population because some people report multiple sources of coverage. CBO and JCT estimate that in every year of the projection period, about 12 million people (or about 5 percent of insured people) have multiple sources of coverage, such as employment-based coverage and Medicaid.
Estimates reflect average monthly enrollment over the course of a year and include spouses and dependents covered under family policies.
ACA = Affordable Care Act; CHIP = Children’s Health Insurance Program; JCT = Joint Committee on Taxation.
a. Includes only noninstitutionalized enrollees with full Medicaid benefits. Estimates are adjusted to account for people enrolled in more than one state.
b. Many people can purchase subsidized health insurance coverage through marketplaces established under the ACA, which are operated by the federal government, state governments, or partnerships between the federal and state governments.
c. The Basic Health Program, created under the ACA, allows states to establish a coverage program primarily for people with income between 138 percent and 200 percent of the federal poverty guidelines. To subsidize that coverage, the federal government provides states with funding equal to 95 percent of the subsidies for which those people would otherwise have been eligible through a marketplace.
d. Includes noninstitutionalized Medicare enrollees under age 65. Most Medicare-eligible people under age 65 qualify for Medicare because they participate in the Social Security Disability Insurance program.
e. Includes people with other kinds of insurance, such as student health plans, coverage provided by the Indian Health Service, or coverage from foreign sources.
f. CBO and JCT consider people uninsured if they are not covered by an insurance plan or enrolled in a government program that provides financial protection from major medical risks. See Congressional Budget Office, Health Insurance Coverage for People Under Age 65: Definitions and Estimates for 2015 to 2018 (April 2019), www.cbo.gov/publication/55094.
Table A-4.
CBO’s March 2020 Projections for Net Federal Subsidies for Health Insurance Coverage, 2020 to 2030
Billions of Dollars, by Fiscal Year

Sources: Congressional Budget Office; staff of the Joint Committee on Taxation.
These budget projections reflect legislation, administrative actions, and regulatory changes through early March 2020, as well as premiums at that time. They are based on the economic forecast that CBO completed on January 7, 2020, and do not account for changes to the nation’s economic outlook and fiscal situation arising from the current public health emergency.
The table shows subsidies for the civilian noninstitutionalized population under age 65.
Positive numbers indicate an increase in the deficit, and negative numbers indicate a decrease in the deficit.
The table excludes outlays made by the federal government in its capacity as an employer.
ACA = Affordable Care Act; CHIP = Children’s Health Insurance Program; GDP = gross domestic product; JCT = Joint Committee on Taxation; * = between zero and $500 million.
a. The estimates shown, produced by JCT, reflect the tax value of the exclusion from federal income and payroll taxes for employment-based health insurance for people under age 65, as well as the penalty payments by employers. The tax value represents the change in tax revenues if the exclusion from federal income and payroll taxes was repealed and the total compensation paid by the employer (including the employer’s payroll taxes) remained constant by increasing wages. The estimates differ from those of the tax expenditure for the exclusion. The tax expenditure represents the change in tax revenues if the amount of excluded compensation was taxed and is larger than the tax value. Neither measure reflects employees’ behavioral responses to the change.
b. Includes increases in outlays and reductions in revenues.
c. The estimates shown, which JCT produced, do not include effects stemming from the deduction for people over age 65.
d. For Medicaid, the outlays reflect only medical services for noninstitutionalized enrollees under age 65 who have full Medicaid benefits.
e. For Medicare, the outlays are for benefits net of offsetting receipts for noninstitutionalized Medicare beneficiaries under age 65. Estimates do not include Part D spending by the federal government for Medicare beneficiaries under 65.
f. Net receipts include effects on individual and corporate tax receipts. Health insurers are subject to the excise tax in calendar year 2020. The Further Consolidated Appropriations Act, 2020, eliminated the excise tax beginning in calendar year 2021.
g. Excludes the associated effects on revenues of changes in taxable compensation, which are included in the estimate of the tax exclusion for employment-based insurance. If those effects were included, net revenues from penalty payments by employers would total $15 billion over the 10-year period.
Table A-5.
Comparison of Current and Previous Projections of Health Insurance Coverage and Net Federal Subsidies

Sources: Congressional Budget Office; staff of the Joint Committee on Taxation.
The March 2020 projections reflect legislation, administrative actions, and regulatory changes through early March 2020, as well as premiums at that time. They are based on the economic forecast that CBO completed on January 7, 2020. The September 2020 projections reflect such governmental activities through (and premiums in) early July 2020 and the economic forecast completed on June 26, 2020.
Estimates of insurance coverage apply to calendar years, and estimates of the effect on the federal deficit apply to fiscal years.
The table applies to the civilian noninstitutionalized population under age 65.
ACA = Affordable Care Act; CHIP = Children’s Health Insurance Program; JCT = Joint Committee on Taxation; * = between −500,000 and 500,000; ** = between −$500 million and $500 million.
a. The components do not sum to the total population because some people report multiple sources of coverage. CBO and JCT estimate that in every year of the projection period, between 12 million and 14 million people (or about 5 percent of insured people) have multiple sources of coverage, such as employment-based coverage and Medicaid. Estimates reflect average monthly enrollment over the course of a year and include spouses and dependents covered under family policies.
b. Includes only noninstitutionalized enrollees with full Medicaid benefits. Estimates are adjusted to account for people enrolled in more than one state.
c. The Basic Health Program, created under the ACA, allows states to establish a coverage program primarily for people with income between 138 percent and 200 percent of the federal poverty guidelines. To subsidize that coverage, the federal government provides states with funding equal to 95 percent of the subsidies for which those people would otherwise have been eligible through a marketplace.
d. Includes noninstitutionalized Medicare enrollees under age 65. Most Medicare-eligible people under age 65 qualify for Medicare because they participate in the Social Security Disability Insurance program.
e. Includes people with other kinds of insurance, such as student health plans, coverage provided by the Indian Health Service, and coverage from foreign sources.
f. Includes noncitizens not lawfully present in this country, who are ineligible either for marketplace subsidies or for most Medicaid benefits; people ineligible for Medicaid because they live in a state that has not expanded coverage; people eligible for Medicaid or CHIP who do not enroll; people who purchase nongroup insurance policies that do not meet the agencies’ definition of comprehensive health insurance; and people who do not purchase insurance available through an employer, through the marketplaces, or directly from an insurer.
g. Positive numbers indicate an increase in the deficit, and negative numbers indicate a decrease in the deficit.
h. The estimates shown, produced by JCT, reflect the tax value of the exclusion from federal income and payroll taxes for employment-based health insurance for people under age 65, as well as the penalty payments by employers. The tax value represents the change in tax revenues if the exclusion from federal income and payroll taxes was repealed and the total compensation paid by the employer (including the employer’s payroll taxes) remained constant by increasing wages. The estimates differ from those of the tax expenditure for the exclusion. The tax expenditure represents the change in tax revenues if the amount of excluded compensation was taxed and is larger than the tax value. Neither measure reflects employees’ behavioral responses to the change.
i. The estimates shown, which JCT produced, do not include effects stemming from the deduction for people over age 65.
j. For Medicaid, the outlays reflect only medical services for noninstitutionalized enrollees under age 65 who have full Medicaid benefits.
k. For Medicare, the outlays are for benefits net of offsetting receipts for noninstitutionalized beneficiaries under age 65. The September 2020 estimates include Part D spending by the federal government for Medicare beneficiaries under 65 (estimates before that time do not).
l. Excludes the associated effects on revenues of changes in taxable compensation, which are included in the estimate of the tax exclusion for employment-based insurance.
About This Document
Each year, the Congressional Budget Office issues a series of publications describing its projections of the federal budget. This report provides background information that helps explain some of the projections in the most recent of those publications and also provides updated estimates. In keeping with CBO’s mandate to provide objective, impartial analysis, the report makes no recommendations.
Kevin McNellis (formerly of CBO), Carolyn Ugolino and Emily Vreeland prepared the report. Alice Burns, Katherine Feinerman, Stuart Hammond, Caroline Hanson, Zhuang Hao, Keren Hendel (formerly of CBO), Ben Hopkins, Lori Housman, Geena Kim, Sean Lyons, Eamon Molloy, Romain Parsad, Allison Percy, Lisa Ramirez-Branum, Sarah Sajewski, Robert Stewart, Chris Zogby, and the staff of the Joint Committee on Taxation contributed to the analysis. Chad Chirico, Theresa Gullo, Leo Lex, Sarah Masi, Alexandra Minicozzi, Julie Topoleski, and Chapin White provided guidance and helpful comments. Ryan Greenfield and Rachel Matthews fact-checked the report.
Mark Hadley, Jeffrey Kling, and Robert Sunshine reviewed the report. John Skeen was the editor, and Casey Labrack was the graphics editor. The report is available on CBO’s website (www.cbo.gov/publication/56571).
CBO continually seeks feedback to make its work as useful as possible. Please send any comments to communications@cbo.gov.

Phillip L. Swagel
September 2020