
At a Glance
The Congressional Budget Office has updated its economic projections through 2021 to account for the 2020 coronavirus pandemic. CBO’s latest estimates, which are based on information about the economy that was available through May 12, update the preliminary projections that the agency made in April. In developing those projections, CBO reviewed many private-sector forecasts. Some of those forecasts include expectations that additional pandemic-related legislation will be enacted, whereas CBO’s projections incorporate the assumption that current laws generally remain unchanged and that no significant additional emergency funding is provided. This report details those projections.
- The Pandemic and Social Distancing. The pandemic has profoundly affected the lives of millions of people. To mitigate the contagion, many households, businesses, and governments have taken measures to limit in-person interactions. Collectively referred to as social distancing, those measures include reducing social activities, working from home, and closing schools and businesses. CBO estimates that social distancing peaked in April 2020 across the country. To account for the chances of the pandemic persisting or reemerging, CBO projects that social distancing will continue, but to a declining degree. The agency expects that, from that peak, social distancing will drop by roughly two-thirds during the second half of this year and diminish further, but by smaller amounts, through the third quarter of 2021. That decline is in the middle of the distribution of possible outcomes, in CBO’s assessment, and allows for regional and seasonal variation.
- The Sudden Drop in Economic Activity. The pandemic and the social distancing measures taken to contain it have widely disrupted economic activity, causing a wave of job losses and ending the longest expansion since World War II. CBO estimates that real (inflation-adjusted) gross domestic product (GDP) will contract by 11 percent in the second quarter of this year, which is equivalent to a decline of 38 percent at an annual rate. In the second quarter, the number of people employed will be almost 26 million lower than the number in the fourth quarter of 2019.
- A Resumption of Economic Activity. The economy is expected to begin recovering during the second half of 2020 as concerns about the pandemic diminish and as state and local governments ease stay-at-home orders, bans on public gatherings, and other measures. The labor market is projected to materially improve after the third quarter; hiring will rebound and job losses will drop significantly as the degree of social distancing diminishes. However, those improvements will not be large enough to make up for earlier losses. Compared with their values two years earlier, by the fourth quarter of 2021 real GDP is projected to be 1.6 percent lower, the unemployment rate 5.1 percentage points higher, and the employment-to-population ratio 4.8 percentage points lower. Inflation and interest rates on federal borrowing will remain relatively low because of subdued economic activity and weak labor market conditions through 2021.
Notes
Notes
Unless this report indicates otherwise, all years referred to are calendar years and all quarters are calendar quarters.
Numbers in the text, tables, and figures may not add up to totals because of rounding.
In most years, the Congressional Budget Office releases two economic projections, usually associated with updated baseline budget projections. Typically, those two economic projections are released in January and August. The agency’s most recent full economic forecast was released with the baseline budget projections on January 28, 2020. Because the 2020 coronavirus pandemic has substantially disrupted economic activity, CBO updated projections for the several variables that are most important for producing accurate cost estimates for recent legislation. This report updates the two-year (2020 and 2021) preliminary economic projections that were made in April (see www.cbo.gov/publication/56335 and www.cbo.gov/publication/56314).
Supplemental data for this analysis are available on CBO’s website (see www.cbo.gov/publication/56351). As part of those data, CBO projected a selected set of macroeconomic variables (including gross domestic product, the unemployment rate, various price indexes, and key interest rates) through 2030 for use in estimating the budgetary effects of proposed legislation. Later this year, CBO will publish a comprehensive economic forecast through 2030. The supplemental material accompanying that forecast will include the set of variables CBO usually publishes, including estimates of potential output and the natural rate of unemployment. CBO’s most recent versions of those series were published in January; see www.cbo.gov/publication/51135.
Also available on CBO’s website are a glossary of common budgetary and economic terms (see www.cbo.gov/publication/42904) and a description of how CBO prepares its economic forecast (see www.cbo.gov/publication/53537).
Visual Summary
The Congressional Budget Office has updated its economic projections through the end of 2021 to account for the 2020 coronavirus pandemic. This report details those projections.
The Sudden Drop in Economic Activity
The pandemic has disrupted the lives of millions of people. To mitigate the contagion, many households, businesses, and governments have taken measures collectively referred to as social distancing, which peaked in April 2020. The pandemic and social distancing have widely disrupted economic activity, causing a wave of job losses and ending the longest expansion since World War II.
The Unemployment Rate
Percent
Between February and April of this year, the number of people employed fell by more than 25 million and the size of the labor force by more than 8 million. In CBO’s projections, the unemployment rate is 15.8 percent in the third quarter of this year. After that, labor market conditions gradually stabilize and begin to improve more materially.
See Figure 3
A Resumption of Economic Activity
The economy is expected to begin recovering during the second half of 2020 as concerns about the pandemic diminish and as state and local governments ease restrictions. The labor market is projected to materially improve after the third quarter—hiring will rebound and furloughs will drop significantly as the degree of social distancing diminishes. To account for the chances of the pandemic persisting or reemerging, CBO projects that social distancing will continue, but to a declining degree. The persistence of social distancing will keep economic activity and labor market conditions suppressed for some time.
Real Output Measured as the Difference From the Fourth Quarter of 2019
Percent
Although economic conditions are projected to improve following their sudden drop, real output is expected to be 1.6 percent lower in the fourth quarter of 2021 than it was in the fourth quarter of last year . . .
See Figure 2
Interest Rates
Percent
. . . and interest rates are expected to remain low because of subdued economic activity, weak labor market conditions, actions taken by the Federal Reserve, and an increase in investors’ demand for low-risk assets.
See Figure 5
The Pandemic and Current Economic Conditions
The 2020 coronavirus pandemic has profoundly affected people in the United States and around the world. Many households, businesses, and governments have implemented social distancing measures—such as working from home, closing schools and businesses, and limiting social gatherings—to slow the spread of COVID-19, the disease caused by the coronavirus.
Since the beginning of March of this year, the number of reported cases of and deaths from COVID-19 in the United States has risen rapidly. The measures taken to impede the transmission of the virus have caused many businesses, especially those in the service sector, to curtail operations or to close altogether. Those measures have adversely affected manufacturing as well, by disrupting supply chains and decreasing demand for goods. The pandemic-related disruptions to economic activity have ended the longest expansion since World War II and have precipitated an acute deterioration in labor market conditions.1 In response, policymakers have taken many actions to support the economy.
The Labor Market
The pandemic and associated social distancing measures have led to a collapse in consumer spending and caused many businesses to reduce or cease operations and to lay off or furlough their employees. Between the third week of March and the first week of May, more than 30 million unemployment insurance claims were filed. The unemployment rate surged from 3.5 percent in February to 14.7 percent in April.2 That change reflects the net effect of a decline of more than 25 million in the number of people employed and a reduction of more than 8 million in the size of the labor force.
The effects of the pandemic and economic shocks have not been uniform across industries, regions, or businesses of varying sizes. During March and April, more than 20 million nonfarm payroll jobs were lost; those losses were concentrated in industries that rely on a high degree of in-person interactions, such as leisure and hospitality, retail trade, and education and health services.3 The leisure and hospitality sector was hit particularly hard, losing 8 million of its 17 million jobs in March and April (see Figure 1). In addition, many local economies that rely heavily on the tourism and hospitality industries have sustained great employment losses. More broadly, the impact of the pandemic has varied greatly across regions, and some states have been hit harder than others. Across all industries and all regions, though, businesses that are small and young are expected to suffer a greater share of job losses than are larger and more mature businesses, because smaller and newer businesses are less likely to have the financial resources to withstand the shocks.
Figure 1.
Job Losses by Industry During March and April 2020
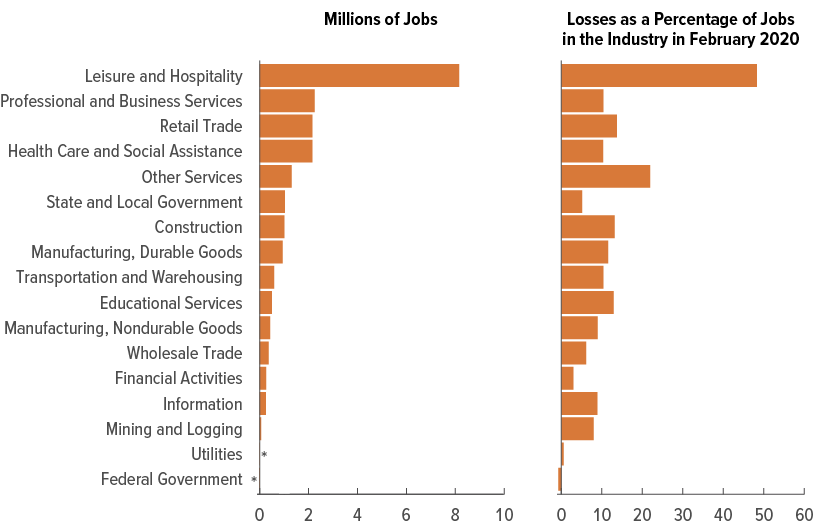
The more than 20 million nonfarm payroll jobs lost during March and April were concentrated in industries that rely on a high degree of in-person interactions, including leisure and hospitality, retail trade, and educational services. The leisure and hospitality industry was hit particularly hard, losing more than 8 million of its 17 million jobs.
Sources: Congressional Budget Office; Bureau of Labor Statistics.
* = between -0.05 million and 0.05 million.
The suffering inflicted by the pandemic and economic shocks has also varied significantly among workers. Low-wage workers and low-income families have borne the brunt of the economic crisis, in part because the industries hardest hit by the pandemic and social distancing measures disproportionately employ low-wage workers. Furthermore, workers who are younger, female, have less education, and are from certain racial or ethnic groups have seen disproportionately large job losses. Although employment between February and April declined by 16 percent overall, it decreased by 31 percent for people ages 16 to 24, by 18 percent for women regardless of age, by 19 percent for people age 25 or older without a bachelor’s degree, and by 21 percent for Hispanic workers regardless of age. Among black workers, employment declined by 18 percent. Also, black and Hispanic people constitute a disproportionate share of workers in certain industries in which many jobs involve elevated risks of exposure to COVID-19.4
Gross Domestic Product
Real (inflation-adjusted) consumer spending—which accounts for about two-thirds of gross domestic product (GDP)—plunged 7.3 percent in March as a result of reduced demand for goods and services and businesses’ limiting operations or closing. That average measure for March as a whole understates the extent of the decline in spending from the pandemic and social distancing measures because activity was disrupted mostly during the later part of the month. Most states ordered businesses to close and people to stay home during the last two weeks of March, which greatly curtailed consumer spending. Using daily data on household transactions, the Bureau of Economic Analysis (BEA) estimates that, over the period from March 21 to March 31, when many social distancing measures were in place, spending may have been down by almost 28 percent as a result of the pandemic; spending on accommodations and restaurants declined by 60 percent to 80 percent; and spending for some goods (such as clothing) dropped by similar amounts.5 However, people spent additional money earlier in the month stockpiling items, such as groceries and cleaning supplies, in anticipation of those social distancing measures.
The decline in economic activity has been so rapid and so recent that the depth of the downturn is still uncertain, and the data on spending are preliminary and incomplete. The significant drop in consumer spending in March was the primary reason for the contraction in real GDP in the first quarter. The Congressional Budget Office estimates that real consumer spending declined further in April, when social distancing measures reached their peak and constrained consumer activity the most; compared with spending in February, spending in April was down by more than 17 percent.6
The available evidence also implies a sharp decline in investment in the second quarter.
- In the week ending May 8, the number of active rigs drilling for oil and gas in the United States was 54 percent below its average in the fourth quarter of 2019.
- The architectural billings index, a leading indicator of construction activity, fell at a record pace in March.
- Construction employment decreased by nearly 13 percent in April.
- Sales of cars and light trucks, about half of which are made to businesses and constitute a significant portion of investment in equipment, fell by 49 percent in April from their average in the fourth quarter of 2019.
- Mortgage purchase applications, a measure of the demand for new and existing homes, were 30 percent lower in April than they were a year earlier.
Recent data also suggest a rapid decline in flows of exports and imports since the end of February. Trade in travel services (a category that includes air travel and hotel accommodations) has been greatly reduced by the pandemic. As a result of widespread restrictions on international travel, exports and imports of travel services shrank by 45 percent and 64 percent, respectively, during March. Exports and imports of goods also contracted. Exports of motor vehicles and parts declined by 18 percent in March, and exports of petroleum products fell by 13 percent. Imports of consumer goods (excluding food and automotive goods) and motor vehicles and parts were particularly weak in March, falling by 8 percent. The contractions resulted in part from business closures and slowdowns caused by health concerns and from a decline in demand for goods in the United States and in the countries that are its largest trading partners, including Canada, Mexico, China, Japan, and the countries of the euro zone. Supply chain disruptions impeded trade flows as well.
Legislative and Other Actions
So far this year, policymakers have taken various actions in response to the pandemic. Stay-at-home orders, bans on public gatherings, travel restrictions, and other measures were put in place to protect public health, and a number of legislative actions, administrative actions (including delayed tax-filing deadlines), and actions taken by the Federal Reserve were carried out to address the rapid deterioration in economic and labor market conditions. In March and April, four laws were enacted to address the public health emergency and to directly assist households, businesses, and state and local governments affected by the economic downturn.
- In combination, the Coronavirus Preparedness and Response Supplemental Appropriations Act (Public Law 116-123), enacted on March 6, and the Families First Coronavirus Response Act (P.L. 116-127), enacted on March 18, increased federal funding for some federal agencies and for state and local governments, required paid sick leave for employees, and provided payments and tax credits to employers.7
- The Coronavirus Aid, Relief, and Economic Security (CARES) Act (P.L. 116-136), enacted on March 27, provided business loans and payments to health care providers.8 Among other provisions, it also increased payments and tax credits to individuals, provided additional funding for state and local governments, and reduced certain business taxes.
- The Paycheck Protection Program and Health Care Enhancement Act (P.L. 116-139), enacted on April 24, increased federal funding for the business loans and payments to health care providers supplied in the CARES Act.9
Those laws resulted in a rapid and substantial increase in outlays; federal spending in April 2020 doubled relative to spending in April 2019. Over that period, the largest changes in outlays stemmed from greater payments for refundable tax credits and increases in spending for Medicare, the Coronavirus Relief Fund, unemployment compensation, and the Provider Relief Fund. Hundreds of billions of dollars have also been provided through the Paycheck Protection Program (PPP); CBO expects a large portion of those loans to be forgiven, effectively making them into grants.
In total, the four pandemic-related laws enacted since the beginning of March are projected to increase the federal deficit by $2.2 trillion in fiscal year 2020 and by $0.6 trillion in fiscal year 2021. Those amounts total about 11 percent of nominal GDP in fiscal year 2020 and 3 percent in fiscal year 2021.
The Federal Reserve has also taken an extraordinary array of steps to support the economy. It lowered its target range for the federal funds rate—the interest rate that financial institutions charge each other for overnight loans of their monetary reserves—to near zero, established several facilities similar to those created during the 2007–2009 financial crisis to support certain financial markets (such as those for securitized lending), and purchased large quantities of Treasury and mortgage-backed securities. The Federal Reserve established a number of new facilities that are partially funded by the Treasury under the CARES Act to increase the flow of credit to businesses and to state and local governments. The Federal Reserve also made temporary adjustments to regulations to allow banks to expand their balance sheets to support their household and business customers.
Effects of Recent Legislation
CBO’s current-law projections incorporate the economic effects of the laws enacted in March and April in response to the pandemic. In CBO’s assessment, that legislation will partially mitigate the deterioration in economic conditions. In particular, greater federal spending and lower revenues will cause real GDP and employment to be higher over the next few years than they would be otherwise. The effects of the legislation on economic activity will be largest in the second and third quarters of 2020 and smaller thereafter, CBO projects.
The recent legislation will affect the economy through several channels. For example, the payments and tax credits issued to individuals will boost the overall demand for goods and services by providing resources when many households are experiencing a significant loss in income. In addition, federal assistance for state and local governments will help pay for rising expenditures related to the pandemic as state and local tax revenues fall. Loans and grants will provide liquidity to businesses experiencing financial distress because of social distancing and the sudden drop in economic activity, increasing the likelihood they will survive and preserve jobs for their employees until activity picks back up. And payments to health care providers will help support further testing and treatment of COVID-19.
The boost in overall economic activity from the recent legislation will be tempered by social distancing, in CBO’s assessment, especially during the second and third quarters of this year. Continued business closures and the reduction in hours worked mean that the supply of certain goods and services will remain suppressed. At the same time, as people limit their social interactions, household and business demand for many goods and services will be subdued. Therefore, CBO estimates that as long as some degree of social distancing remains in place, the economic boost that might be expected from recent legislation will be smaller than it would be during a period of economic weakness without social distancing. CBO expects that some of the spending by individuals and businesses that is hampered by social distancing will be recovered in the future as stay-at-home orders and other interventions start to ease.
Economic Projections for 2020 and 2021
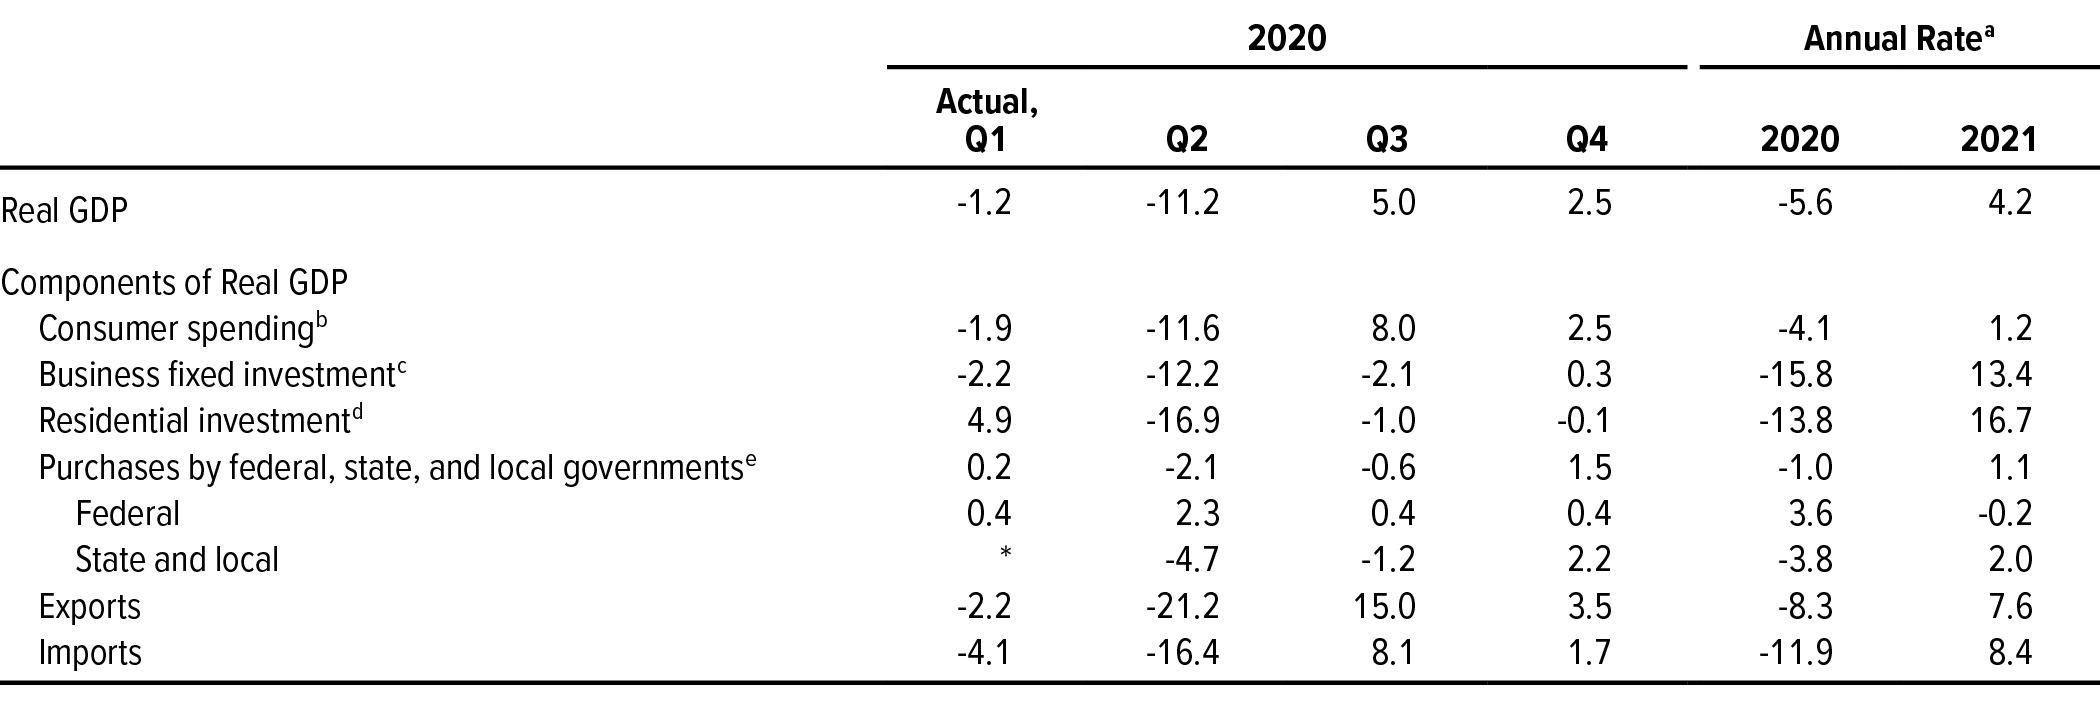
Over the 2020–2021 period, economic activity is projected to fall by the greatest amount in the second quarter of 2020, because of the pandemic and the social distancing measures (see Table 1).10 Real GDP—or real output—is projected to pick up during the second half of the year, and labor market conditions are expected to materially improve after the third quarter as concerns about the pandemic diminish and as state and local governments ease stay-at-home orders, bans on public gatherings, and other measures. The recently enacted laws will contribute to the moderate rebound in economic activity by boosting consumer spending and by preserving some connections between workers and employers so that firms can ramp up operations more quickly as the degree of social distancing subsides. Nonetheless, challenges in the economy and in the labor market are expected to persist.
Table 1.
CBO’s Economic Projections for 2020 and 2021
Percent

Sources: Congressional Budget Office; Bureau of Economic Analysis; Bureau of Labor Statistics; Federal Reserve.
GDP = gross domestic product; PCE = personal consumption expenditures; n.a. = not applicable.
a. For growth of real GDP, growth of nominal GDP, and inflation, annual rates are measured from the fourth quarter of one calendar year to the fourth quarter of the next. For the unemployment rate and interest rates, annual rates are annual averages.
b. Real values are nominal values that have been adjusted to remove the effects of changes in prices.
c. The value for the fourth quarter of 2021 is 8.6 percent.
Despite a marked improvement in economic activity by the fourth quarter of 2021, real GDP and employment are expected to be lower than they were in the fourth quarter of 2019 if current laws governing federal taxes and spending generally remain in place (see Figure 2). Partly because of that gradual and incomplete pattern of recovery, interest rates on federal borrowing are expected to remain quite low in relation to rates in recent decades and inflation is projected to stay below the Federal Reserve’s long-run objective in both 2020 and 2021. The pattern of the recovery is informed by CBO’s projections of social distancing, of the speed of the past three economic expansions (which were relatively slow in comparison with other expansions since World War II), and of the timing of the effects of recent legislative actions.
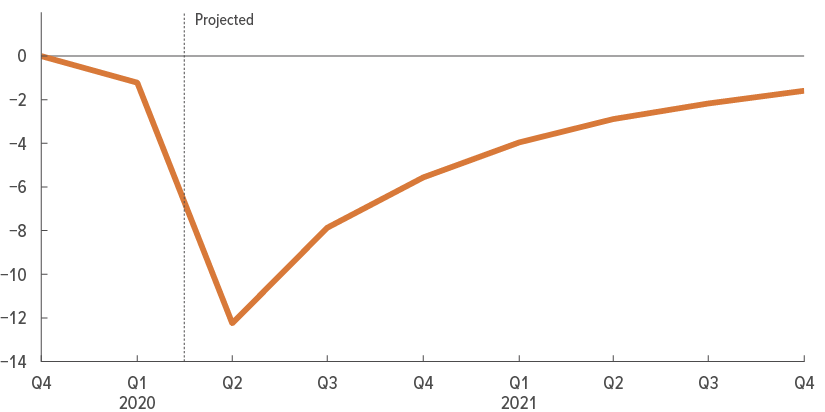
Figure 2.
Output and Employment Measured as the Difference From the Fourth Quarter of 2019

The coronavirus pandemic and the social distancing measures implemented to contain it have adversely affected both the overall demand and overall supply of goods and services in the economy, causing output to plunge. Although economic conditions improve markedly by the fourth quarter of 2021 in CBO’s projections, inflation-adjusted output remains 1.6 percent lower than it was in the fourth quarter of 2019.
As a result of the mass layoffs and furloughs prompted by businesses’ reducing their operations or closing, 25.6 million fewer people, on average, are projected to be employed in the second quarter of 2020 than were employed in the fourth quarter of 2019, reflecting an increase of 17.8 million in unemployment and a reduction of 7.8 million in the size of the labor force.
Sources: Congressional Budget Office; Bureau of Economic Analysis; Bureau of Labor Statistics.
Real values are nominal values that have been adjusted to remove the effects of changes in prices.
The unemployment effect is the number of unemployed people (jobless people who are available for work and are either seeking work or expecting to be recalled from a temporary layoff) in the fourth quarter of 2019 minus the number of unemployed people in a given quarter. The labor force effect is the size of the labor force (the number of people in the civilian noninstitutionalized population who are at least 16 years old and either working or unemployed) in a given quarter minus the number in the fourth quarter of 2019.
CBO’s social distancing projections reflect its analysis of how the pandemic is expected to unfold over the next two years and govern the extent to which certain sectors of the U.S. economy are projected to resume more regular operations. In CBO’s estimation, social distancing across the country reached its peak in April 2020. It is projected to continue to decline over time, on average and with regional and seasonal variation. Specifically, relative to its April peak, the degree of social distancing is expected to diminish by roughly two-thirds during the second half of 2020 and diminish further, but by smaller amounts, through the third quarter of 2021. Those projections account for the possibility of additional waves of increased transmission of the virus and a retightening of the associated social distancing measures.
To develop those estimates, CBO examined an array of outside projections of the pandemic by academic institutions, government agencies, and other research groups—all of which pointed to a wide range of possible outcomes. CBO used an average of potential outcomes, accounting for their likelihood, as a basis for its projection of the extent of social distancing.
Gross Domestic Product
After falling by 1.2 percent in the first quarter of 2020, real GDP is projected to contract even more sharply—by 11.2 percent—in the second quarter (see Table 2). At annual rates, those declines are equivalent to 4.8 percent and 37.7 percent, respectively. Although the drop in output is acute, it has been partially blunted by past investments in information technologies (such as computers, software, and communications equipment), which have made it possible for a significant portion of economic activity to continue remotely. Before the pandemic began, almost 30 percent of workers reported that they could work from home.11 Since the start of the pandemic, many more workers have needed to do so, often on a full-time basis. Such activity would not have been feasible before the development and deployment of those information technologies.
Table 2.
Projected Growth of Real GDP and Its Components
Percent
Sources: Congressional Budget Office; Bureau of Economic Analysis.
Real values are nominal values that have been adjusted to remove the effects of changes in prices.
GDP = gross domestic product; * = between zero and 0.05 percent.
a. Measured from the fourth quarter of one calendar year to the fourth quarter of the next.
b. Consists of personal consumption expenditures.
c. Consists of purchases of equipment, nonresidential structures, and intellectual property products.
d. Includes the construction of single-family and multifamily structures, manufactured homes, and dormitories; spending on home improvements; and brokers’ commissions and other ownership transfer costs.
e. Based on the national income and product accounts.
Economic growth is expected to pick up during the second half of 2020, averaging 15.8 percent at an annual rate during that time. Increases in consumer spending are expected to more than offset further declines in business investment during that period. In 2021, real GDP is projected to grow by 4.2 percent on a fourth-quarter-to-fourth-quarter basis.
Consumer Spending. CBO projects that consumer spending will fall by 11.6 percent in the second quarter of 2020 (or decline by 39.0 percent at an annual rate) as social distancing measures constrain and dampen spending. That projection is guided by the agency’s reading of data for late March, by its assessment that social distancing curbed consumer activity the most during April, and by its expectations about the scale and duration of social distancing thereafter.
The contraction began as households pulled back from spending in several categories—especially travel, entertainment, and services that require close personal proximity (such as hair care and dentistry). A large decline in the stock market from mid-February to mid-March also prompted some households to cut spending. Many more households probably decreased their spending as unemployment began to rise during that period, some as a direct response to the loss of jobs and income and others out of fear of possible job loss.
As restrictions on economic and social activities are gradually lifted, the main factor that is suppressing consumer spending during the second quarter will begin to abate during the latter part of 2020. Largely for that reason, CBO expects that consumer spending will rebound and grow at an average annual rate of 22.6 percent during the second half of 2020. Although less than its peak in April, some degree of social distancing is still expected to persist through that period and thus partially constrain consumer spending.
Recent legislation is also projected to provide a boost to consumer spending during the latter half of 2020. Temporary federal payments will assist households directly (by increasing their disposable income) and indirectly (by supporting businesses and their payrolls). The targeting of income support suggests that a relatively large proportion of the temporary federal payments will ultimately be spent, although some of that spending will be delayed because of continuing restraint from social distancing. In addition, increased access to unemployment benefits will support spending by people who would otherwise have had to cut back even more severely; people in low-wage occupations who lose their jobs, for example, are likely to have less savings to fall back on than other people who lose their jobs. In the fourth quarter of 2020, consumer spending will be 4.1 percent lower than it was in the fourth quarter of 2019, CBO estimates.
The pace of recovery moderates during 2021 in CBO’s projections, and consumer spending grows by 1.2 percent on a fourth-quarter-to-fourth-quarter basis. The effects of measures put in place by the federal government to support income wane, and some degree of social distancing still partially inhibits certain activities. Workers who experience lengthy spells of unemployment, significantly lower income, and uncertain prospects during 2020 will probably remain cautious for some time even after they resume work, and spending by such households will contribute little to the growth of demand in 2021. Consumer spending in the fourth quarter of 2021 is projected to be 2.9 percent lower than it was in the fourth quarter of 2019.
Business Investment. CBO expects real business fixed investment (BFI)—the purchase of new equipment, structures, and intellectual property products such as software—to decrease by 15.8 percent during 2020 as demand for the goods and services that businesses produce lessens. Restrictions on activities to prevent the spread of the coronavirus will reduce the supply of new investment available to businesses, especially in the second quarter, when real BFI is expected to decline by 12.2 percent (which is equivalent to a reduction of 40.7 percent at an annual rate). Furthermore, significantly lower oil prices will hit investment in the oil and gas industries disproportionately hard. Although investment in mining equipment and structures (the category that includes oil and gas investment) accounted for less than 5 percent of all BFI activity in late 2019, it is expected to account for about 17 percent of the decline in real BFI in 2020. CBO expects that lower outlays for equipment and structures will push real BFI down at an average annual rate of 3.7 percent in the second half of 2020. If not for actions taken by the Federal Reserve to support asset prices and to establish lending programs for businesses, the decline in business investment this year would be worse.
Although CBO expects BFI to increase by 13.4 percent in 2021, it will remain 4.5 percent lower in the fourth quarter of that year than it was two years earlier. GDP in the fourth quarter of next year also will remain lower than it was in 2019, reducing the need for additional equipment, structures, and intellectual property.
The same factors that govern BFI will determine inventory investment. In response to sharply lower demand for their products, businesses will reduce their inventories, CBO projects, subtracting nearly 1 percentage point from GDP growth in 2020. As businesses move from destocking inventories in 2020 to restocking them in 2021, inventory investment will add more than 1 percentage point to GDP growth. Nonetheless, CBO expects the stock of inventories to be lower in the fourth quarter of 2021 than it was two years earlier.
Residential Investment. Real residential investment—a category that mainly comprises new construction, remodeling, and the costs of buying and selling homes—will decline by 13.8 percent in 2020, in CBO’s estimation. As people lose their jobs, the demand for new homes will drop. All of that decline will occur in the second quarter, when CBO expects real residential investment to contract by 16.9 percent (or contract by 52.2 percent at an annual rate) after growing by 4.9 percent in the first quarter. During the second half of 2020, real residential investment will decrease at an annual rate of 2.2 percent, because the smaller number of housing starts in the second quarter will translate into less work for the rest of the year. As the economy bounces back in 2021, however, real residential investment will rise by 16.7 percent, aided by low mortgage rates. The amount of new construction is expected to be 1 percent stronger in the fourth quarter of 2021 than it was in the fourth quarter of 2019.
Government Purchases. If current laws governing federal taxes and spending generally remain in place, real purchases of goods and services—such as public education services, highways, and military equipment—by federal, state, and local governments will decline by 2.1 percent (or decline by 8.0 percent at an annual rate) in the second quarter of 2020. Thereafter, those purchases are projected to increase at an average annual rate of 1.8 percent during the latter half of 2020 and then by 1.1 percent in 2021 on a fourth-quarter-to-fourth-quarter basis. In the fourth quarter of 2021, the amount of real government purchases is projected to be about the same as it was two years earlier.
All of the projected decline in real government purchases in the second quarter of 2020 can be attributed to the drop in real purchases by state and local governments, which is only partially offset by an increase in real federal spending on goods and services stemming from pandemic-related legislation. State and local governments are projected to significantly cut their spending on real purchases during the second and third quarters of 2020 as a result of school closures and a deteriorating fiscal outlook. As the economy begins to recover and as reduced social distancing allows some schools to reopen, real state and local spending will pick up after the third quarter of 2020; nonetheless, by the fourth quarter of 2021 it will remain 1.8 percent below the amount recorded in the fourth quarter of 2019.
Net Exports. After declining in the first quarter of 2020, U.S. export and import flows are projected to drop even more substantially in the second quarter as social distancing disrupts supply chains (limiting production capacity) and as declines in household and business income in the United States and abroad reduce overall demand for traded goods and services.12 The reduction in exports is expected to exceed the reduction in imports, implying a slightly larger U.S. trade deficit (the difference between the value of U.S. imports and the value of U.S. exports) than in the first quarter of the year. In the second half of 2020 and beyond, exports and imports are expected to rebound as the economic effects of the pandemic wane. However, exports are projected to rise more quickly than imports, leading to a decrease in the U.S. trade deficit over those quarters. The rebound in exports is expected to be stronger than the rebound in imports primarily because of the slow recovery of U.S. domestic demand relative to demand in major U.S. trading partners.13
Export Flows. After falling by 21.2 percent in the second quarter of 2020 (or decreasing by 61.4 percent at an annual rate), U.S. exports of real goods and services are projected to grow at an average annual rate of 41.7 percent in the second half of 2020 and by 7.6 percent in 2021. By the fourth quarter of 2021, CBO projects, real exports will be 1.2 percent lower than their value in the fourth quarter of 2019. CBO’s projection of U.S. exports is closely tied to its projection of economic activity abroad. Among major U.S. trading partners, real output is expected to have declined by nearly 11 percent between the fourth quarter of 2019 and the second quarter of this year.14 That contraction in foreign production reduces foreign income and, in turn, lowers demand for certain goods and services produced by U.S. exporters. Factors contributing to the partial rebound in export growth include stronger economic growth among major U.S. trading partners, the loosening of supply constraints (both in the United States and abroad), and a weaker dollar (discussed below).
Import Flows. CBO expects real imports to decline in the second quarter of 2020 before partially recovering over the next year and a half. U.S. imports of real goods and services are projected to decline by 16.4 percent in the second quarter of this year (or drop by 51.2 percent at an annual rate). Categories of imports that are expected to see the largest declines include travel services, energy products, and motor vehicles and parts. Going forward, U.S. imports of real goods and services are projected to grow at an average annual rate of 20.9 percent in the second half of 2020 and by 8.4 percent in 2021. By the fourth quarter of 2021, real imports will be 4.4 percent lower than their value in the fourth quarter of 2019, in CBO’s estimation. The pickup in imports will be largely driven by the partial rebound in domestic demand for goods and services, as well as the expected improvement in foreign supply chains.
Value of the Dollar. Changes in the international exchange value of the dollar contribute to CBO’s projections of U.S. exports and imports.15 A stronger dollar reduces the competitiveness of U.S. exports in foreign markets and makes imported goods and services less costly for U.S. consumers and businesses. After appreciating by 1.5 percent in the first quarter of this year, the dollar is expected to continue to rise by an additional 3.6 percent in the second quarter as foreign demand for dollar funding and safe dollar-denominated assets rises. As the effects of the pandemic wane, CBO expects the dollar’s value to decline. Between the second quarter of 2020 and the fourth quarter of 2021, CBO projects, the export-weighted value of the dollar will decrease by 11.4 percent.
The Labor Market
During the second quarter of 2020, the labor market is projected to see the steepest deterioration since the 1930s. The unemployment rate is expected to average 15 percent, up from less than 4 percent in the fourth quarter of 2019. That surge reflects projected reductions of almost 26 million in employment and about 8 million in the size of the labor force (see Table 3).
Table 3.
CBO’s Projections of the Current Labor Market Decline
Sources: Congressional Budget Office; Bureau of Labor Statistics.
a. The periods shown here begin at the onset of a recession and end when unemployment peaked. Although there have been four recessions since 1981, labor market conditions deteriorated significantly during these two periods, making them the most comparable to the current crisis.
b. Estimate of the number of jobs from a monthly survey of businesses conducted by the Bureau of Labor Statistics.
c. Estimate of the number of employed people from a monthly survey of households conducted by the Census Bureau for the Bureau of Labor Statistics.
d. The number of jobless people who are available for work and are either seeking work or expecting to be recalled from a temporary layoff.
e. The number of people age 16 or older in the civilian noninstitutionalized population who have jobs or who are unemployed.
f. Excludes members of the armed forces on active duty or people in penal or mental institutions or in homes for the elderly or infirm.
g. Calculated as household employment divided by the civilian noninstitutionalized population age 16 or older. Changes are shown in percentage points.
h. Calculated as unemployment divided by the labor force. Changes are shown in percentage points.
i. Calculated as the labor force divided by the civilian noninstitutionalized population age 16 or older. Changes are shown in percentage points.
Labor market conditions are projected to gradually stabilize in the coming months and begin to improve more materially after the third quarter of this year. Business activity will recover as the degree of social distancing diminishes, leading to an increase in the demand for workers. Although less than at its peak in April, some degree of social distancing is still expected to persist through the third quarter of 2021, partially constraining business activity and the demand for workers. In addition, the expected pace of labor market recovery is dampened by the prospect that many businesses may not survive the earlier, extended period of revenue loss. In CBO’s projections, the unemployment rate declines after the third quarter and reaches 8.6 percent by the fourth quarter of 2021, which is about 5 percentage points higher than it was in the fourth quarter of 2019. Additionally, about 3 million fewer people are projected to be in the labor force by the fourth quarter of next year.
The sharp downturn in economic activity and the rapid deterioration in labor market conditions are expected to have severe negative effects—both immediately and potentially over the long term—on many workers, households, and communities. The job losses have been concentrated in service-providing industries with low average earnings, so low-income households may lose a large fraction of their labor income in the near term. (As a whole, those households had experienced accelerated economic gains in recent years.) Moreover, both the reduction in the number of people employed in 2020 and the persistence of high unemployment through 2021 may have a negative effect on the job prospects and earnings of younger generations that will be felt long into the future. For example, college graduates and others who enter the labor market now are expected to have substantially lower earnings initially than those who entered when economic conditions were stronger. Some of those effects will continue for years.
Particular provisions in recent legislation are expected to provide partial and temporary support for businesses and workers facing financial challenges. For instance, the Paycheck Protection Program provided forgivable loans to millions of small businesses and other eligible entities to help them keep or rehire workers for eight weeks in the second quarter of 2020. And an extra $600 per week in unemployment insurance (UI) benefits is expected to support tens of millions of workers for four months during the second and third quarters of this year.
To estimate the effects of the pandemic, social distancing measures, and recent legislation on the labor market, CBO separately assessed the impact of recent shocks and government responses on different industries and on firms of different sizes. The agency’s overall assessment and projections for the labor market over the next two years are outlined below.
Employment. As the economy emerges from the shocks that occurred in March and April, job losses will probably taper in coming months. Businesses that received loans from the PPP are expected to recall or rehire workers who have been furloughed or laid off, spurring an uptick in hiring and slowing job losses. In the second quarter of 2020, nonfarm payroll employment (which measures the number of nonfarm jobs) is projected to average 129 million, which is 15 percent fewer jobs than in the fourth quarter of 2019. Compared with figures before the pandemic began, employment is projected to be down by more than 40 percent in the leisure and hospitality sector and by more than 10 percent in the retail trade, education, transportation, and construction sectors.
Household employment (which measures the number of employed people) is expected to average 133 million in the second quarter of 2020, which is almost 26 million fewer than in the fourth quarter of 2019. The employment-to-population ratio among people age 16 or older is expected to average 51.1 percent in the second quarter, a loss of almost 10 percentage points from the ratio before the pandemic began.
Employment is expected to remain low in the third quarter of 2020. Even though CBO expects that social distancing measures will ease and that consumer demand will rebound after the second quarter, several factors are expected to weigh on employment in the third quarter. First, the payroll support that many small businesses and other entities received from the PPP will wane in the coming weeks or months, which may precipitate a new wave of layoffs and furloughs from businesses continuing to experience weak demand and lower revenues. Second, health risks from the coronavirus, combined with larger unemployment benefits (which, under current law, extend into the third quarter), are expected to dampen workers’ incentives to search for a job. Third, a notable drop in state and local government tax revenues is expected to lead to more layoffs in the state and local government sector. (State and local governments together cut about 1 million jobs in March and April, on net.) For those reasons, nonfarm payroll employment is projected to be only slightly higher in the third quarter of 2020 than it is in the second quarter under current law, averaging 130 million; household employment is projected to average 134 million.
In CBO’s current projections, the labor market improves more materially after the third quarter. Business activity and the demand for workers will increase as the degree of social distancing diminishes further. As a result, payroll employment is projected to recover about 30 percent of its loss by the fourth quarter of 2020. That quick, albeit partial, rebound is possible because a large fraction of the layoffs so far appear to be temporary, which would allow businesses to recall furloughed employees and resume operations relatively quickly.
Despite the initial rebound in employment, health risks are expected to linger and some degree of social distancing is projected to remain in place into next year. In addition, the expected pace of labor market recovery will be dampened by the prospect that many businesses may not recover from the revenue loss they experienced in 2020. In CBO’s current projections, growth in nonfarm payroll employment averages about 600,000 per month in 2021. By the fourth quarter of that year, household employment is projected to recover to 148 million, which would still be 7 percent lower than it was in the fourth quarter of 2019. Although the employment-to-population ratio rises to 56.2 percent, it will still be about 5 percentage points below its prepandemic rate.
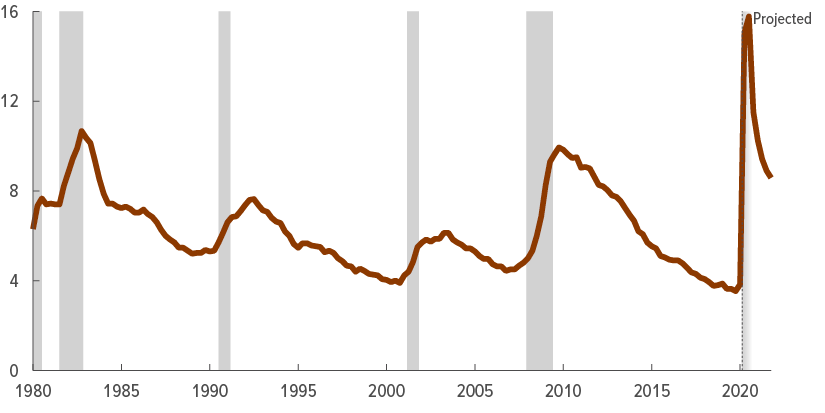
Unemployment. In April, the unemployment rate surged to 14.7 percent, the highest rate in the history of the monthly data series (which goes back to January 1948). In CBO’s projections, the unemployment rate averages 15 percent in the second quarter of this year and rises to 16 percent in the third quarter as the PPP expires under current law, labor demand remains low, and labor force participation rebounds (see Figure 3). The unemployment rate is projected to decline after the third quarter, reaching 8.6 percent in the fourth quarter of 2021. That rate, although roughly half of its projected peak, would still be more than twice what it was in the fourth quarter of 2019, before the pandemic began.
Figure 3.
The Unemployment Rate
Percent
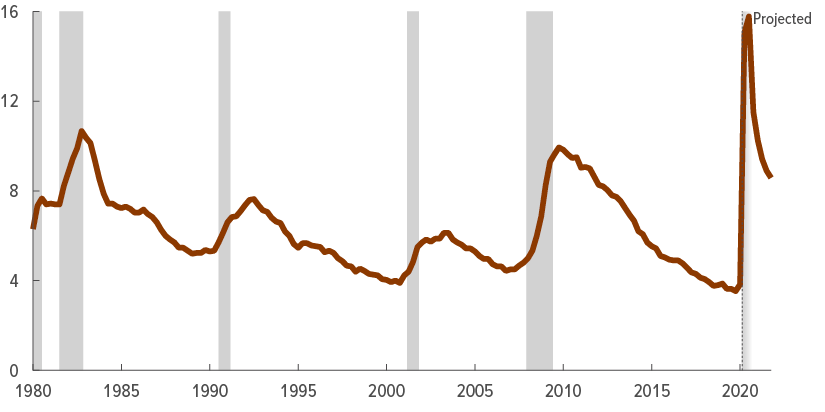
In April, the unemployment rate surged to 14.7 percent. In CBO’s projections, that rate rises further in the coming months and is 15.8 percent in the third quarter because of the expiration of certain provisions in current law, subdued labor demand, and a rebound in labor force participation. After the third quarter, the unemployment rate declines, but it remains elevated through 2021.
Sources: Congressional Budget Office; Bureau of Labor Statistics.
The unemployment rate is the number of jobless people who are available for work and are either seeking work or expecting to be recalled from a temporary layoff, expressed as a percentage of the labor force. The size of the labor force is the number of people in the civilian noninstitutionalized population who are at least 16 years old and either working or unemployed.
The shaded vertical bars indicate periods of recession, which extend from the peak of a business cycle to its trough. In CBO’s assessment, the business cycle reached a peak in the first quarter of 2020 and will probably reach a trough in the second or third quarter of 2020.
CBO’s projections of the unemployment rate reflect the agency’s assessment of the scale of job losses in the economy, as well as its estimate of the changes in the size of the labor force. The latter factor is particularly noteworthy in the current crisis because the definition of the unemployment rate is relatively narrow. To be counted as unemployed, a jobless person needs to have searched for a new job within the past four weeks or expect to be recalled to a former job within six months. In the current crisis, many factors—including the health risks from the pandemic, the severity of labor market conditions, and other disruptions such as school closures—are expected to prevent or discourage some people from searching for jobs, causing the labor force to shrink and thereby restraining the initial rise in the unemployment rate. CBO projects that the labor force participation rate will rebound more strongly than employment in the third quarter (as discussed below), causing the unemployment rate to continue to rise in that quarter.
CBO’s projections of the unemployment rate for the near term also reflect the agency’s assessment of the effects of recent legislation—in particular, the PPP and the UI expansion—on the labor market. The PPP is projected to boost payroll employment and reduce the unemployment rate in the second quarter of 2020, even though CBO expects that some of the workers retained or rehired under the program will remain largely idle because of the heightened social distancing measures and the severely reduced demand for labor. The UI expansion provides money to laid-off or furloughed workers without moving them back into employment. For many workers, an increase in unemployment benefits through the end of July boosts their weekly income above what they had been earning when working, dampening their incentive to search for a job. The PPP and UI expansion are expected to have opposite effects on certain measures of the labor market, such as the unemployment rate. The extent of social distancing in the second quarter, however, is expected to lessen both of those effects during that period.
Labor Force Participation. The labor force participation rate dropped by 3.2 percentage points since February and stood at 60.2 percent in April. That sharp fall—unprecedented since the official monthly data began in 1948—highlights the fact that, in addition to its effects on the demand for labor, the pandemic has also affected the supply of labor. The effects vary widely across different demographic groups depending on their age, existing health conditions, and occupations.
Some of the decline in the labor supply is expected to be temporary, as people who want a job but for various reasons are not searching for one during the pandemic are expected to rejoin the labor force when the health risks and social distancing restrictions diminish. But some of the decline in the labor supply is expected to persist, as some people who exited the labor force in recent months were older workers who presumably retired early. Given that COVID-19 poses a much higher risk to older people than to younger people, the labor force participation rate of the former group is expected to remain depressed as long as the pandemic continues.
In CBO’s current projections, the labor force participation rate averages 60.2 percent in the second quarter of 2020 and rebounds slightly to 61.1 percent in the third quarter as social distancing measures ease. It is projected to rebound further to 61.5 percent in 2021.
Labor Compensation. Different businesses and industries are expected to face different wage pressures. Some businesses experiencing an increase in demand for their products—such as manufacturers of certain medical equipment, foods, and cleaning products, as well as websites that offer online shopping and delivery services—will face pressure to increase their wages to compensate their employees for the health risks involved in performing their jobs. (That upward wage pressure is amplified by the UI expansion, which dampens incentives for some laid-off people to accept new jobs.) Wages in other businesses are projected to experience predominantly downward pressure as those businesses face lower demand for their products and less need for workers.
On net, the persistently high unemployment rate projected through 2021 will put downward pressure on wage growth. In CBO’s projections, the employment cost index for wages and salaries of workers in private industry is 1.3 percent higher in the fourth quarter of 2020 than it was in the fourth quarter of 2019; its annual growth rate in recent years (and before the pandemic began) had been about 3 percent. Wage growth is expected to remain weak in 2021, averaging 1.4 percent over the year, as slack in the labor market persists. The sluggish growth of labor compensation and household income will restrain consumer spending in the near term.
Inflation
The pandemic has affected consumers and businesses in various ways, many of which will affect consumer prices. Some businesses have experienced an interruption in receiving the inputs they need from domestic and foreign sources, and other businesses have shut down because of social distancing measures. Both effects have reduced the supply of certain goods and services, putting upward pressure on consumer prices.
At the same time, the pandemic has caused the demand for certain goods and services to plummet—either because consumers have been ordered to refrain from consuming them or because they have lost confidence in the safety of consuming them—putting downward pressure on consumer prices. For example, in April the consumer price index for hotel and motel lodgings fell by more than 8 percent and the consumer price index for airline fares fell by more than 15 percent; those were the largest monthly declines in the history of their respective indexes. In addition, oil prices have plunged, owing to a significant decline in global demand, and they are expected to exert substantial downward pressure on consumer energy prices over the next few months.
On net, in CBO’s projections, the effects of the pandemic on the supply of goods and services are outweighed by the effects on the demand for them, implying a significant drop in inflation over the next two years. The price index for personal consumption expenditures (PCE)—the measure that the Federal Reserve uses to define its 2 percent long-run objective for inflation—is expected to decrease by 1.2 percent (at an annual rate) in the second quarter of this year. The PCE price index is projected to grow by 0.6 percent in 2020 on a fourth-quarter-to-fourth-quarter basis (see Figure 4).
Figure 4.
Inflation
Percent

In CBO’s projections, inflation drops sharply in the second quarter of this year, in part because the price of oil has collapsed. Inflation remains below the Federal Reserve’s long-run objective through the end of 2021 because the demand for certain goods and services continues to be low.
Sources: Congressional Budget Office; Bureau of Economic Analysis; Federal Reserve.
Inflation is measured as the change from a given quarter in one calendar year to the same quarter in the next.
PCE = personal consumption expenditures.
Inflation is projected to rise but nonetheless remain below the Federal Reserve’s long-run objective through 2021. As demand for goods and services recovers and oil prices rebound from historic lows, the PCE price index is expected to grow by 1.5 percent in 2021 on a fourth-quarter-to-fourth-quarter basis.
Interest Rates
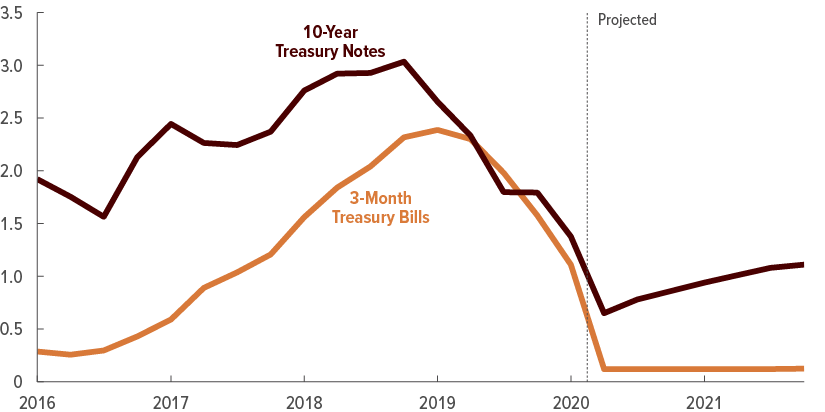
Interest rates on Treasury securities are expected to remain low through 2021, largely as a result of continued weakness in economic activity and in the labor market, actions taken by the Federal Reserve in response to that weakness, and investors’ higher demand for low-risk assets. Those factors are expected to more than offset the upward pressure on interest rates from greater federal borrowing. CBO expects that the Federal Reserve will keep the federal funds rate near zero through 2021. The interest rate on 3-month Treasury bills, which closely follows the federal funds rate, is expected to remain near zero as well (see Figure 5).
Figure 5.
Interest Rates
Percent
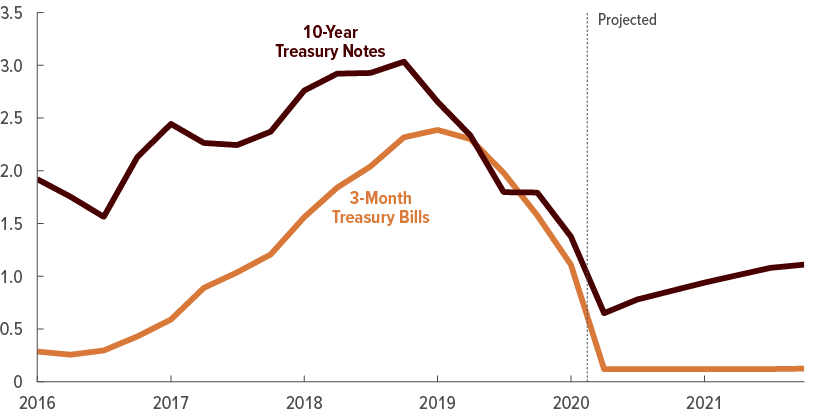
Interest rates on Treasury securities are projected to remain low through 2021 because of subdued economic activity, weak labor market conditions, actions taken by the Federal Reserve, and an increase in investors’ demand for low-risk assets.
Sources: Congressional Budget Office; Federal Reserve.
In CBO’s projections, long-term interest rates rise modestly through 2021. Those rates fell to historic lows in the first few weeks of the pandemic as a result of higher demand for long-term Treasury securities from investors and greater purchases of those securities by the Federal Reserve. As the U.S. and global economies recover, investors’ demand for risk-free Treasury securities is expected to diminish.
CBO expects that the Federal Reserve will continue purchasing long-term securities through 2021, but at a slower pace, which will put upward pressure on long-term interest rates through 2021. Additionally, long-term interest rates, which are partly determined by the average of expected future short-term interest rates, are projected to increase over the next two years in anticipation of rising short-term interest rates later in the coming decade. In CBO’s projections, the interest rate on 10-year Treasury notes rises from its current value of 0.7 percent, averaging 1.0 percent in 2021.
Some Uncertainties in CBO’s Economic Projections
An unusually high degree of uncertainty surrounds these economic projections. That heightened uncertainty stems from four major factors:
- How the pandemic will unfold this year and next year,
- How the pandemic and social distancing will affect the economy,
- How recent policy actions will affect the economy, and
- How economic data will ultimately be recorded.
Additionally, if future federal policies differ from those underlying CBO’s economic projections—for example, if lawmakers enact additional pandemic-related legislation—then economic outcomes will probably differ from those projected here.
The Course of the Pandemic
The severity and duration of the pandemic are highly uncertain. Many factors that will influence the future progress of the pandemic are unclear. Because this coronavirus is new, important epidemiological characteristics are still being studied. Among those are how easily transmissible the virus is, the extent to which the virus is transmissible before people who are infected show symptoms, the extent to which people can be infected without showing any symptoms, the extent of any immunity built up by people who have recovered from the infection, whether the virus becomes less transmissible during certain seasons, and the lethality of the illness caused by the virus.
Another source of uncertainty is how individuals and policymakers will respond to the pandemic in the coming months. The policies being implemented in the United States and around the world to mitigate the spread of the virus vary and are still evolving. Some areas have begun to lift certain social distancing measures, but they could have additional waves of outbreaks that require the reimposition of social distancing or other mitigation measures, such as widespread testing and contact tracing. Those future waves could be smaller, of a similar size, or larger than the initial wave experienced this spring. Most importantly, the time frame for the development and distribution of treatments for COVID-19 or an effective vaccine for the disease is not known.
The Pandemic and the Economy
Output, employment, inflation, interest rates, and many other macroeconomic variables will be greatly influenced by the course of the pandemic and the social distancing measures implemented to contain it. The range of uncertainty about social distancing, as well as its effects on economic activity and implications for the economic recovery over the next two years, is especially large. For example, if the disease spreads less widely than CBO expects—because of testing and contact tracing, a vaccine, or for some other reason—the degree of social distancing could be lower and the economic recovery faster than what CBO currently projects. The opposite could also be the case. In addition, the extension, reversal, or reimplementation of different types of social distancing policies (such as stay-at-home orders, bans on large public gatherings, closures of specific kinds of businesses, and closures of schools) might have different effects on the economy.
CBO’s projections of inflation are also highly uncertain given the unique combination of supply and demand factors affecting the economy. In CBO’s estimation, the downward pressure on prices stemming from decreased demand for certain goods and services will more than offset the upward pressure from the decreased supply of goods and services over the next two years. However, the decrease in businesses’ ability to supply goods and services could be much larger than the agency expects, which would result in a smaller decline (or possibly even an increase) in inflation. Conversely, weak economic activity could suppress demand for many goods and services even more than CBO expects, resulting in a more substantial decline in inflation.
Effects of Recent Fiscal and Monetary Policy Actions
Recent policy interventions by the federal government compound the uncertainty in CBO’s economic projections. Individuals, businesses, and state and local governments could respond more (or less) to the large amount of federal support being provided to the economy, resulting in faster (or slower) economic growth than CBO anticipates. The extensive support that the federal government and the Federal Reserve have provided could permit a rapid rebound in economic activity and labor market conditions as the pandemic subsides. Another factor contributing to the uncertainty is how households and businesses will respond to changes that they expect to occur in federal tax and spending policies, which is difficult to estimate.
CBO’s analysis of the economic effects of recent legislation is informed by evidence about how past legislative actions that are most comparable to the recent legislation have affected economic activity. For example, CBO’s estimates of the economic effects of payments to individuals provided under the CARES Act are informed by evidence about the effects of payments to tax filers provided by the Economic Stimulus Act of 2008 (P.L. 110-185). That evidence may be less informative than usual in this situation, however, given the novel circumstances surrounding the pandemic and the subsequent economic developments. Moreover, CBO is uncertain about how much social distancing will dampen the economic effects of recent legislation and how rapidly disrupted economic activity will recover as restrictions start to ease.
An additional area of uncertainty is how specific legislative actions will affect the economy—in particular, provisions that provide loans to businesses and reduce certain business taxes, expand eligibility for unemployment compensation and increase weekly benefits, and provide credit assistance to certain businesses and funding for state and local governments. For example, the effects of business loans on economic activity depend on the number of distressed businesses and their financial viability.
The effects of policy actions on CBO’s projections of inflation and interest rates are also uncertain, particularly in light of the rapid increase in federal borrowing in response to the pandemic. Monetary and fiscal policymakers have provided an unprecedented amount of support to the economy to curtail the adverse effects of the pandemic. That support might exert more or less pressure on inflation than CBO currently projects. In addition, the extent and timing of upward pressure on interest rates caused by greater federal borrowing, and the downward pressure from the increased demand for risk-free assets and additional purchases of long-term Treasury securities by the Federal Reserve, are unclear.
The Reporting of Data
Another source of uncertainty is how government statisticians will ultimately record economic data when their standard estimation methods and data sources cannot accommodate extreme changes. To capture the effects of the quickly deteriorating economic situation, BEA used several new approaches. To estimate GDP during the first quarter of 2020, for example, BEA used private high-frequency data on credit card transactions to measure rapid changes in consumer spending. One drawback of using new methodologies is that the resulting data are not as comparable with earlier data, making it difficult to extrapolate from historical patterns to project future outcomes.
Another concern is that sampling bias may arise if it is difficult to collect data because of social distancing protocols. For example, the Bureau of Labor Statistics (BLS) noted that the response rate among households to the Current Population Survey dropped substantially after the pandemic began. Because the households and establishments that report data may systematically differ from the ones that do not, those data might be skewed and deviate from their true underlying trends. Moreover, some respondents may misunderstand survey questions, resulting in the misclassification of some observations. The BLS reported that such misclassification probably led to the unemployment rate being understated by almost 5 percentage points in the April data.
Finally, other sources of measurement errors tend to be most acute during the onset of recessions. To adjust for measurement issues (such as sampling biases), statistical agencies routinely use models that rely on historical relationships. When the economy experiences sudden and large changes, those models tend to perform poorly, leading to large measurement errors and obscuring the underlying trends.
Comparison With Other Economic Projections
CBO’s projections of the economy for 2020 and 2021 are broadly similar to the average of about 50 private-sector economists whose forecasts were published in the May 2020 Blue Chip Economic Indicators. In particular:
- CBO’s annual projections of real GDP growth, the unemployment rate, and interest rates are within the middle two-thirds of the range of Blue Chip forecasts for 2020 and 2021.
- CBO’s annual projections of GDP price inflation and consumer price inflation (as measured by the consumer price index for all urban consumers) for 2020 and 2021 are near or within the middle two-thirds of the range of Blue Chip forecasts.
CBO’s quarterly economic projections of real GDP growth, the unemployment rate, and interest rates for 2020 are similar to their averages in the Blue Chip—except for real GDP growth and the unemployment rate in the third quarter (see Table 4). For inflation, the projections differ even more. At least part of the variation between CBO’s projections and those of other forecasters (including those in the Blue Chip) is attributable to differences in the economic data available when the forecasts were completed and to differences in the economic and statistical models used to prepare them. Moreover, the variation may reflect differences in the underlying epidemiological and social distancing projections used by CBO and other forecasters.
Table 4.
Comparison of CBO’s Economic Projections With the Blue Chip Survey
Percent

Sources: Congressional Budget Office; Wolters Kluwer, Blue Chip Economic Indicators, vol. 45, no. 5 (May 10, 2020).
GDP = gross domestic product.
a. For growth of real GDP, growth of nominal GDP, and inflation, annual rates are measured as the change in the annual average from one calendar year to the next. For the unemployment rate and interest rates, annual rates are annual averages.
b. Real values are nominal values that have been adjusted to remove the effects of changes in prices.
In addition, other forecasters may predict that additional pandemic-related legislation will be enacted, whereas CBO’s projections incorporate the assumption that current laws generally remain unchanged and that no significant additional emergency funding is provided. For example, compared with the averages in the Blue Chip forecasts, CBO projects faster economic growth but also a higher unemployment rate in the third quarter of 2020. That projection in part reflects the scheduled expiration of the Paycheck Protection Program, which CBO expects may cause many of the workers in businesses supported by that program to become unemployed during that quarter; private-sector forecasters may have made different assumptions about the features and economic effects of that program over time.
1. The end of an expansion marks the beginning of a recession. The National Bureau of Economic Research is responsible for dating the peaks and troughs of the business cycle. According to its Business Cycle Dating Committee, a recession is “a significant decline in economic activity spread across the economy, lasting more than a few months, normally visible in real (inflation-adjusted) GDP, real income, employment, industrial production, and wholesale-retail sales.” For further discussion, see National Bureau of Economic Research, Business Cycle Dating Committee, “The NBER’s Recession Dating Procedure” (January 7, 2008), www.nber.org/cycles/jan08bcdc_memo.html.
2. The unemployment rate is the number of jobless people who are available for work and either seeking work or expecting to be recalled within six months from a temporary layoff, expressed as a percentage of the labor force. The size of the labor force is the number of people age 16 or older in the civilian noninstitutionalized population who are either working or unemployed.
The Bureau of Labor Statistics (BLS), which publishes the unemployment rate and other labor statistics each month, noted that the April unemployment rate probably understated the share of unemployed workers in the labor force because many workers who should have been classified as “unemployed on temporary layoff” were probably misclassified as “employed absent from work” in the Current Population Survey. A BLS analysis of the underlying data suggests that, had that misclassification not occurred, the April unemployment rate would have been nearly 5 percentage points higher. For more details, see Bureau of Labor Statistics, “Frequently Asked Questions: The Impact of the Coronavirus (COVID-19) Pandemic on the Employment Situation for April 2020” (May 8, 2020), https://go.usa.gov/xvM73 (PDF, 300 KB).
3. Two estimates of employment are commonly used. One comes from the establishment survey of employers (the Department of Labor’s Current Employment Statistics Survey), which measures employment as the estimated number of nonfarm wage and salary jobs. (In that survey, a person with more than one job may be counted more than once.) The other estimate comes from the household survey (the Census Bureau’s Current Population Survey), which measures employment as the estimated number of people employed. (In that survey, someone with more than one job is counted only once.) The establishment survey covers only people on the payrolls of nonagricultural establishments, whereas the broader household survey includes self-employed workers, agricultural workers, unpaid workers in family-owned businesses, and employees of private households. However, the household survey is based on a smaller sample than the establishment survey is, so it yields a more volatile estimate of employment.
4. In 2019, 12 percent of workers were black and 18 percent were Hispanic. However, more than a fifth of workers in these industries were black: nursing care, residential care, bus service and urban transit, the Postal Service, couriers and messengers, and warehousing and storage. Similarly, more than a fifth of workers in these industries were Hispanic: grocery stores, warehousing and storage, waste management and remediation, and construction. For details, see Bureau of Labor Statistics, “Labor Force Statistics From the Current Population Survey” (January 22, 2020), www.bls.gov/cps/cpsaat18.htm.
5. In response to the unprecedented pace of change in the economy, BEA used newly developed research methods to inform its estimates for March. For details, see Aditya Aladangady and others, “From Transactions Data to Economic Statistics: Constructing Real-Time, High-Frequency Geographic Measures of Consumer Spending,” in Katharine Abraham and others, eds., Big Data for 21st Century Economic Statistics (University of Chicago Press, forthcoming), www.nber.org/books/abra-7. Research estimates of spending during March are reported in Abe Dunn, Kyle Hood, and Alexander Driessen, Measuring the Effects of the COVID-19 Pandemic on Consumer Spending Using Card Transaction Data, WP2020-5 (Bureau of Economic Analysis, April 24, 2020), https://go.usa.gov/xv6c6. That analysis underlies some of BEA’s advance estimates for the entire month of March.
6. To construct its estimate for April, CBO considered the detailed components of spending for each category using the decline in late March as a guide. Initial inputs to that bottom-up approach included various daily and weekly reports covering particular retail activities, assorted news reports, and analytic assessments. CBO relied on proprietary reports of the daily amount and composition of transactions conducted in late March using credit and debit cards, as well as information from BEA’s analysis of such data and estimates of consumer spending in March. In particular, CBO used estimates of the “pandemic effect,” which are based only on transactional data for late March, taken from Abe Dunn, Kyle Hood, and Alexander Driessen, Measuring the Effects of the COVID-19 Pandemic on Consumer Spending Using Card Transaction Data, WP2020-5 (Bureau of Economic Analysis, April 24, 2020), https://go.usa.gov/xv6c6.
7. See Congressional Budget Office, cost estimate for H.R. 6201, the Families First Coronavirus Response Act (April 2, 2020), www.cbo.gov/publication/56316, and cost estimate for H.R. 6074, the Coronavirus Preparedness and Response Supplemental Appropriations Act, 2020 (March 4, 2020), www.cbo.gov/publication/56227.
8. See Congressional Budget Office, cost estimate for H.R. 748, the CARES Act, Public Law 116-136 (April 16, 2020), www.cbo.gov/publication/56334.
9. See Congressional Budget Office, cost estimate for H.R. 266, the Paycheck Protection Program and Health Care Enhancement Act (April 22, 2020), www.cbo.gov/publication/56338.
10. CBO’s latest economic projections, which are based on information about the economy that was available through May 12, update the preliminary projections the agency released in April. See Congressional Budget Office, “CBO’s Current Projections of Output, Employment, and Interest Rates and a Preliminary Look at Federal Deficits for 2020 and 2021,” CBO Blog (April 24, 2020), www.cbo.gov/publication/56335, and “Updating CBO’s Economic Forecast to Account for the Pandemic,” CBO Blog (April 2, 2020), www.cbo.gov/publication/56314.
11. See Rose A. Woods, “Job Flexibilities and Work Schedules in 2017–18,” U.S. Bureau of Labor Statistics Spotlight on Statistics (April 2020), https://go.usa.gov/xvMsq (PDF, 1.34 MB).
12. Social distancing measures have led a number of U.S. exporters to suspend operations (or instead produce medical equipment for domestic use). In addition, economic disruptions in major U.S. trading partners have led to delays in producing intermediate inputs needed by some U.S. exporters. Those delays have limited the production capacity of U.S. exporters.
13. In 2021, growth of real output among major U.S. trading partners is expected to average 4.7 percent, whereas U.S. real GDP is expected to grow by 4.2 percent.
14. The severity of the economic contraction resulting from the pandemic is expected to vary across U.S. trading partners. For example, real GDP among the countries of the euro zone is expected to contract by 14 percent over the first half of 2020. In contrast, real output in China and South Korea is expected to decline by 5 percent and 4 percent, respectively, over that same period. Those differences in economic performance reflect differences in the severity of the coronavirus outbreak, speed of containment, and duration and intensity of social distancing restrictions, as well as underlying growth trends in those countries.
15. CBO’s measure of the exchange value of the dollar is an export-weighted average of the exchange rates between the dollar and the currencies of leading U.S. trading partners.
About This Document
This volume is one of a series of reports on the state of the economy that the Congressional Budget Office issues each year. In keeping with CBO’s mandate to provide objective, impartial analysis, this report makes no recommendations.
CBO consulted with members of its Panel of Economic Advisers during the development of this report. Members are Katharine Abraham, Alan Auerbach, David Autor, Olivier Blanchard, Markus Brunnermeier, Seth Carpenter, Steven Davis, Kathryn Dominguez, Karen Dynan, Robert Hall, Jan Hatzius, Donald Kohn, Nellie Liang, Gregory Mankiw, Emi Nakamura, Jonathan Parker, James Poterba, Valerie Ramey, Aysegul Sahin, James Stock, Kevin Warsh, and Mark Zandi. CBO also consulted with David Wilcox on several aspects of the projections. Although CBO’s outside advisers provided considerable assistance, they are not responsible for the contents of this report.
John Seliski wrote the report, and Jeffrey Schafer prepared the exhibits. Christina Hawley Anthony, William Carrington, Molly Dahl, Meredith Decker, Theresa Gullo, John McClelland, Brooks Pierce, and Chad Shirley provided helpful comments. The economic forecast and related estimates were prepared by Aaron Betz, Yiqun Gloria Chen, Erin Deal, Daniel Fried, Edward Gamber, Ronald Gecan, Mark Lasky, Junghoon Lee, Michael McGrane, Jaeger Nelson, Sarah Robinson, Jeffrey Schafer, John Seliski, Robert Shackleton, and Christopher Williams. Many other analysts at CBO contributed information about the pandemic and the effects of actions taken in response to it. Erin Deal and Sarah Robinson fact-checked the report. The writing of the report and the preparation of the forecast were supervised by Jeffrey Werling, John Kitchen, Devrim Demirel, and Robert Arnold.
Mark Doms, Wendy Edelberg, Jeffrey Kling, and Robert Sunshine reviewed the report. Christine Bogusz and Bo Peery were the editors, and Casey Labrack and Robert Rebach were the graphics editors. An electronic version is available on CBO’s website (www.cbo.gov/publication/56351).
CBO continually seeks feedback to make its work as useful as possible. Please send any comments to communications@cbo.gov.

Phillip L. Swagel
May 2020