Monthly Budget Review: Summary for Fiscal Year 2017

In fiscal year 2017, the budget deficit totaled $666 billion—$80 billion more than the shortfall recorded in 2016. Measured as a share of GDP, the deficit increased to 3.5 percent in 2017, up from 3.2 percent in 2016 and 2.4 percent in 2015.
Summary
In fiscal year 2017, which ended on September 30, the federal budget deficit totaled $666 billion— $80 billion more than the shortfall recorded in 2016. The deficit increased to 3.5 percent of the nation’s gross domestic product (GDP) in 2017, up from 3.2 percent in 2016 and 2.4 percent in 2015—but far lower than it was in 2009, when the deficit reached 9.8 percent of GDP.
In 2017, the government’s revenues amounted to $3.3 trillion—$48 billion (or 1 percent) more than receipts recorded in 2016. Revenues fell from 17.7 percent of GDP in 2016 to 17.3 percent in 2017, dropping just below the average (17.4 percent) of the past 50 years (see the figure below).
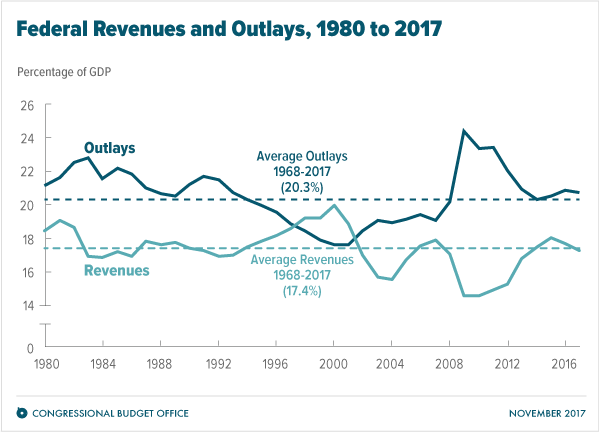
Net spending by the government was $4.0 trillion in 2017—$128 billion (or about 3 percent) more than spending in 2016. Outlays amounted to 20.8 percent of GDP in 2017, compared with 20.9 percent in 2016 and well below the 24.4 percent recorded in 2009 but still above the 50-year average of 20.3 percent.
Total Receipts: Up by 1 Percent in Fiscal Year 2017
Receipts from all major sources except payroll taxes declined as a percentage of GDP:
- Receipts from individual income taxes, the largest source of revenues, rose by $41 billion (or 3 percent). Those receipts fell from 8.4 percent of GDP in 2016 to 8.3 percent of GDP in 2017, still just above the average (8.0 percent) of the past 50 years.
- Income taxes withheld from workers’ paychecks increased by $64 billion (or 5 percent) because of growth in wages and salaries.
- Nonwithheld payments of income taxes, net of refunds, fell by $23 billion (or 7 percent). That decline in payments may be the result of weakness in nonwage income in calendar year 2016, or it could be the result of taxpayers shifting income from 2016 to later years because they expected that legislation enacted this year would reduce tax rates in the future. Part of the weakness in receipts may also reflect smaller-than-anticipated payments for economic activity in 2017. The sources of the weakness will be better understood once data from tax returns start to become available later this year.
- Receipts from payroll (social insurance) taxes, the second-largest revenue source, increased by $47 billion (or 4 percent), remaining essentially unchanged in relation to GDP, at about 6 percent. The increase in payroll tax receipts was mostly the result of higher wages and salaries.
- Receipts from corporate income taxes, the third-largest source of revenues, fell by $3 billion (or 1 percent) in 2017, dropping from 1.6 percent of GDP to 1.5 percent. That percentage of GDP is the lowest recorded since 2012 and below the average of 2.0 percent of GDP for the past 50 years. The decline probably reflects weakness in taxable corporate profits. Information about some of the sources of such weakness will become available over the next two years from corporate tax returns.
- Receipts from other sources declined by $37 billion (or 12 percent), dropping from 1.7 percent of GDP to 1.4 percent.
- Remittances from the Federal Reserve to the Treasury fell by $34 billion, most significantly because the Fixing America’s Surface Transportation Act, enacted in December 2015, required the Federal Reserve to remit most of its surplus account to the Treasury in fiscal year 2016. The central bank remitted $19 billion, the required amount, in a onetime payment in late December 2015. Remittances to the Treasury also were smaller in 2017 because short-term interest rates were higher, leading the central bank to pay depository institutions more interest on reserves.
- Excise taxes declined by $11 billion (or 12 percent) because of a one-year moratorium in 2017 on a tax on health insurance providers that had begun to be collected in 2014.
- Fees and fines rose by $7 billion, partly as a result of larger-than-usual miscellaneous penalty payments.
Total Outlays: Up by About 3 Percent in Fiscal Year 2017
Overall, net outlays increased by 3.3 percent from 2016 to 2017. That difference would have been about $39 billion greater—resulting in an increase of 4.4 percent—if not for the shift of certain payments from October to September in both 2016 and 2017 because October 1 fell on a weekend. The discussion below reflects adjustments to remove the effects of those timing shifts.
Outlays increased for most major categories but declined for others:
- Outlays for the three largest entitlement programs—Social Security, Medicare, and Medicaid—rose by $29 billion (or 3 percent), $22 billion (or 4 percent), and $6 billion (or 2 percent), respectively. Spending for Medicaid has risen by 41 percent over the past four years, largely because new enrollees were added through expansions of coverage authorized by the Affordable Care Act. The annual rate of growth in Medicaid spending, however, has fallen sharply since 2015, when it was 16 percent. Combined outlays for the three programs were equal to 48 percent of federal spending and 9.9 percent of GDP in 2017, slightly below the peak of 10.0 percent of GDP in 2016.
- Outlays for the Department of Education (included in the “Other” category in the table below) rose by $35 billion (or 45 percent) because the department revised upward, by $39 billion, the estimated net subsidy costs of loans and loan guarantees issued in prior years—a change much larger than last year’s $7 billion upward revision. If the effects of those revisions were excluded, outlays for the department would have increased by $2 billion (or 3 percent).
- Outlays for the Department of Housing and Urban Development (also included in the “Other” category) increased by $29 billion (or 110 percent), primarily because in 2017 the department made upward revisions to the estimated net subsidy costs of loans and loan guarantees issued in prior years; in 2016, it had made downward revisions.
- Outlays for net interest on the public debt increased by $26 billion (or 9 percent), largely because of differences in the rate of inflation. To account for inflation, the Treasury Department adjusts the principal of its inflation-protected securities each month. (It uses the change in the consumer price index for all urban consumers that was recorded two months earlier to make that adjustment.) The adjustments made in fiscal year 2016 totaled $15.5 billion, whereas those made in 2017 have totaled $33.1 billion.
- Spending by the Department of Veterans Affairs (also included in the “Other” category) rose by $9 billion (or 6 percent), in part because of typical growth in the number of veterans receiving disability compensation and in the amount of those payments, and in part because of continued growth in the number of veterans receiving health benefits through the Veterans Choice Program.
- Outlays for subsidies for health insurance purchased through the marketplaces established under the Affordable Care Act, which also are included in “Other” in the table, rose by about $8 billion (or 27 percent). Spending climbed largely because the premiums for those plans rose this year.
- Spending for the military activities of the Department of Defense (DoD) increased by $7 billion (or 1 percent) in 2017, the first increase since 2011. Growth in outlays for the Air Force accounted for that change—spending for other military services remained roughly unchanged. Outlays for the Air Force rose by 5 percent; its spending for operation and maintenance, procurement, and research and development increased by more than $2 billion each. Military spending by DoD was 3.0 percent of GDP in 2017, the same as in 2016, and lower than in any other year since 2002.
- Payments to the Federal Communications Commission from auctions of licenses to use the electromagnetic spectrum decreased by $7 billion. Those payments totaled just over $8 billion in 2016 and fell to roughly $2 billion in 2017. Because the proceeds from those auctions are recorded in the budget as offsetting receipts (that is, as reductions in outlays), that decrease in payments has resulted in higher outlays. Those outlays are included in “Other” in the table below.
- The government received $14 billion more in payments from Fannie Mae and Freddie Mac this year than it did last year, primarily because the entities were more profitable in fiscal year 2017 than in 2016. The two entities made quarterly payments to the Treasury in December, March, June, and September. Those payments, which are included in the “Other” category in the table, are recorded as offsets to spending and thus reduce net outlays.
- Outlays for the Department of Agriculture (also included in the “Other” category) decreased by $11 billion, primarily because the department made downward revisions in August 2017 to the estimated net subsidy costs of loans and loan guarantees issued in prior years, whereas in August 2016, it made upward revisions.
For other programs and activities, spending increased or decreased by smaller amounts, increasing outlays by an additional $13 billion, on net.
Estimates for October 2017
The government recorded a deficit of $62 billion in October, CBO estimates, about $17 billion more than the shortfall recorded in the same month last year. Both revenues and outlays were higher than they were last year, but outlays increased more. Shifts in the timing of payments affected the deficits in both years; if not for those shifts, the deficit in October 2017 would have been $19 billion more than it was in October 2016.