An Analysis of the President’s 2017 Budget

CBO and the staff of the Joint Committee on Taxation (JCT) project that, between 2017 and 2026, the President’s budget would result in deficits averaging 3 percent of GDP and totaling $6.9 trillion, $2.4 trillion less than CBO’s baseline.
Summary
This report by CBO presents an analysis of the President’s budget request for fiscal year 2017. The analysis is based on CBO’s economic projections and estimating models, rather than on the Administration’s, and the estimates of the effects of the President’s tax proposals were prepared by the staff of the Joint Committee on Taxation (JCT). The economic projections used in this analysis largely reflect CBO’s assessment of the effects of fiscal policies under current law. Later this year, in a separate report, CBO will analyze the full economic effects of the President’s proposals and their implications for the federal budget.
Under the President’s proposals, the federal budget deficit would decline in 2017 and 2018. After that, however, outlays would rise more quickly than revenues, so deficits would grow. As a result, federal debt held by the public would grow as well. By 2026—the end of the period covered by the President’s budget—such debt would be higher than it is now, measured as a percentage of the nation’s economic output, and it would be rising.
Deficits would be smaller under the President’s proposals than those that would occur under current law, CBO projects—by a small amount for the current fiscal year and by larger amounts for the next 10 years. Most of that deficit reduction would be achieved by raising revenues.
Under the President’s Proposals, Deficits Would Shrink Over the Next Two Years and Then Rise Steadily
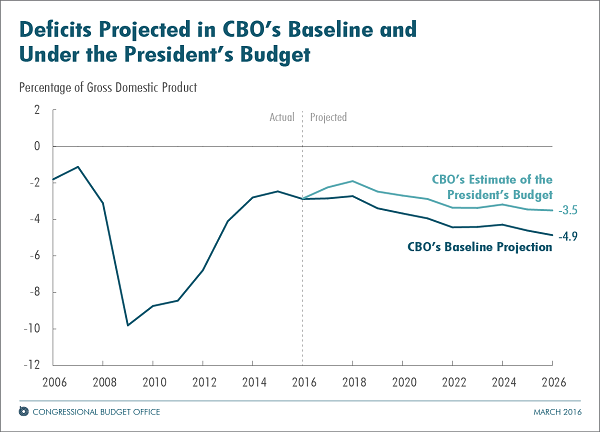
Under the President’s proposals, CBO estimates, the deficit would total $529 billion in 2016. It would fall to $433 billion in 2017, fall further to $383 billion in 2018, and then increase in most subsequent years, eventually growing to $972 billion in 2026. The cumulative deficit over the 2017–2026 period would total $6.9 trillion. Measured as a percentage of output, the deficit would equal 2.9 percent of gross domestic product (GDP) in 2016, drop to about 2 percent for the next two years, and then start increasing; it would equal 3.5 percent in 2026. (The average deficit over the past 50 years has equaled 2.8 percent of GDP.)
Federal debt held by the public would equal 75 percent of GDP this year and next, dip to 74 percent for the following few years, and then start rising again. By the end of 2026, it would total $21.4 trillion, or 77 percent of GDP.
Deficits Would Be Smaller Under the President’s Proposals Than Under Current Law
CBO estimates that the President’s proposals would result in smaller deficits than those in the agency’s baseline budget projections, which largely reflect the assumption that current tax and spending laws will remain unchanged. This year, the proposals would reduce the deficit by $5 billion, mostly by changing policies affecting revenues. The deficit would remain lower than projected in the baseline during every year of the 2017–2026 period, resulting in a cumulative deficit that was $2.4 trillion less than the $9.3 trillion projected in the baseline. Deficits over the period would average 3.0 percent of GDP, or 1.0 percentage point lower than their average in the baseline (see figure below). As a consequence, debt held by the public would also be lower than projected in the baseline—by 2026, about 8 percentage points of GDP lower.
The President’s proposals would achieve most of that deficit reduction by increasing revenues. Between 2017 and 2026, revenues would be $2.8 trillion (or 7 percent) higher than in CBO’s baseline projections. The proposals that would result in the largest increases in revenues are the following:
- Limiting certain individual income tax deductions for higher-income taxpayers ($543 billion);
- Enacting immigration reform ($386 billion);
- Imposing a minimum tax on certain foreign income ($298 billion);
- Imposing a tax on oil ($273 billion); and
- Increasing taxes on capital gains and dividends ($245 billion).
Under the President’s proposals, total revenues would equal 19.3 percent of GDP from 2017 through 2026, on average (see Table 2). In the baseline, by contrast, revenues are projected to average 18.1 percent of GDP during that period. Over the past 50 years, they have averaged 17.4 percent.
In most years, total outlays would also be higher under the President’s proposals than in the baseline, though the difference would be much smaller than for revenues—less than $1 billion higher this year and $401 billion (or 1 percent) higher over the 2017–2026 period. The 10-year increase would be the net result of the following changes:
- An increase of $1.0 trillion in mandatory spending (which is spending for programs generally governed by provisions of permanent law)—consisting of a $1.4 trillion increase in spending related to immigration reform, income security programs, transportation, education, and other areas, offset in part by a $0.4 trillion reduction in Medicare outlays;
- A decrease of $288 billion in discretionary outlays (which result from funding provided or controlled by appropriation acts)—stemming from sharply lower outlays for military operations and related activities in Afghanistan and elsewhere (known as overseas contingency operations, or OCO) and from a reclassification of some transportation spending, partially offset by an increase in other discretionary outlays; and
- A decrease of $343 billion in net interest costs, primarily the result of the lower deficits that would occur under the President’s proposals.
Under the proposals, total outlays would average 22.3 percent of GDP from 2017 to 2026. In CBO’s baseline, they average 22.1 percent of GDP during that period. They have averaged 20.2 percent of GDP over the past 50 years.
CBO’s Estimates of Deficits Under the President’s Proposals Are Mostly Higher Than the Administration’s
CBO’s estimate of the cumulative 10-year deficit under the President’s proposals is $776 billion higher than the Administration’s estimate of $6.1 trillion. Specifically, CBO’s estimates of revenues are $1.6 trillion (or 4 percent) lower than the Administration’s, and CBO’s estimates of outlays are $856 billion (or 2 percent) lower. According to CBO’s calculations, the deficit would be smaller than the Administration anticipates this year and for the following three years. After that, CBO estimates larger deficits under the President’s policies than the Administration does.
Of the $776 billion difference, roughly one-third stems from technical estimating differences, and about two-thirds is accounted for by variations between CBO’s and the Administration’s economic projections. Some of those variations arise because the Administration incorporates its assessment of the economic effects that the President’s proposals would have; CBO’s estimates, by contrast, are based on an economic forecast that reflects current law, except for some of the effects of the changes in the population and labor force that would result from the President’s proposed immigration reform.