
Notes
Notes
Data from the Federal Transit Administration reflect the reporting periods used by individual transit agencies, which may be calendar years, state fiscal years, or federal fiscal years, which run from October 1 to September 30 and are designated by the calendar year in which they end. All other years referred to in this report are federal fiscal years unless otherwise indicated. Numbers in the text, tables, and figures may not add up to totals because of rounding.
The federal government has long provided significant financial support for public transportation. Federal spending accounted for about one-sixth of the $79 billion in public spending on transit in 2019. During the coronavirus pandemic, the federal government played an even greater role in transit funding. In addition to the government’s regular annual financial assistance to transit agencies, lawmakers allocated nearly $70 billion in onetime supplemental funding during 2020 and 2021. About one-third of that amount had been spent as of the end of 2021.
Following the provision of the onetime funding, lawmakers enacted the Infrastructure Investment and Jobs Act (IIJA, Public Law 117-58), which increased the federal government’s annual support for public transit through 2026. The law provided about $18 billion annually for public transportation programs from 2022 to 2026, 42 percent more than the amount provided from 2016 to 2021. In addition to that increase in funding designated specifically for public transportation, the IIJA also provided about $13 billion in total funding during the 2022–2026 period for new surface transportation programs, potentially including mass transit.
In this report, the Congressional Budget Office describes public transportation in the United States and explains how the federal government supports mass transit. The report also explains how financing subsidies provide additional federal support.
Public Transportation in the United States
The use of public transportation is concentrated in large cities, particularly in the New York City metropolitan area. Together, federal, state, and local governments represent the largest source of funding for public transportation. Transit agencies also rely on passenger fares and other operating receipts. In 2019 (before the onset of the pandemic), the federal government accounted for about one-sixth of all funding for public transportation, including about one-third of spending for capital investment in vehicles such as buses and trains, and transit structures such as buildings and rails. Transit agencies have experienced substantial financial challenges during the pandemic, owing largely to a sharp, sustained falloff in ridership.
Use of Transit by Mode and Urban Area
Most travel on public transportation is by bus or by heavy rail, such as subways; on 85 percent of trips, people use one or the other.1 Most other trips are made on commuter rail or light rail, such as streetcars.
Transit service is offered by about 2,200 public transportation systems that receive funding from the Federal Transit Administration (FTA). Almost all public transportation trips are taken on urban transit systems, which serve areas with at least 50,000 residents.2
Not only is almost all transit use urban, but it is heavily concentrated in a handful of large cities and their surrounding suburbs. About three-quarters of all public transportation trips are made in 10 large urban areas; New York City and adjoining parts of New Jersey and Connecticut account for 4 out of every 10 trips. Although rural travel accounts for only about 1 percent of all trips taken nationwide on public transportation, rural transit can nonetheless be an important means of transportation to riders who rely on it for trips to school or health care facilities, or for other purposes.3
Sources of Transit Agencies’ Income
In 2019, spending on public transportation totaled $79 billion, of which $54 billion was for operations and $24 billion was for purchases of capital and equipment.4 Transit agencies rely on both government support and their own revenues. About two-thirds of the income of transit agencies comes from government: States and localities supply more than three-quarters of that share, and the federal government provides the remainder. Transit agencies’ revenues, which include operating receipts, such as passenger fares, along with the taxes and tolls that some transit agencies collect, account for the rest of agencies’ income (see Table 1).
Table 1.
Shares of Transit Agencies’ Income, by Source, 2019
Percent
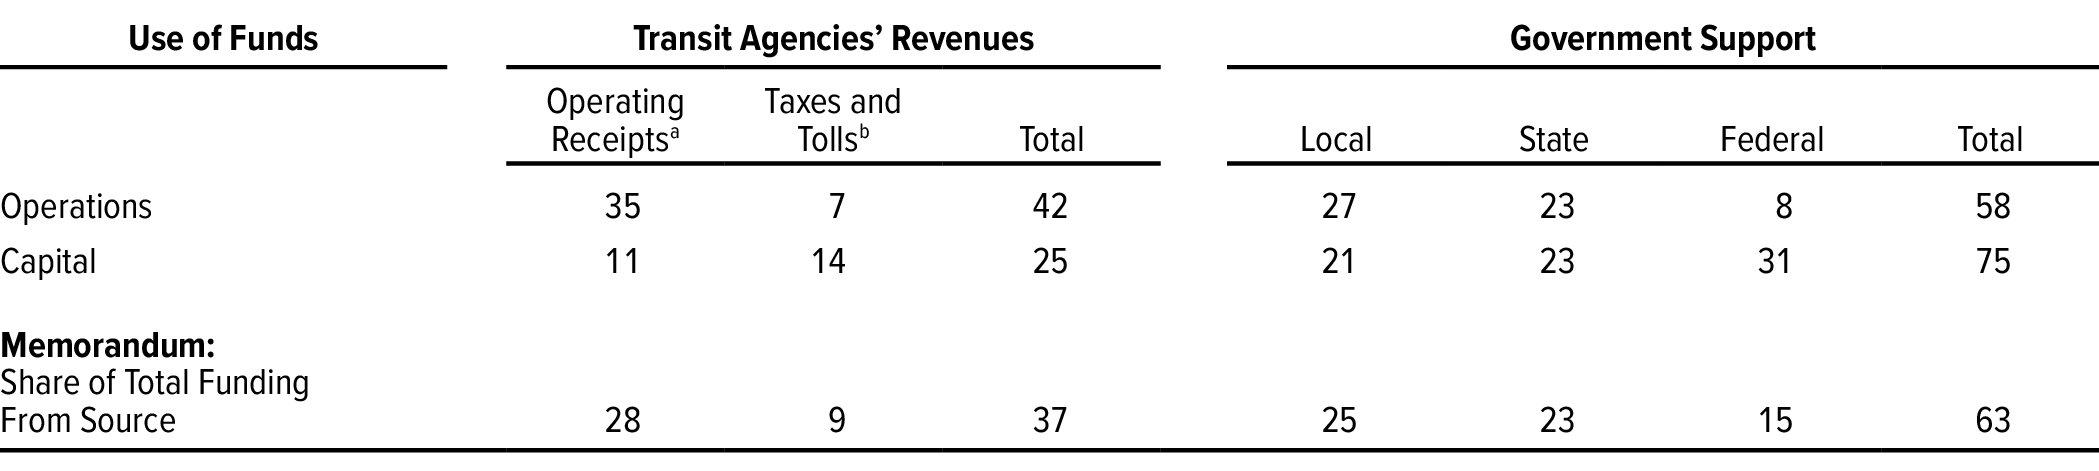
Data source: Congressional Budget Office, using data from the Federal Transit Administration. See www.cbo.gov/publications/57636#data.
Income used for operations is spent on labor, fuel, and maintenance. Income used for capital is spent on investment in transit structures, equipment, and intellectual property (including software).
a. The Federal Transit Administration refers to operating receipts as “Fares and Other Directly Generated Funding.” Operating receipts include passenger fares, payments for concessions and advertising, and “Park and Ride” fees.
b. Only transit agencies that are organized as independent authorities may impose taxes and tolls. Toll revenues may also be reported in other categories of this table, such as operating receipts. As a result, the figures reported in the table may be an underestimate of the share of transit funding tolls account for.
Government funding covers the largest portion of spending on both operations and capital. That funding accounts for 75 percent of spending on capital and 58 percent of spending on operations.
Effects of the Pandemic on Transit Agencies’ Finances
Transit agencies’ finances changed substantially during the pandemic. A sharp drop in the use of mass transit after the onset of the pandemic in 2020 caused a steep fall in operating receipts. State and local tax revenues also fell sharply at the beginning of the pandemic but have since recovered.
Declines in Ridership. The decline in travel that resulted from working at home, social distancing that occurred in response to the spread of the coronavirus, and the economic contraction that resulted from the pandemic contributed to a precipitous decline in the use of public transportation in spring 2020. The number of trips was about 75 percent lower than it had been over the same period in 2019. Although ridership partially rebounded later in 2020, it remained well below its prepandemic level throughout calendar year 2021 (see Figure 1).
Figure 1.
Passenger Trips Using Public Transportation
Billions of Trips

The use of public transportation fell sharply at the onset of the coronavirus pandemic in March 2020 and has remained well below its prepandemic level.
Data source: Congressional Budget Office, using data from the Federal Transit Administration. See www.cbo.gov/publications/57636#data.
Data are only for urban areas that have populations of 50,000 or more.
All years are calendar years.
Trips represent the number of times that transit passengers board a public transportation vehicle. Each time passengers get on a different vehicle during their transit journey—whether they pay a separate fare, use a transfer, or board a vehicle for free—it is counted as a trip.
Because more than one-quarter of the funding for public transportation comes from operating receipts (most of which consist of passenger fares), transit agencies’ budgets are closely tied to ridership. In fact, trips on public transportation and operating receipts fell by about the same percentage—40 percent and 39 percent, respectively—from 2019 to 2020 (see Figure 2).
Figure 2.
Passenger Trips and Operating Receipts Before the Pandemic and in 2020

Transit agencies’ operating receipts fell when ridership decreased during the coronavirus pandemic.
Data source: Congressional Budget Office, using data from the Federal Transit Administration and the American Public Transportation Association. See www.cbo.gov/publications/57636#data.
Ridership totals are based on the reporting periods used by individual transit agencies and may differ from the ridership totals reported in Figure 1. Trips represent the number of times that transit passengers board a public transportation vehicle. Each time passengers get on a different vehicle during their transit journey—whether they pay a separate fare, use a transfer, or board a vehicle for free—it is counted as a trip.
State and Local Budgets. Because state and local governments together account for about one-half of public transportation funding—each contributing a roughly equal share—their budgets can have an important impact on finances for public transportation. As a result of the economic contraction during the pandemic, the tax revenues of states and localities declined sharply but very briefly in the early stages of the pandemic. Revenues from major sources—personal income, corporate income, sales, and property taxes—dropped by 18 percent in the second quarter of calendar year 2020 compared with the same period in 2019. (Some of that decline reflected a shift of income tax deadlines to July 15 in most states.)5
Revenues rebounded strongly after the second quarter of 2020. From July 2020 through June 2021, cumulative state and local revenues from major taxes were 6 percent higher than they were during the previous 12 months. Since June 2021, those revenues have continued to rise, increasing at an annual rate of 2 percent through September 2021, after adjusting for seasonal factors.6
Federal Support for Transit Agencies
Federal financial support for public transportation includes annual funding, onetime supplemental funding, and financing subsidies.
- Regular annual funding for federal aid for public transportation averaged $13 billion from 2016 to 2021. The Congress recently reauthorized federal funding for transit programs, providing annual funding for public transportation that is 42 percent more than the amount of regular funding that was provided for the 2016–2021 period.
- Supplemental funding provided during the pandemic played an important role in supporting public transportation: Lawmakers allocated nearly $70 billion for aid to transit systems in response to the sharp drop in public transportation ridership and revenues that began in spring 2020.
- Federal financing subsidies for public transportation include tax preferences for bonds that finance transit projects, as well as direct loans, loan guarantees, and lines of credit.
Annual Funding
The federal government has long provided annual support for transit agencies. (See Box 1 for long-term trends in federal spending for transit.) The President signed the IIJA, which reauthorized existing public transportation programs through 2026, in November 2021. That law provided more funding for transit programs from 2022 to 2026 than was provided from 2016 to 2021.
Box 1.
Federal Spending for Transit Programs
Adjusted to remove the effects of inflation, federal spending for public transit has averaged about $14 billion annually since the Transportation Equity Act for the 21st Century (TEA-21, Public Law 105-178) took effect in 1998. Total spending, spending for capital, and spending for operation and maintenance have varied (see figure below). On average, just over two-thirds of federal outlays for mass transit have gone to capital spending, and the rest have gone to operation and maintenance.1
The monies provided to the Federal Transit Administration (FTA) are typically not all spent in the year that funding is made available, so federal spending in a given year may differ from the amount of funding that the FTA receives in that year. For example, once contract authority becomes available, transit agencies can commit (or obligate) that funding to pay future project costs. For capital projects in particular, federal outlays typically occur over time, as the FTA reimburses transit agencies for expenses they incur as a project moves forward. Also, some of the funding may never be used, so no spending will be associated with it.
Federal Spending on Public Transportation by Type of Spending, 1998 to 2019

Data source: Congressional Budget Office, using data from the Federal Transit Administration. See www.cbo.gov/publications/57636#data.
Funds for operations are spent on labor, fuel, and maintenance. Funds for capital are spent on transit structures, equipment, and intellectual property (including software).
Spending rose in the late 1990s as a result of TEA-21, which authorized federal transit programs for the 1998–2003 period. Spending increased for both capital and operation and maintenance; combined, those outlays (measured in 2019 dollars) rose from $10 billion in 1998 to $16 billion in 2002.
After 2002, federal outlays on public transportation, adjusted for inflation, fell steadily through the mid-2000s. In particular, spending on transit capital declined, and outlays for operation and maintenance were relatively stable. As a result, total federal spending on public transportation declined to $13 billion (in 2019 dollars) in 2008. During 2009 and 2010, it rose as a result of the American Recovery and Reinvestment Act of 2009 (ARRA, P.L. 111-5), which provided transit agencies with $8 billion to spend on capital projects (outlays for operation and maintenance also increased during that time).2 Federal spending on public transportation fell immediately thereafter, and, by 2013, outlays for both capital and operation and maintenance had almost returned to their pre-ARRA levels (in 2019 dollars), where they essentially remained through 2019.
1. See supplemental tables for Congressional Budget Office, “Public Spending on Transportation and Water Infrastructure, 1956 to 2017” (October 2018), www.cbo.gov/publication/54539.
2. See Congressional Budget Office, Public Spending on Transportation and Water Infrastructure (November 2010), pp. 2–5, www.cbo.gov/publication/21902.
Almost all annual federal support for public transportation is provided through the FTA, typically in the form of grants to individual transit agencies. Most of the FTA’s grants are based on formulas that were set when funding was authorized. Those formulas allocate grants on the basis of the size and density of an area’s population, the amount of local transit infrastructure, the amount of demand for public transportation, and other relevant characteristics. Some grants are distributed on a competitive basis. A few of the FTA’s programs combine the two approaches. Both approaches often include provisions to ensure that grants are distributed among transit agencies of different sizes and in urban and rural locations. Although the FTA’s grants are primarily intended for capital projects, in some cases they may also be used for operation and maintenance.
The FTA draws its funds from both the mass transit account of the Highway Trust Fund (HTF) and the general fund of the Treasury. About three-fourths of funding for the FTA’s programs—particularly the programs that make grants based on predetermined formulas—comes from the HTF’s mass transit account (see Box 2). Because supplemental federal funding for public transportation during the pandemic came from the general fund, the amount of money drawn from the HTF’s mass transit account has not increased as a result of the pandemic, though supplemental spending may indirectly influence other spending from the HTF.
Box 2.
The Highway Trust Fund
The Highway Trust Fund (HTF) is an accounting mechanism in the federal budget that comprises two separate accounts, one for highways and one for mass transit. The trust fund records revenues collected through excise taxes on the sale of motor fuels, trucks and trailers, and truck tires; taxes on the use of certain kinds of vehicles; and interest credited to the fund. Typically, about 80 percent of revenues in the HTF are allocated to highway programs, and 20 percent are allocated to mass transit.
The HTF’s receipts have fallen short of the amounts disbursed from the highway and mass transit accounts for more than a decade. Laws enacted since 2008 have transferred more than $268 billion—mostly from the Treasury’s general fund—to the HTF. Of that amount, over 40 percent ($118 billion) was transferred by the Infrastructure Investment and Jobs Act— $90 billion to the highway account and $28 billion to the mass transit account. At the end of December 2021, the mass transit account’s balance was $34.7 billion, according to the Federal Highway Administration.
Annual Funding From 2016 to 2021. Over the 2016–2021 period, the FTA received regular annual funding averaging $13 billion per year. Funding from the HTF accounted for $10 billion and was concentrated in two large grant programs: Roughly one-half went to the Urbanized Area Formula Funding program, and about another quarter went to the State of Good Repair Formula Program. The two grants emphasize projects for heavy rail and other types of transit services that operate on dedicated rail lines or road lanes.7 The remaining $3 billion of annual funding for transit programs came from the Treasury’s general fund; the bulk of the money went to the Capital Investment Grants program. That program makes grants for projects like those funded by the State of Good Repair Formula Program.
Annual Funding From 2022 to 2026. The IIJA reauthorized federal surface transportation programs, including regular annual funding for transit programs, for the 2022–2026 period. Funding for public transportation programs increased from an average of $13 billion per year over the 2016–2021 period to an average of about $18 billion per year during the 2022–2026 period (see Table 2). The IIJA’s funding includes:
- An average of $14 billion annually from the HTF in the form of contract authority,8 and
- Approximately $4 billion annually from the general fund of the Treasury in the form of advance appropriations for grants for transit infrastructure.9
Table 2.
Average Annual Federal Funding for Public Transportation Programs, 2016 to 2026

Data sources: Infrastructure Investment and Jobs Act (Public Law 117-58) Division C–Transit and Division J–Appropriations; Congressional Budget Office, cost estimate for Senate Amendment 2137 to H.R. 3684, the Infrastructure Investment and Jobs Act, (August 5, 2021), www.cbo.gov/publication/57406. See www.cbo.gov/publications/57636#data.
Funding reported in the table does not include supplemental federal funding of $70 billion in 2020 and 2021 to support transit agencies during the coronavirus pandemic. Totals may not match funding amounts reported elsewhere in the report because of rounding.
FAST Act = Fixing America’s Surface Transportation Act; IIJA = Infrastructure Investment and Jobs Act; n.a. = not applicable.
a. Represents funding provided for 2016 to 2020 by the FAST Act and for 2021 by legislation extending that authorization and by subsequent appropriation laws.
b. Represents contract authority and appropriations in the IIJA. In contrast to the funding shown in this table, CBO’s cost estimate for the IIJA reports annual contract authority for transit and other surface transportation programs relative to CBO’s baseline projection, which is set equal to a program’s last authorized amount of contract authority—in this case, for 2021.
c. Programs that are funded from the Highway Trust Fund receive contract authority, which allows transit and other transportation agencies to commit funds to pay future project costs. Although the actual amount of funding available for that purpose is set by annual appropriation laws, any contract authority that is unobligated in a given year, either because some funding is unspent or because the annual appropriation falls short of the amount authorized, remains available to transit agencies for future spending.
d. Programs that are funded from the Treasury’s general fund receive annual appropriations.
e. The IIJA provided $8 billion in advance appropriations for Capital Investment Grants, which will be available in equal amounts each year from 2022 to 2026 and remain available until expended. The IIJA also authorized an additional $7 billion to be appropriated for Capital Investment Grants and $0.7 billion for other transit programs funded from the general fund. The actual amount of funding that becomes available for those authorizations will depend on future appropriations.
f. Shows advance appropriations, which are distributed in equal amounts each year from 2022 to 2026 and which remain available until expended.
In addition, some programs that were not funded by IIJA routinely receive their funding through the annual appropriation process and thus are likely to receive funding from future appropriation laws. Those programs include, for example, FTA’s grants to the Washington Metropolitan Area Transit Authority.
The IIJA also created two new programs that can be used to fund surface transportation projects, including transit: the National Infrastructure Project Assistance program and the Local and Regional Project Assistance program (see Table 3). The two programs have received an advance appropriation of about $13 billion, distributed evenly from 2022 to 2026, to award competitive grants to surface transportation projects, potentially including transit projects. Those grants will be paid for with revenues from the Treasury’s general fund. The National Infrastructure Project Assistance program, which received a total of $5 billion, will fund projects that are expected to result in national or regional economic, mobility, or safety benefits. The Local and Regional Project Assistance program, which received a total of approximately $8 billion, will fund projects that have significant local or regional impact and improve transportation infrastructure; at least 1 percent of its funding must go to communities in which at least 20 percent of the population lives in poverty.
Table 3.
New Competitive Grant Programs for Surface Transportation, Including Transit
Billions of Dollars

Data source: Infrastructure Investment and Jobs Act (Public Law 117-58), sections 21201 and 21202. See www.cbo.gov/publications/57636#data.
All funding comes from general revenues.
a. Shows advance appropriations, which are distributed in equal amounts each year from 2022 to 2026 and which remain available until expended.
b. In addition to the amount shown, appropriations of an additional $5 billion were authorized for the National Infrastructure Project Assistance program. The actual amount of additional funding will depend on future appropriations.
Supplemental Funding in Response to the Pandemic
In its response to the coronavirus pandemic, the federal government implemented measures that provided both direct and indirect financial support to public transportation. Nearly $70 billion in supplemental federal funding has been allocated to help transit agencies make up for the drop in ridership and revenues they have experienced during the pandemic. State and local governments have also seen a sharp rise in federal grants and transfers, which, given those governments’ role in subsidizing public transportation, represents an indirect financial boost to transit agencies.
The Coronavirus Aid, Relief, and Economic Security (CARES) Act (P.L. 116-136), which was enacted in March 2020, was the first of three measures to provide supplemental federal funds for transit agencies during the pandemic. The CARES Act provided $25 billion in addition to the FTA’s 2020 appropriation. Although the supplemental funding was distributed to transit agencies using the same allocation scheme as the FTA’s capital grant programs, it was directed to operations. The fact that the funds were spent quickly suggests that they were indeed used for operations: By the end of calendar year 2020, transit agencies had spent one-half of the funding they received from the CARES Act.
The FTA received additional funding of $14 billion and almost $31 billion, respectively, from two subsequent measures: the Consolidated Appropriations Act, 2021 (P.L. 116-260), which was enacted in January 2021, and the American Rescue Plan Act of 2021 (P.L. 117-2), which was enacted in March 2021. Both laws stipulate that essentially all transit funding be spent first on operating and payroll expenses to prevent transit agencies from having to furlough employees. Transit agencies are not required to match the funding with their own revenues. Transit agencies that certify to the FTA that they have not furloughed any employees can use those funds for other purposes. Both laws modify the funding allocation used by the CARES Act to provide more money to large transit agencies.10
The large amount of supplemental federal funding and the length of time transit agencies are given to spend it will probably enable public transportation to absorb revenue shortfalls for the next several years. Transit agencies in urban areas, for example, are eligible to receive supplemental federal funds equal to 132 percent of their 2018 operating costs. That funding could enable transit agencies to reduce passenger fares to encourage riders to return to public transit or make expenditures for purposes other than operations, such as investment in structures and equipment.
Few limits have been set on the amount of time transit agencies have to spend supplemental funding. There is no deadline by which funds from either the CARES Act or the Consolidated Appropriations Act must be spent; those laws specify that transit funding is “available until expended.” (By the end of fiscal year 2021, approximately $25 billion of the nearly $70 billion that was allocated to help transit agencies make up for declines in ridership and revenues had been spent.) Supplemental transit funding provided by the American Rescue Plan Act remains available through fiscal year 2024. Transit agencies can spend any funds that have not been earmarked by the end of fiscal year 2023 for purposes other than operations without certifying that everyone who has been on their payroll is still fully employed by them.
The leeway given to transit agencies in spending supplemental funding may result in less spending from the HTF in the short term. In contrast to regular federal grant programs for public transportation, transit agencies are not required to match supplemental federal dollars with their own money. (Match rates are typically 20 percent for capital projects and 50 percent for operating expenses.) The absence of a match requirement can make it advantageous for transit agencies to draw upon supplemental federal funding before turning to regular federal grant programs.
In addition to directly supplying transit agencies with funding during the pandemic, the federal government also provided an indirect financial boost to public transportation by increasing its support for states and localities. For example, the CARES Act established the Coronavirus Relief Fund, which has provided state and local governments with $150 billion to pay for expenses incurred in providing public health services in response to the pandemic. In addition, the Coronavirus State and Local Fiscal Recovery Funds program, which was created by the American Rescue Plan Act, supplied state and local governments with $350 billion that they can use for a broader range of purposes, including making up shortfalls in those governments’ general revenues, than the purposes for which they can use the supplemental funding from the CARES Act.11
Financing Subsidies
The federal government provides several types of financing subsidies for public transportation. The most common type of subsidy is delivered through the tax code in the form of favorable treatment of bonds issued by governmental entities to finance their own projects or, in some cases, projects undertaken by firms in the private sector. Those bonds pay interest that is exempt from federal income tax—thus lowering the cost of borrowing for public transit. Other types of federal financing subsidies are lines of credit, loans, and loan guarantees that enable transit agencies to borrow at below-market interest rates, either directly or through state infrastructure banks (SIBs).
Tax-Preferred Financing. A public transportation project is usually undertaken and financed by a transit agency. Acting on behalf of a state or local government, the agency issues bonds whose interest is exempt from federal income tax. The tax exemption for interest income from state and local bonds (known as a tax expenditure) results in federal revenues being lower than they would otherwise be.
Tax-exempt bonds reduce the issuer’s borrowing costs because because their interest payments are tax-free and they can normally pay a lower rate of interest than they would pay for taxable bonds of comparable risk and maturity. Tax-exempt bonds that finance public transportation projects are generally repaid with either operating revenues—in particular, passenger fares—or sales or other taxes.12
As of July 2021, the credit rating agency Standard and Poor’s (S&P) had rated $81 billion in outstanding bonds issued by 35 transit agencies.13 Bonds repaid with transit agencies’ revenues account for almost one-half of that debt, and the rest of the debt is being repaid with revenues from sales and other taxes. Almost all the bonds repaid with agency revenues were issued by the Metropolitan Transportation Authority of New York (MTA).14
The S&P data probably underestimate the number and the volume of tax-exempt bonds issued for public transportation and, as a result, their importance in financing transit investment. For example, those data only include bonds that were specifically issued to finance transit projects (or issued by a public transportation authority) and that have received an S&P credit rating. The data exclude unrated bonds, debt that was rated by a credit rating agency other than S&P, and bonds issued for multiple purposes, including public transportation. At the same time, the transit debt rated by S&P is not limited to tax-exempt bonds but includes some taxable bonds, known as Build America Bonds, as well.
In addition to public financing of transportation, private firms may sometimes provide financing for public transportation projects. In such cases, they take on financial risk. Arrangements that transfer project risk or financial risk from the public to the private sector are known as public-private partnerships (PPPs).15 As with bonds issued to finance government investment, the federal government subsidizes bonds issued to finance transit projects undertaken by the private sector by exempting interest payments on that debt from federal income tax. Such bonds are known as qualified private activity bonds (QPABs), and they may be issued to finance transit (described in law as “mass commuting facilities”) and other projects with a public purpose.
Few QPABs have been issued for public transportation projects—so few that they are not typically reported separately by the Internal Revenue Service to avoid disclosing information about specific bonds. Two factors probably account for the effective absence of QPABs in financing transit investment. First, as of 2020, only four PPPs had been privately financed. Second, the restrictions on QPABs for public transportation may limit their attractiveness to the private sector: The transit facility must be owned by a government entity, and the proceeds from a QPAB cannot finance the purchase of rolling stock such as buses and rail cars.16
Subsidized Lending. Another way that the federal government supports investment in public transportation is by providing loans at subsidized rates of interest. The Transportation Infrastructure Finance and Innovation Act (TIFIA) program, which is administered by the Department of Transportation, offers loans at below-market interest rates, loan guarantees, and lines of credit to borrowers undertaking surface transportation projects. Both public- and private-sector projects can be financed through TIFIA, so participants in PPPs can qualify for the program. (Even if a private firm does not finance a PPP and therefore has no interest in applying for a TIFIA loan, it still benefits from the reduction in the cost of borrowing if its public-sector partner takes out a TIFIA loan.) To date, the Department of Transportation has closed on $11 billion in TIFIA financing for transit systems.17
The federal government is also an indirect source of subsidized loans for public transportation through the lending activity of SIBs. States can use some of the formula grants they receive from the FTA to capitalize an SIB, and they use SIBs to finance transportation projects by lending money to local governments or by repaying bonds. Although transit projects can receive loans from an SIB, the banks mostly support highway projects.18
1. In this report, estimates of the number of trips taken on public transportation represent the number of times that transit passengers board a public transportation vehicle. Each time passengers get on a different vehicle during their transit journey—whether they pay a separate fare, use a transfer, or board a vehicle for free—it is counted as a trip (called an unlinked trip by transit officials).
2. See American Public Transportation Association, 2021 Public Transportation Fact Book (APTA, 2021), https://tinyurl.com/yjvcxeh4.
3. Ibid., Table 2, p. 33; also see Todd Litman, Public Transportation’s Impact on Rural and Small Towns (American Public Transportation Association, October 2017), https://tinyurl.com/2p8wsp9m.
4. See Federal Transit Administration, National Transit Database, “2019 Funding Sources” (accessed January 26, 2021), https://go.usa.gov/xeGmn. Totals that are reported by the FTA may differ slightly from those reported by CBO, in part because CBO uses federal fiscal years, and FTA data reflect the reporting periods used by individual transit agencies, which may be calendar years, state fiscal years, or federal fiscal years.
5. See Lucy Dadayan, State Tax and Economic Review, 2020 Quarter 2 (Urban-Brookings Tax Policy Center, December 2020), https://tinyurl.com/2fdzsrd7.
6. See Lucy Dadayan, State Tax and Economic Review, 2021 Quarter 2 (Urban-Brookings Tax Policy Center, December 2021), https://tinyurl.com/4zr8vrz4; and Bureau of Economic Analysis, “National Income and Product Accounts Table 3.3: State and Local Government Current Receipts and Expenditures” (accessed January 10, 2022), https://go.usa.gov/xt2hS.
7. For a description of the FTA’s programs, see William J. Mallett, Federal Public Transportation Program: In Brief, Report R47002, version 2 (Congressional Research Service, January 4, 2022), https://go.usa.gov/xzP5R.
8. Contract authority allows federal agencies to commit funds to pay costs incurred in the future. The actual amount of funding available for that purpose each year is set in annual appropriation bills, typically in amounts close to authorized contract authority, in the form of obligation limitations that restrict the amount of funding that can be obligated in that year. (An obligation is a legally binding commitment by the federal government that will result in outlays, immediately or in the future.) Contract authority that remains unobligated in a given year—either because the available funds are unspent or because the annual appropriation falls short of the amount authorized—remains available for future spending.
9. An advance appropriation provides funding that becomes available at a specified future date without further Congressional action.
10. Because the FTA’s programs are designed to fund transit agencies of all sizes, the largest transit agencies receive smaller subsidies per rider than smaller systems. For example, although the top 10 transit agencies account for 61 percent of trips on public transportation, they receive 36 percent of all federal outlays. As a result, because it relied on the FTA’s existing scheme for allocating grants, the CARES Act did not provide large transit agencies with enough supplemental funding to compensate for the revenues those agencies lost because of the falloff in ridership.
11. See Department of the Treasury, “Assistance for State, Local, and Tribal Governments” (accessed January 30, 2021), https://go.usa.gov/xepCh.
12. In some cases, the Department of Transportation allows the issuance of tax-exempt transit bonds that can be repaid by future federal transit grants. Few of those bonds, which are called grant anticipation notes, have been issued since they were first authorized in 1998. See Congressional Budget Office, Federal Support for Financing State and Local Transportation and Water Infrastructure (October 2018), www.cbo.gov/publication/54549.
13. A more informative measure of the importance of tax-exempt bonds to public transportation would also reflect the issuance of those bonds over time, so that tax-exempt bond proceeds used for public transportation could be compared with capital spending for that purpose. Such data are not readily available. For example, in the Internal Revenue Service’s annual statistics on the issuance of tax-exempt debt, transit bonds are combined with state and local borrowing for other types of transportation, such as highways and airports.
14. See Standard & Poor’s, “Global Ratings—Master List of Ratings Actions” (accessed December 21, 2021), https://tinyurl.com/2tkpevj5. The status of the New York MTA as a bond issuer is perhaps also reflected in the fact that it was among only a handful of potential borrowers, including state governments, that took advantage of the Municipal Liquidity Facility established by the Federal Reserve to support the municipal debt market during the pandemic. The MTA had borrowed approximately $3 billion by the program’s expiration at the end of 2020.
15. For a discussion of the role public-private partnerships play in providing infrastructure, see Congressional Budget Office, Public-Private Partnerships for Transportation and Water Infrastructure (January 2020), www.cbo.gov/publication/56003.
16. See Joint Committee on Taxation, Overview of Selected Provisions and Options Relating to Funding and Financing Infrastructure Investments, JCX-2-20 (January 27, 2020), www.jct.gov/publications/2020/jcx-2-20/.
17. CBO made this calculation on the basis of data from the Department of Transportation. See Department of Transportation, Build America Bureau, “Financed Projects and Applicants” (accessed October 21, 2021) https://go.usa.gov/xt2hX.
18. See Congressional Budget Office, Federal Support for Financing State and Local Transportation and Water Infrastructure (October 2018), www.cbo.gov/publication/54549.
This report, which is part of the Congressional Budget Office’s continuing effort to make its work transparent, explains how the federal government helps fund public transit in the United States. That federal funding is reflected in the agency’s baseline projections of spending. In keeping with CBO’s mandate to provide objective, impartial analysis, the report makes no recommendations.
Nathan Musick prepared the report with guidance from Joseph Kile. Sheila Campbell, John McClelland, Robert Reese, and Chad Shirley of CBO offered comments. Baruch Feigenbaum of the Reason Foundation and Kim Rueben of the Urban Institute commented on an earlier draft. The assistance of external reviewers implies no responsibility for the final product; that responsibility rests solely with CBO.
Mark Doms, Jeffrey Kling, and Robert Sunshine reviewed the report. Elizabeth Schwinn edited it, and Jorge Salazar created the graphics and prepared the text for publication. The report is available at www.cbo.gov/publications/57636.
CBO seeks feedback to make its work as useful as possible. Please send comments to communications@cbo.gov.

Phillip L. Swagel
Director