
At a Glance
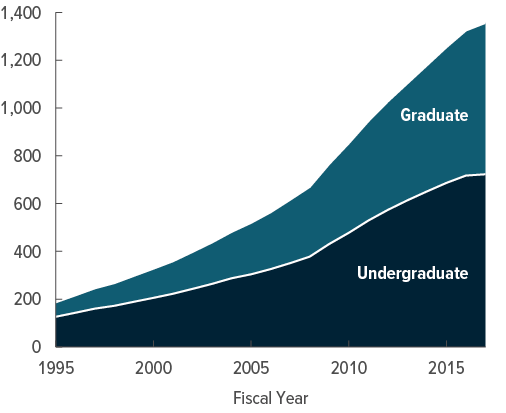
Between 1995 and 2017, the balance of outstanding federal student loan debt increased more than sevenfold, from $187 billion to $1.4 trillion (in 2017 dollars). In this report, the Congressional Budget Office examines factors that contributed to that growth, including changes to student loan policies and how they affected borrowing and repayment:
- Increases in the Number of Borrowers and the Average Size of Loans. The number of new loans issued per year more than doubled, and the size of the average loan increased—in part, because large increases in enrollment occurred at all types of schools, and the average tuition rose substantially.
- Changes in the Types of Schools Borrowers Attended. Much of the overall increase in borrowing occurred because the share of borrowers who attended for-profit schools increased substantially. Students who attended for-profit schools were more likely to leave school without completing their programs and to fare worse in the job market than students who attended other types of schools; they were also more likely to default on their loans.
- Increases in Defaults and Participation in Income-Driven Repayment Plans. The incidence of default and participation in income-driven repayment plans, which limit how much borrowers must repay regardless of how much they borrow, increased over the period. Both of those factors resulted in larger outstanding student loan balances.
- Changes in Loan Limits, Interest Rates, and Repayment Plans. Periodic changes to key parameters of student loan policy, such as borrowing limits, interest rates, and repayment plans, also affected the growth of federal student loan debt.
Notes
Notes
Unless this report indicates otherwise, the years referred to are federal fiscal years, which run from October 1 to September 30 and are designated by the calendar year in which they end. Some years are identified as academic years, which run from July 1 to June 30 and are also designated by the calendar year in which they end.
All loan amounts are expressed in 2017 dollars, unless otherwise indicated. To convert dollar amounts, the Congressional Budget Office used the price index for personal consumption expenditures from the Bureau of Economic Analysis.
CBO’s main source for historical information on disbursements, balances, and repayments was the National Student Loan Data System—the Department of Education’s central database for administering the federal student loan program. CBO analyzed longitudinal data for a random 4 percent sample from that data set, drawn at the end of 2017. Accordingly, numbers presented in this report may differ slightly from numbers reported by the Department of Education that are based on the complete set of administrative data.
In addition, although the Department of Education may not provide default rates for the same specific categories of borrowers that CBO analyzes in this report, CBO’s estimate of the average default rate is several percentage points higher than the default rates the Department of Education reports. That is probably the result of differences in the way CBO and the Department of Education define repayment cohorts.
Summary
The volume and number of federal student loans, which provide financing to make higher education more accessible, have grown over the past few decades. In 2017, the most recent year for which detailed information was available, $96 billion in new federal student loans was disbursed to 8.6 million students, compared with $36 billion (in 2017 dollars) disbursed to 4.1 million students in 1995.1 Between 1995 and 2017, the balance of outstanding federal student loan debt increased more than sevenfold, from $187 billion to $1.4 trillion (in 2017 dollars).
In this report, the Congressional Budget Office examines the factors that contributed to the growth in the volume of student loans and the effects of changes to student loan policy on borrowing and repayment. Because the report focuses on the period between 1995 and 2017, it does not cover the effects of the Coronavirus Aid, Relief, and Economic Security (CARES) Act, which was enacted on March 27, 2020.2
How Do the Federal Student Loan Programs Work?
Between 1995 and 2017, students could borrow through two major federal student loan programs, the Federal Family Education Loan (FFEL) program, which guaranteed loans issued by banks and other lenders through 2010, and the William D. Ford Federal Direct Loan program, through which the federal government has issued loans directly since 1994. The two programs operated in parallel through 2010, either guaranteeing or issuing loans to students under nearly identical terms and conditions.
The direct loan program continues to offer various types of loans and repayment plans. Loans are limited to a maximum amount (which differs by type of loan) and are extended at an interest rate specific to loan type and year. After borrowers finish their schooling, they repay their loans according to one of the available repayment plans. Required monthly payments are determined by the amount borrowed, the interest rate, and the repayment plan. Borrowers who consistently fail to make the required payments are considered to have defaulted on their loans, at which point the government or loan provider can try to recover the owed funds through other means, such as by garnishing wages. Under certain repayment plans, qualified borrowers can receive forgiveness of their remaining loan balance after a specific amount of time—10, 20, or 25 years.
Why Has the Volume of Student Loans Grown So Much Over Time?
The volume of student loans has grown because the number of borrowers increased, the average amount they borrowed increased, and the rate at which they repaid their loans slowed. Certain parameters of the student loans—in particular, borrowing limits, interest rates, and repayment plans—changed over time, which affected borrowing and repayment, but the largest drivers of that growth were factors outside of policymakers’ direct control. For example, total enrollment in postsecondary schooling and the average cost of tuition both increased substantially between 1995 and 2017.
Much of the overall increase in borrowing was the result of a disproportionate increase in the number of students who borrowed to attend for-profit schools. Total borrowing to attend for-profit schools increased substantially, from 9 percent of total student loan disbursements in 1995 to 14 percent in 2017. (For undergraduate students who borrowed to attend for-profit schools, the share grew from 11 percent to 16 percent; for graduate students, it grew from 2 percent to 12 percent.) Moreover, students who attended for-profit schools were more likely to leave school without completing their programs and to fare worse in the job market than students who attended other types of schools; they were also more likely to default on their loans.
How Have Changes in Student Loan Policies Affected Borrowing and Default?
The parameters of federal student loans available to borrowers have changed periodically, and those changes have affected trends in borrowing and default. Between 1995 and 2017, policymakers introduced new types of loans and repayment plans (some of which allow for loan forgiveness after a certain time) and adjusted the parameters of existing loan types and repayment plans. This report focuses on changes in loan parameters that are most relevant to borrowers—borrowing limits, interest rates, and repayment plans—and the consequences of those changes on borrowing and default.
- Borrowing Limits. Federal student loans are subject to borrowing limits. All loans are limited by the student’s expected cost of attending a school, but most loans have more stringent annual and lifetime borrowing limits. For example, since 2009, dependent undergraduate students have not been allowed to borrow more than $31,000 in federal student loans for all of their undergraduate schooling. Borrowers have responded to those loan limits; when the limits increased, they tended to borrow more, which also increased their required monthly payment. After accounting for the borrowers’ and schools’ characteristics, CBO found that larger monthly payments were associated with a slightly increased likelihood of default.
- Interest Rates. The interest rates on federal student loans varied considerably between 1995 and 2017. Until 2006, loans were issued with variable interest rates, which were indexed to a market interest rate and changed in step with that market rate from year to year. After 2006, loans were issued with fixed interest rates, which were set in the year of disbursement and then remained constant for the life of the loan.
Interest rates have had a small effect on the amount borrowed by graduate students, who were less restricted by borrowing limits than undergraduates. Higher rates were associated with a slight reduction in the amount of borrowing; lower rates were associated with a slight increase. For example, interest rates on student loans were lower during academic years 2014 to 2017 than they were from 2007 to 2013, slightly boosting graduate borrowing. Undergraduate borrowers did not appear to be sensitive to interest rates. After the borrowers’ and schools’ characteristics (such as the type or academic level of the school attended) were accounted for, higher monthly payments—which can result from higher interest rates—were associated with slightly higher rates of default.
- Repayment Plans. A borrower’s repayment plan, along with the amount borrowed and the interest rate, determines the monthly payment required on the loan. Under the standard repayment plan, loans are repaid over 10 years. A variety of alternative repayment plans are available. Some of those plans extend the repayment period to 25 or 30 years; others, called income-driven repayment (IDR) plans, tie required payments to borrowers’ incomes and provide loan forgiveness after a certain period. In the first few years after borrowers enter repayment, the required payments under IDR plans are often too small to cover the interest that accrues on the loan, which contributed to rising levels of debt.
CBO found that repayment plans that lowered a borrower’s monthly payments tended to decrease the incidence of default. Because borrowers select repayment plans after deciding how much to borrow, CBO did not estimate the effects of repayment plans on the amount students borrowed.
Types of Loans and Repayment Plans
There have been two major federal student loan programs. The first was the Federal Family Education Loan program, which guaranteed loans issued by banks and nonprofit lenders from 1965 to 2010. In 1994, the Congress established the William D. Ford Federal Direct Loan program, which issued student loans directly with funds provided by the Treasury. The two programs operated in parallel through academic year 2010, either guaranteeing or issuing loans to students under nearly identical terms and offering a variety of loan types and repayment options. Federal student loans generally have terms that are more favorable to borrowers than loans offered by private lenders.
The Health Care and Education Reconciliation Act of 2010 eliminated new FFEL loans. In its last year, the FFEL program guaranteed 80 percent of the new loans disbursed and accounted for about 70 percent of total outstanding balances. Since then, all new federal student loans have been made through the direct loan program.3 In 2020, direct loans accounted for about 80 percent of the outstanding loan balance.
Types of Loans
The direct loan program offers three types of loans: subsidized Stafford loans, unsubsidized Stafford loans, and PLUS loans. The loans vary by eligibility criteria, limits on the maximum size of the loans, and interest rates and rules about how interest accrues:
- Subsidized Stafford Loans. Available to undergraduate students with demonstrated financial need, subsidized Stafford loans have sometimes had lower interest rates than other types of loans. Most significantly, interest does not accrue on those loans during periods of schooling or when payments are deferred, for example, during periods of financial hardship or military service. The limits on how much students can borrow each academic year and for all their years of schooling are relatively low. In 2017, subsidized Stafford loans accounted for 23 percent of the total volume (in dollars) of all federal student loans disbursed and 38 percent of the total volume of federal student loans disbursed to undergraduates.
- Unsubsidized Stafford Loans. Available to both undergraduate and graduate students irrespective of their financial need, unsubsidized Stafford loans accrue interest even while the borrower is in school. The borrowing limits are higher for unsubsidized loans than for subsidized ones. In 2017, unsubsidized Stafford loans accounted for 53 percent of the total volume (in dollars) of federal student loans disbursed.
- PLUS Loans. These loans are available to graduate students and the parents of dependent undergraduate students. PLUS loans have generally had higher interest rates than Stafford loans and, like unsubsidized Stafford loans, accrue interest while the student is in school. Unlike Stafford loans, PLUS loans are limited only by the student’s cost of attending a school. They accounted for 24 percent of the total volume (in dollars) of federal student loans disbursed in 2017.
Repayment, Default, and Forgiveness
When borrowers finish their schooling, they are automatically assigned to the standard repayment plan, which amortizes the loan principal and accrued interest over a 10-year period. Other repayment plans, as well as various tools for pausing or reducing payments, are available and have expanded over time. For example, borrowers may select a graduated repayment plan or an IDR plan. In a graduated repayment plan, the required monthly payments increase over time, with the expectation that the borrower’s income will also increase over time. In IDR plans, borrowers’ payments are based on their incomes and may be as low as zero if their income falls below a certain threshold. After selecting a plan and beginning repayment, borrowers may apply for payment deferment or forbearance, which temporarily reduces or pauses their payments.4
Borrowers who miss a required monthly payment and have not obtained deferment or forbearance from their loan servicer are considered to be 30 days delinquent. Borrowers who continue to miss payments and become 270 days delinquent are declared by the government to have defaulted on their loans. When borrowers default, they lose eligibility for further federal aid until the default is resolved, and the default is reported to consumer credit reporting agencies.
Unlike balances on some other types of loans, the balance on a student loan is usually not discharged when the borrower declares bankruptcy. The government or its contractor is generally required to attempt to recover the loan balance through various means, such as by garnishing wages, withholding tax refunds or Social Security benefits, or pursuing civil litigation. Typically, through those means as well as through voluntary repayment of defaulted loans, the government ultimately recovers most of the remaining balance of loans that defaulted.
When borrowers do not pay enough to cover the interest on their loan—for example, when the required payment in an IDR plan is small, when they receive deferment or forbearance, or when they default—their loan balance increases. (For subsidized loans, deferment temporarily pauses interest accrual, so the balances of those loans do not grow during periods of deferment.) Of the borrowers who entered repayment in the five-year period between 2010 and 2014, 56 percent had their balance increase at some point between the time they entered repayment and 2017. Of the borrowers whose balance increased, 78 percent had received temporary deferment or forbearance, 44 percent had defaulted (including some who had also received deferment or forbearance), and 33 percent had selected an IDR plan.
Under certain circumstances, the government forgives some or all of borrowers’ outstanding loan balances. For example, borrowers who work in local, state, or federal government or nonprofit jobs for 10 years or who work as teachers in low-income areas for 5 years may have their loan balances forgiven. Borrowers in IDR plans may also qualify for forgiveness after making the required payments for a certain period of time, either 20 or 25 years.
Growth in the Volume of Federal Student Loans Over Time
The volume of outstanding federal student loan debt increased more than sevenfold between 1995 and 2017, from $187 billion to $1.4 trillion in 2017 dollars (see Figure 1). That growth was the result of an increase in the number of borrowers, an increase in the average amount they borrowed, and a decrease in the rate at which they repaid outstanding loans.
The trends in those variables were related to the type of school borrowers attended: selective, nonselective, for-profit, or two-year. Among both undergraduate and graduate borrowers, borrowing to attend for-profit schools had the highest percentage increase. Moreover, after finishing their schooling and entering repayment, borrowers who had attended for-profit schools were more likely to default on their federal student loans than borrowers who had attended other four-year schools, CBO found.
Components of Student Loan Debt
The total amount of student loan debt can be accounted for by trends in three variables: the number of borrowers, the average amount each borrowed, and the rate at which they repaid their loans.
Number of Borrowers. More people took out student loans over time: In 2017, 8.5 million people borrowed, compared with 4.4 million in 1995 (see Figure 2, top panel). That increase was partially the result of a 36 percent growth in enrollment in institutions of higher education over the period. Increased enrollment was driven by factors such as population growth, the economic return on a college or graduate degree, and general economic conditions.5 Demand for higher education has been cyclical: Enrollment and borrowing both increased sharply during and shortly after the 2007–2009 recession, when the job market was relatively weak, and then decreased afterward; the number of new borrowers peaked at 11.1 million in 2011.6
Figure 2.
Components of Total Outstanding Federal Student Loan Debt

The number of people who took out loans each year grew steadily through 2011.
The average amount borrowed also grew, particularly during the 2007–2009 recession and partly in relation to rising tuition levels over time.
The share of borrowers who defaulted within three years of first beginning repayment grew during and after the 2007–2009 recession. That increase in defaults also contributed to the increase in the total outstanding balance.
Source: Congressional Budget Office, using data from the Department of Education’s National Student Loan Data System.
Although the Department of Education does not provide separate default rates for undergraduate and graduate borrowers for each year, CBO’s estimate of the average default rate is several percentage points higher than the default rates the Department of Education reports. That is probably the result of differences in the way CBO and the Department of Education define repayment cohorts.
Average Amount Borrowed. Borrowers, on average, borrowed more in 2017 than in 1995 (see Figure 2, middle panel):
- Among graduate borrowers, the average amount borrowed each year grew by 47 percent, from about $17,400 (in 2017 dollars) in 1995 to $25,700 in 2017;
- For undergraduate borrowers, it grew by 10 percent, or from $6,500 to $7,200, over the same period; and
- For PLUS loans to parents, the average amount borrowed each year grew more—by 79 percent—from $9,300 in 1995 to $16,600 in 2017.
Much of that growth occurred between 2005 and 2009 for graduate borrowers and between 2007 and 2009 for undergraduate borrowers. Since then, the average amount borrowed has increased slightly for graduate borrowers and has declined for undergraduate borrowers; it has continued to rise for PLUS loans.
Tuition increased substantially between 1995 and 2017, and that increase put upward pressure on borrowing.7 (Some research indicates that the expansion of the federal student loan programs has induced colleges and universities to increase tuition. See Box 1.) For example, the average published in-state tuition—also known as the sticker price—for public, four-year undergraduate institutions increased by 120 percent (adjusted for inflation) over that period. The average published tuition for not-for-profit private institutions increased by 76 percent.8 The effective tuition—the price students paid, on average, after accounting for discounts—rose as well, though not as much as the sticker price. Average borrowing per year also increased but by much less, probably in part because undergraduate borrowers were constrained by annual loan limits.
Box 1.
Did the Expansion of the Federal Student Loan Programs Lead to Increases in Tuition?
As the volume of student loans increased between 1995 and 2017, the tuition that colleges charged also increased. Moreover, it was not just the sticker price of tuition that increased; the average tuition that students paid after accounting for student aid such as grants and tax credits also rose, although at a slower rate.1
Rising tuition increases the amount that students borrow. But the effects may go in the other direction as well: The increase in students’ ability to borrow may have induced colleges to increase their tuition. The idea that student loan availability causes higher tuition is referred to as the Bennett hypothesis, named after former Secretary of Education William Bennett, who publicly formulated the idea in 1987.
Various factors have pushed up tuition over time. The cost of the services that colleges and universities provide has increased, driven in part by increases in the cost of employing faculty and staff. At the same time, support from states and localities has decreased, which has particularly affected public colleges and universities. During and after the 2007–2009 recession, for example, at those schools the average funding per student from state and local governments fell and tuition increased sharply. Later, as that funding increased, the tuition growth rate slowed.2
Until recently, the existing empirical evidence did not clearly show that increased borrowing through federal student loans contributed to the tuition increases. However, new research indicates that it played a role in increasing tuition for undergraduate programs.3 Economists have estimated the extent to which expanding student loan availability contributed to colleges’ and universities’ ability to charge higher prices for the same services. To do that, economists studied periods in which students’ or parents’ ability to borrow for school changed sharply.
For example, David Lucca and coauthors studied the effects of increases in loan limits for subsidized and unsubsidized Stafford loans in academic years 2008 and 2009 on tuition for undergraduate programs. They estimated that schools accepting students with those types of loans increased their sticker price tuition between 20 cents and 60 cents for each dollar the loan limits increased and that the net price students paid after accounting for discounts also increased.4
Mahyar Kargar and William Mann studied the tightening, in 2011, of eligibility criteria for PLUS loans available to parents of undergraduate students. Many parents who had been eligible before the change were no longer eligible. The economists looked at the schools’ response to that reduction in available credit and found that schools that were more affected by the change raised their tuition less than other schools and received less revenue per student than other schools. Those findings indicate that the increased availability of financial aid led, at least in part, to tuition increases.5
1. The average net price paid for students to attend two-year public colleges declined over the period in real (inflation-adjusted) terms, but net tuition increased for students at four-year public and private not-for-profit colleges and universities and at for-profit colleges and universities. See College Board, Trends in College Pricing and Student Aid 2020 (College Board, 2020), https://tinyurl.com/yxp45soq.
2. Ibid.
3. Increases in ability to borrow through federal student loan programs do not appear to have increased tuition at law schools, business schools, or medical schools. See Robert Kelchen, “An Empirical Examination of the Bennett Hypothesis in Law School Prices,” Economics of Education Review, vol. 73 (December 2019), pp. 1–26, https://doi.org/10.1016/j.econedurev.2019.101915, and “Does the Bennett Hypothesis Hold in Professional Education? An Empirical Analysis,” Research in Higher Education, vol. 61 (April 2019), pp. 357–382, https://tinyurl.com/y3e8ebl9.
4. David O. Lucca, Taylor Nadauld, and Karen Shen, “Credit Supply and the Rise in College Tuition: Evidence From the Expansion in Federal Student Aid Programs,” Review of Financial Studies, vol. 32, no. 2 (February 2019), pp. 423–466, https://doi.org/10.1093/rfs/hhy069.
5. Mahyar Kargar and William Mann, “Student Loans, Marginal Costs, and Markups: Estimates From the PLUS Program” (draft, February 7, 2018), http://dx.doi.org/10.2139/ssrn.2814842.
An increase in borrowing and the resulting increase in the balance of outstanding federal student loan debt do not necessarily increase the federal budget deficit or financially imperil the borrowers. For example, in its March 2020 baseline budget projections, CBO projected that, under current law, student loans issued between 2021 and 2030 would result in savings for the government.9 The program is projected to lower the deficit because the government has set the interest rates on student loans above the rates at which the Treasury borrows to fund the loans. That difference in interest rates causes the present value—or current dollar amount—of borrowers’ payments to be greater than the present value of the cost to the government to disburse the loans (even though some borrowers default).
In CBO’s March 2020 baseline budget projections, two types of loans were estimated to result in costs to the federal government: subsidized loans and PLUS loans to graduate students. For subsidized loans, interest does not accrue while the borrower is in school, which lowers the amount that borrowers will be required to pay back. For PLUS loans to graduate students, repayments are projected to be lower because many of the borrowers of those loans select IDR plans, in which the payment amount is determined by the borrower’s income rather than by the amount borrowed. Under those plans, unpaid balances are forgiven once the requirements are met, which lowers the amount that is expected to be paid back.
Many borrowers would be better off financially in the long run, even with the burden of debt repayments, if their loans enabled them to obtain education that enhanced their productivity and increased their future earnings. The economics literature, which has a long history of studying the return on schooling, generally finds a substantial benefit to obtaining a college degree.10
Repayment and Default. The prevalence of default has changed over time and is greater for undergraduate borrowers than for graduate borrowers (see Figure 2, bottom panel). The three-year default rate—the share of borrowers who default within three years of first entering repayment—increased between the 2005 and 2010 cohorts, from 2 percent to 7 percent for graduate borrowers and from 15 percent to 28 percent for undergraduate borrowers, before starting to decline to 6 percent for graduate borrowers and 21 percent for undergraduate borrowers in the 2015 cohort.11 The default rate on PLUS loans to parents was similar to that for graduate students but 1.7 percentage points higher, on average, over the 1995–2015 period. (Repayment cohorts are groups of people who began repaying their loans in the same year; the 2015 cohort is the most recent group for which three years of subsequent data were available.)
Some of the increase in the default rate between the 2005 and 2010 cohorts was related to the increased share of borrowers at for-profit and two-year schools. Students who attended those types of schools were about half as likely to complete their programs and less likely to do well in the job market than students at other types of schools. As a result, they may have had more difficulty paying back their loans.12
The 2007–2009 recession and the ensuing slow recovery were also factors. During that time, unemployment was relatively high, and many borrowers had reduced incomes that affected their ability to make payments. Moreover, graduation rates tend to be lower during and immediately after recessions, and those low rates are also associated with increased default.13
Differences in Borrowing and Repayment at Different Types of Schools
The amount of borrowing and the rate of repayment varied with the type of school borrowers attended. For this report, CBO grouped schools into four categories: public or not-for-profit private schools that are selective; public or not-for-profit private schools that are not selective; for-profit schools; and, for undergraduate borrowers only, public or private not-for-profit two-year schools. Nonselective schools are those that have open enrollment, typically requiring just a high school diploma, a GED certificate, or the passage of an admissions test designed to indicate whether potential students could benefit from postsecondary schooling.14
Borrowing grew disproportionately in some types of schools. Although borrowing to attend selective schools grew the most in total dollar amounts, borrowing to attend for-profit and two-year schools increased the most as a percentage of total disbursements (see Figure 3):
Figure 3.
Total Borrowing, by Academic Level and School Type

For each type of school, total borrowing generally increased between 1995 and 2012. Growth was especially sharp starting in 2007, primarily for reasons related to the 2007–2009 recession. Starting in 2012, borrowing began to decline back toward its prerecession level.
As a share of total borrowing, the growth in borrowing by students attending for-profit schools was especially large.
Source: Congressional Budget Office, using data from the Department of Education’s National Student Loan Data System.
Selective and nonselective institutions include public schools and not-for-profit private schools. For-profit institutions include any type of for-profit school. Two-year institutions include two-year undergraduate schools.
School selectivity is based on the 2008 Barron’s Admissions Competitiveness Index, provided by the National Center for Education Statistics.
- Among undergraduates, borrowing for selective schools increased from $19 billion in 1995 to $38 billion in 2017. As a share of total borrowing by undergraduates, however, borrowing to attend selective schools decreased from 73 percent to 65 percent.
- Undergraduate borrowing to attend for-profit schools increased from $3 billion in 1995 to $9 billion in 2017, or from 11 percent to 16 percent of the total disbursements to undergraduate borrowers.
- Borrowing for two-year schools more than doubled, from $2 billion in 1995 to $5 billion in 2017, increasing from 7 percent to 9 percent of total disbursements to undergraduate borrowers.
- Among graduate borrowers, borrowing for all school types also increased; the most growth occurred in borrowing for selective schools.
- Relative growth among graduate borrowers was also greatest for those who borrowed to attend for-profit institutions; that borrowing grew from 2 percent of total annual disbursements to graduate students in 1995 to 12 percent in 2017.
On average, borrowers who attended certain types of schools were more likely to default than borrowers who attended other types of schools (see Figure 4). Undergraduates who borrowed to attend for-profit schools, nonselective schools, or two-year schools defaulted at higher rates than graduate borrowers. For example, among borrowers who entered repayment in 2015, undergraduate borrowers who attended for-profit schools had a three-year default rate of 26 percent, whereas the rates for undergraduate and graduate borrowers who attended selective schools were 10 percent and 4 percent, respectively. The increased likelihood of default exhibited by borrowers who attended for-profit undergraduate schools was related to lower family income before attending school as well as a greater likelihood of not graduating.15
Figure 4.
Three-Year Default Rates, by Academic Level and School Type
Percent

Students who borrowed to attend for-profit schools and two-year schools were more likely to stop repaying their loans than other borrowers.
Source: Congressional Budget Office, using data from the Department of Education’s National Student Loan Data System.
Three-year default occurs when a borrower defaults within the first three years after the beginning of the fiscal year in which the borrower enters repayment.
Although the Department of Education does not provide separate default rates by type of school for each year, CBO’s estimate of the average default rate is several percentage points higher than the default rates the Department of Education reports. That is probably the result of differences in the way CBO and the Department of Education define repayment cohorts.
School selectivity is based on the 2008 Barron’s Admissions Competitiveness Index, provided by the National Center for Education Statistics.
Effects of Policy Changes on Borrowing and Repayment
Since 1995, policymakers have changed the parameters of the loans offered under the former Federal Family Education Loan program and the current direct loan program, and those changes have affected borrowing and repayment to varying degrees. Loan limits have been increased, interest rates substantially changed, and new repayment plans offered. In academic years 2008 and 2009, for example, newly legislated limits allowed students to increase the amount they borrowed. Between 2009 and 2015, policymakers introduced new repayment plans that tied payments to borrowers’ incomes and that provided loan forgiveness if certain criteria were met.
Estimating the Effects of Changes in Loan Parameters
It is challenging to identify the precise effect of changes in loan parameters on borrowing and repayment. That is because when loan parameters change, other factors outside of policymakers’ direct control may also change, and it is difficult to know which share of the changes in borrowing or repayment resulted from the change in loan parameters and which resulted from changes in other factors.
To estimate the effect of changes in loan parameters, CBO studied loans during specific periods when those parameters changed and other factors were relatively stable or when it could use statistical methods to control for changes in other factors. In that way, CBO estimated changes in borrowing and repayment that resulted directly from changes in three loan parameters—loan limits, interest rates, and repayment and loan forgiveness plans—and separated those effects from the effects of changes in factors outside of policymakers’ direct control.
Loan Limits
Federal student loan programs place limits on how much students can borrow. There are limits on how much a student can borrow for a single semester as well as limits on the total amount of all the loans the student receives. No loan may exceed the cost of attendance—minus any other aid the student may have received—at the school where the student is enrolled. (The cost of attendance is provided by each institution and is based on the costs of tuition, room and board, textbooks, and other related materials and fees.) But most loans for undergraduates are subject to additional limits that are often well below the cost of attendance for most schools. Those other limits depend on the borrower’s academic level and whether the borrower is dependent or independent.16 Over time, policymakers have changed the limits on how much students can borrow.
Borrowers have tended to respond to those limits. Many borrowed the full amount allowed and increased their borrowing in step with increases in the limits. That tendency suggests that borrowers value the ability to borrow through federal student loan programs and that higher loan limits facilitate borrowers’ ability to obtain higher education. At the same time, higher loan limits allow borrowers to take on more debt and, for some, increase their likelihood of eventually defaulting on their loans. Accordingly, policymakers may face a tradeoff when setting loan limits: Increasing the limits expands access to higher education but also may increase the risk of default for some borrowers.17
Historical Limits. Loan limits have generally increased with academic level. For both subsidized and unsubsidized loans for undergraduate students, the limit for second-year students has been higher than that for first-year students, and the limit for more-advanced undergraduate students has been higher still (see Table 1). PLUS loans, which are available to graduate students and parents of undergraduate students, have been limited only by the cost of attendance; some of those loans are well over $30,000. A student’s dependency status also affects loan limits for undergraduates; independent students have higher limits.

Loan limits remained the same from 1995 until policymakers changed them in academic years 2008 and 2009. In 2008, the limits increased by $875 for first-year students and $1,000 for second-year students. In 2009, the limits increased by an additional $2,000 for students at all levels. Limits have not changed since then.
Effects of Limits on Borrowing and Defaults. Loan limits appear to restrict how much students borrow. For every year between 1995 and 2017, roughly half of borrowers who took out Stafford loans (which had annual limits at levels that were specified by statute) borrowed at or near the limit. Moreover, when limits increased, borrowing increased. For example, in the years immediately following the two separate increases in borrowing limits for undergraduates in academic years 2008 and 2009—the only two substantial limit increases between 1995 and 2017—borrowing for undergraduate studies increased sharply (see Figure 5). Additionally, independent borrowers, who have had higher limits than dependent borrowers, tended to borrow more.

Determining the exact effect of increases in loan limits on borrowing can be difficult because other factors also changed when loan limits increased. For example, the loan limit increases in academic years 2008 and 2009 occurred just before and in the middle of the 2007–2009 recession, a time when the job market, school enrollment, and tuition changed substantially. Therefore, the extent to which changes in borrowing resulted from changes in loan limits versus changes in other factors is not immediately clear.
To isolate the effect of loan limits on borrowing from the effects of other factors, CBO studied undergraduate borrowers who were close to age 24, the age at which borrowers are considered independent and therefore subject to higher borrowing limits for unsubsidized loans.18 By comparing borrowers who were approaching their 24th birthday, and therefore were subject to relatively low borrowing limits, with similar borrowers who had just passed their 24th birthday, and therefore were subject to relatively high borrowing limits, CBO estimated that a $1,000 increase in loan limits for those borrowers was associated with an increase in borrowing of $400 to $500.
To the extent that higher limits were linked to more borrowing, increases in loan limits were also related to slightly increased default rates. Under most repayment plans, including the standard repayment plan to which borrowers were automatically assigned, larger initial loans led to higher monthly loan payments. All else being equal, higher monthly payments are more difficult for borrowers to pay, making default more likely. (Under IDR plans, the required monthly payment is usually determined by the borrower’s income, although the total amount borrowed determines the maximum possible payment for most of those plans. Therefore, under IDR plans the link between higher borrowing limits and higher default rates is weaker.)
Much of the change in overall default rates is accounted for by other factors that are not directly related to the increase in the borrowing limits. Indeed, the average default rate was increasing even before the loan limits increased (see Figure 4). Other factors that affect default include changes in the types of schools borrowers attend and changes in the job market at the time of the limit increase.19 For example, over time, a larger share of borrowers attended for-profit schools and two-year undergraduate schools. Those borrowers were less likely to complete their academic programs, thereby reducing the financial benefit of their attendance. On average, they had higher default rates than borrowers who attended other types of schools.20
CBO assessed the effect on default rates of higher borrowing limits using the same strategy of studying undergraduate borrowers who took out unsubsidized loans just before or just after their 24th birthday. After adjusting for the borrowers’ and schools’ characteristics, CBO estimated that the increased borrowing limit was associated with a slightly greater incidence of default: For the studied group of borrowers, a $1,000 increase in borrowing led to a 1 percentage-point increase in defaults.
Interest Rates
Along with the amount borrowed and the repayment plan, interest rates determined the monthly loan payment in fixed repayment plans and so were related to whether students chose to borrow, how much they borrowed, and their likelihood of default. Different interest rates could have a large effect on the monthly payment. Other things being equal, higher interest rates increased the amount borrowers needed to pay and, as a result, increased the likelihood of default.
Interest Rates Over Time. Interest rates on student loans are set by law and have changed over time and varied by type of loan (see Table 2).

- Between academic years 1995 and 2006, loans were issued with variable interest rates. The interest rate for those loans changed each year according to a formula that indexed it to the rate for 3-month Treasury bills.
- Since the 2007 academic year, loans have been issued with fixed interest rates, meaning that the interest rate remains constant for the life of the loan. Between academic years 2007 and 2013, fixed interest rates on unsubsidized loans for undergraduates were set by statute at 6.8 percent. Interest rates on subsidized loans were adjusted annually.
- Starting in academic year 2014, the rates were set to equal the rate on 10-year Treasury notes plus a fixed premium; the rate for undergraduate Stafford loans was the 10-year rate plus 2.05 percentage points.21
For unsubsidized Stafford loans for undergraduates between 1995 and 2017, the rates at the time of origination ranged between 3.4 percent and 8.25 percent; in academic year 2017 the interest rate was 4.45 percent (see Figure 6). Accordingly, the monthly payment under the standard repayment plan for an initial loan balance of $10,000 ranged between $98 and $123; in 2017 it was about $103.

In many years, the interest rates for loans for undergraduate borrowers were lower than those for graduate borrowers, although the rates were the same in some years. Throughout the period, borrowers had the option to consolidate multiple outstanding loans into a single loan with a fixed interest rate.
Interest Rate Changes With Consolidation Loans. Consolidation loans gave borrowers a way to potentially lower their future loan payments. However, consolidation generally did not reduce the payments borrowers were required to make over the lifetime of their loans.
Consolidation loans allowed borrowers with multiple outstanding loans to combine their loans into a single loan with a fixed interest rate and also gave them the option of changing the duration of the repayment period. The single interest rate was determined as the average interest rate on the multiple loans in the year of consolidation, rounded up to the nearest eighth of a percentage point.
For borrowers who had outstanding variable-rate loans, consolidation was a means of potentially lowering future payments by replacing their variable payments with a single fixed rate that was set at the time of consolidation. For example, consider a hypothetical borrower with $10,000 of variable-rate loans issued in 2006 who entered repayment in 2007. If the borrower consolidated those loans in 2007, when interest rates were relatively high, the borrower would have regular monthly payments of $117. A borrower who consolidated in 2010, however, when rates were relatively low, would have monthly payments of only $94. (The difference in total payments between those two scenarios is $2,750 over the life of the loan.) A well-timed consolidation could set payments at a lower amount, reducing the likelihood of default.
In practice, most borrowers who consolidated did not do so at times when interest rates were lowest. On the contrary, the most common years to consolidate were academic years 2006 and 2007, before interest rates declined in response to the 2007–2009 recession. Perhaps borrowers valued the ability to extend the duration of their repayment plan and simplify their loan payments more than they valued the ability to lower their interest rate. Or perhaps those who consolidated at that time incorrectly believed that interest rates would rise.
Effects of Interest Rates on Borrowing and Defaults. As with changes in loan limits, it is challenging to isolate the effect of changes in interest rates on borrowing and defaults, because when interest rates change, other factors often change, too.
CBO estimated the relationship between interest rates at the time of loan origination and the amount people borrowed by statistically controlling for differences in borrowers’ characteristics over time. Changes in interest rates at the time of loan origination had a limited association with the amount people borrowed for undergraduate studies but had a small effect on the amount people borrowed for graduate studies. Using data on loans taken out during academic years 2000 through 2017, CBO estimated that a 1 percentage-point increase in interest rates at the time of loan origination was associated with a negligible decrease in the loan amount for undergraduate borrowers.
For graduate borrowers, whose average loan amount between 2000 and 2017 was about $11,000, a 1 percentage-point increase in interest rates was associated with a $150 decrease in the loan amount; a decrease in interest rates had the opposite effect. Interest rates at the time of loan origination on loans to graduate students have fallen in recent years, contributing slightly to increased borrowing: Between academic years 2007 and 2013, the average interest rate on loans to graduate students was 7 percent; between 2014 and 2017, the average interest rate was 5.9 percent. Graduate borrowers may be more sensitive to interest rates than undergraduate borrowers because graduate borrowers have higher loan limits, giving them more flexibility to adjust their borrowing.
Interest rates could affect the probability of default because of their effect on monthly payments. The average interest rate (the weighted average of the interest rate on outstanding loan balances) and the three-year default rate varied by repayment cohort (see Figure 7). On average, higher interest rates were associated with slightly higher default rates; that relationship was stronger for undergraduates than for graduates. Those associations should not be interpreted as causal, however, because other factors in addition to interest rates were changing. The 2009–2015 repayment cohorts had higher default rates because those borrowers began repaying their loans after the 2007–2009 recession, when many borrowers were unemployed after graduation. The change to fixed, rather than variable, interest rates on loans disbursed during and after 2007 may also have contributed to higher default rates. Interest rates on those loans would have been much lower under the variable-rate policy, lowering borrowers’ monthly payments.
Figure 7.
Average Interest Rates and Three-Year Default Rates, by Repayment Cohort
Percent
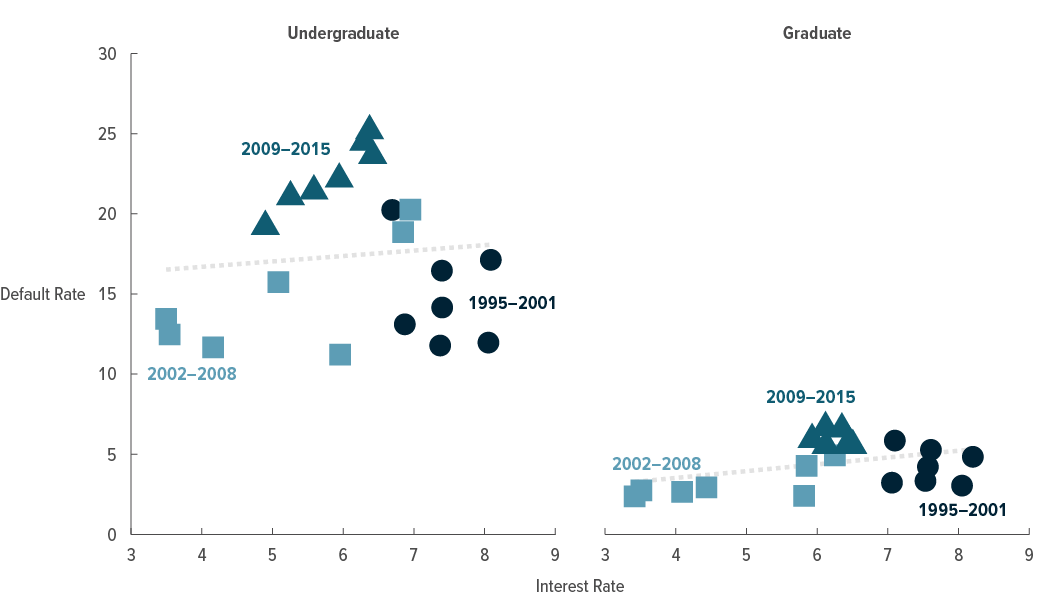
Source: Congressional Budget Office, using data from the Department of Education’s National Student Loan Data System.
The dotted lines show the predictions of a regression of the default rate on the interest rate.
Although the Department of Education does not provide separate default rates for undergraduate and graduate borrowers for each year, CBO’s estimate of the average default rate is several percentage points higher than the default rates the Department of Education reports. That is probably the result of differences in the way CBO and the Department of Education define repayment cohorts.
Repayment Plans and Loan Forgiveness
The repayment plan is the third parameter that, along with the amount borrowed and the interest rate, determines how much a borrower must pay each month.
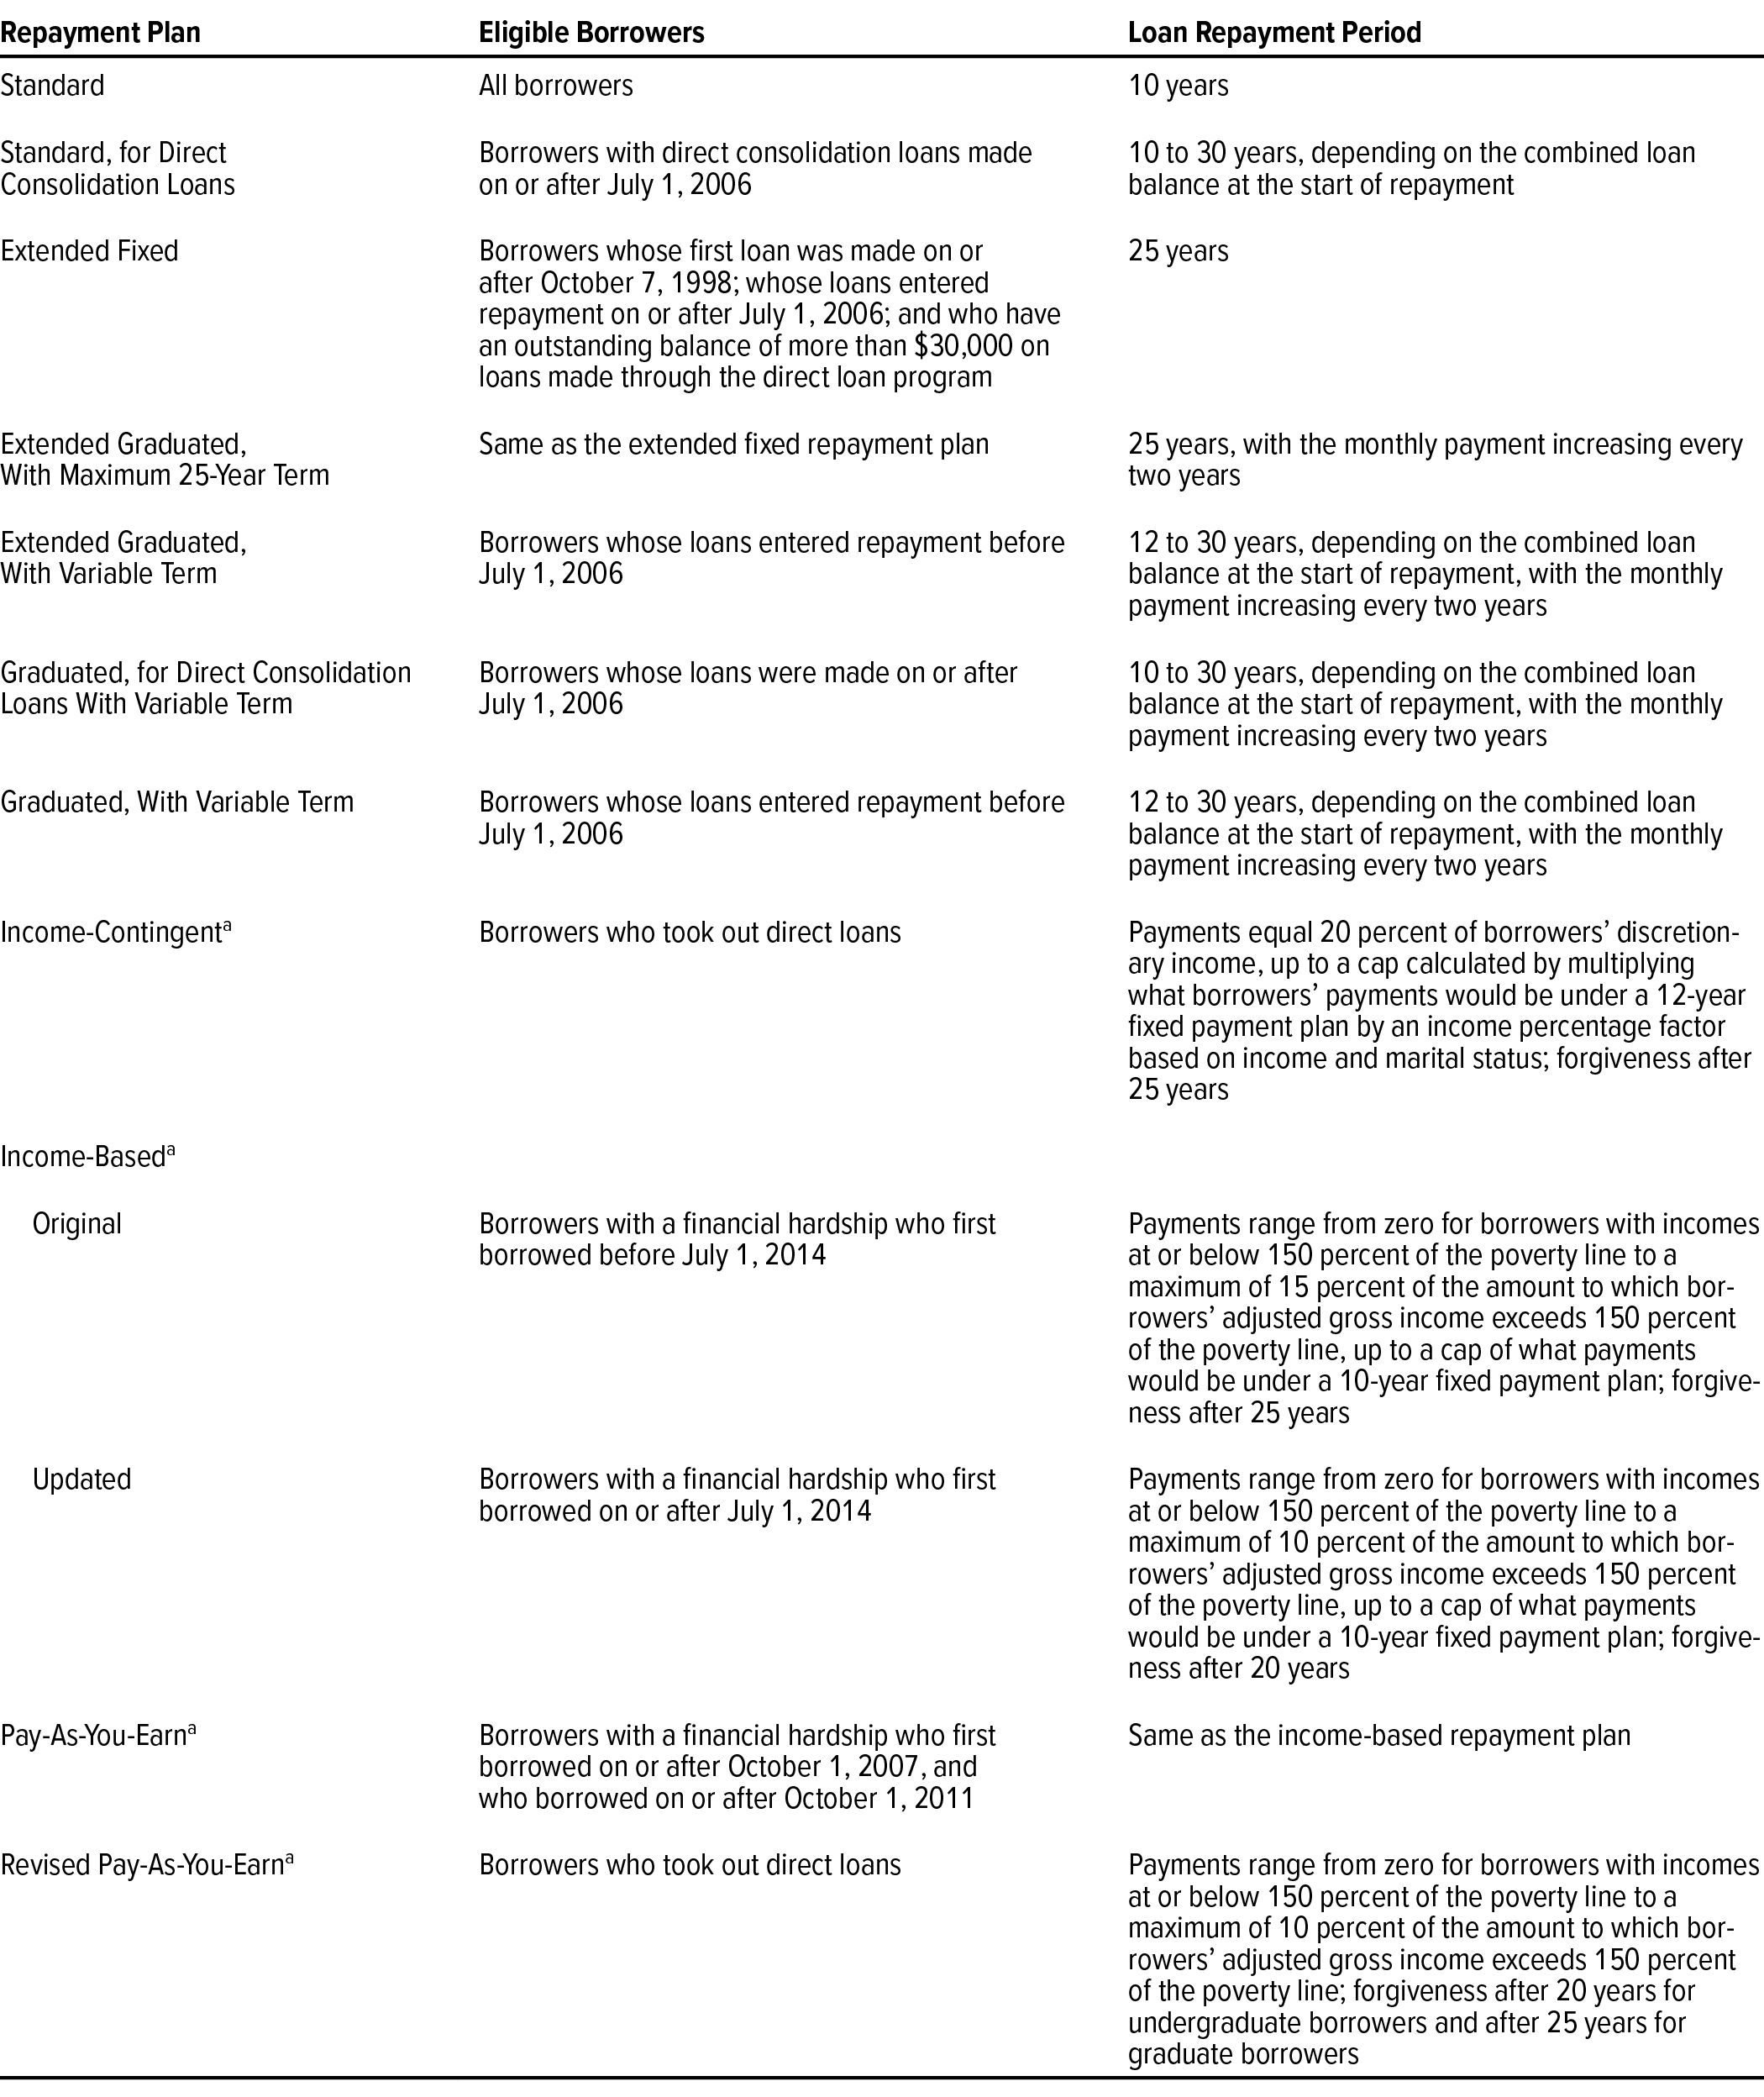
Changes in Repayment Plans Over Time. Four broad types of repayment plans have been available to borrowers over time: standard, extended, graduated, and IDR (see Table 3). Some repayment plans have certain eligibility criteria. Borrowers may freely choose to change their repayment plan at any point after entering repayment.
Through 2010, most student loan borrowers repaid their loans using the standard repayment plan to which they were automatically assigned. Under the standard plan, they made fixed monthly payments for 10 years.
Since 2010, a growing number of borrowers have elected to repay their loans using IDR plans. Among borrowers who took out direct loans for undergraduate study, the share enrolled in IDR plans grew from 11 percent to 24 percent between 2010 and 2017; among those who took out loans for graduate study, the share grew from 6 percent to 39 percent. Required repayments in such plans depend not only on the loan balance and interest rate but also on the borrower’s income. On average, borrowers in income-driven plans have larger outstanding balances and make smaller monthly payments—relative to the size of their loans—than other borrowers. IDR plans provide loan forgiveness if borrowers have not paid off their balance after making payments for a certain number of years.
Effects of Repayment Plans. The choice of repayment plan could affect the amount borrowed and borrowers’ likelihood of default. That relationship is probably clearest for IDR plans, which limit how much borrowers have to repay on the basis of their income. In effect, relative to the standard repayment plan, IDR plans shifted some of the risk of investing in education from the borrower to the federal government. Because borrowers faced less risk with IDR plans, they may have chosen to make riskier educational investments or borrowed more than they otherwise would have.
Borrowers who selected IDR plans were less likely to default than borrowers with other repayment plans. That may be because IDR plans are structured so that the required monthly payments are affordable to borrowers with low or no earnings. For borrowers with higher earnings, payments are usually not larger than they would have been under the standard plan. Forgiveness is ultimately offered after a set period of time for borrowers who may not have been able to fully repay their loans, which gives them more incentive to continue making their loan payments.22
Lower monthly payments under IDR plans contributed to the growth of debt by slowing the rate at which the loans are paid off. Most borrowers repaying through an IDR plan have loan balances that grow during the years after they enter repayment because the payments are smaller than the interest that accrues on the loan. Eventually, the loan forgiveness that borrowers in IDR plans may obtain will reduce the amount of outstanding student loan debt. Much of that forgiveness will not occur until after 2030, however, when some borrowers will have made payments for 20 to 25 years and thereby will have qualified for forgiveness.
Aside from such IDR plans, the effect of the choice of other repayment plans on borrowing and default was not always clear because of potentially counteracting forces. A borrower with a given loan balance and a fixed interest rate would have smaller payments under a longer repayment plan. But the borrower would have to make the payments for a longer period, thus increasing the total cost of the loan to the borrower. Moreover, because borrowers had some flexibility in choosing plans, it is difficult to attribute differences among borrowers in borrowing and default to the variations in repayment plans because those differences could have been driven by other factors. For example, if borrowers who chose longer repayment plans tended to become higher earners than those who chose shorter plans, it is not clear if differences in the amounts borrowed or the likelihood of default were the result of the repayment plan itself or the result of differences in the borrowers’ other characteristics.
Despite those challenges, some evidence indicated that longer repayment plans with lower monthly payments tended to reduce the likelihood of default. CBO studied the likelihood of default for borrowers with balances just below and just above $30,000. Borrowers with balances larger than $30,000 qualified for the extended repayment plan, thereby lowering their required monthly payments, whereas borrowers with balances just under $30,000 did not qualify for the extended repayment plan. Comparing those two groups, CBO found that borrowers with extended repayment plans were about half as likely to default on their loans or to obtain a deferment for reasons of economic hardship.
1. In 2019, the Department of Education disbursed $88 billion (in 2017 dollars) in new student loans.
2. Several provisions of the CARES Act directly affected federal student loans held by the Department of Education. One provision temporarily suspended required payments through September 30, 2020. Another provision waived interest accrual on outstanding loans during that period.
3. For additional information about postsecondary aid, see Congressional Budget Office, Federal Aid for Postsecondary Students (June 2018), www.cbo.gov/publication/53736, and Distribution of Federal Support for Students Pursuing Higher Education in 2016 (June 2018), www.cbo.gov/publication/53732.
4. Deferment and forbearance are temporary periods during which loan payment obligations are suspended. Borrowers may receive applicable interest subsidies during deferment but not during forbearance. Deferment may be granted for a number of reasons, including during periods of schooling or training, unemployment, financial hardship, or military service. Forbearance may be granted during periods when borrowers may be unable to make their required payments. For more information, see Department of Education, Federal Student Aid, “Get Temporary Relief” (accessed October 13, 2020), https://go.usa.gov/x7TUk.
5. See, for example, Jaison R. Abel and Richard Deitz, “Do the Benefits of College Still Outweigh the Costs?” Current Issues in Economics and Finance, Federal Reserve Bank of New York, vol. 20, no. 3 (2014), https://tinyurl.com/z2u8xxd. The authors establish that the economic return on a bachelor’s degree grew substantially between 1995 and 2001, when the return leveled off, before starting to decline in 2010. That increase in the return on a college education takes into account the increase in the cost of college to students.
6. See, for example, Andrew Barr and Sarah Turner, “Out of Work and Into School: Labor Market Policies and College Enrollment During the Great Recession,” Journal of Public Economics, vol. 124 (April 2015), pp. 63–73, https://tinyurl.com/y4ha2qz3, which documents enrollment increases during the 2007–2009 recession.
7. See Zachary Bleemer and others, Echoes of Rising Tuition in Students’ Borrowing, Educational Attainment, and Homeownership in Post-Recession America, Staff Report 820 (Federal Reserve Bank of New York, July 2017), https://ssrn.com/abstract=3003050. In their sample, the increase in public college tuition between 2001 and 2009 accounted for a 30 percent increase in the average student debt of 24-year-olds between 2003 and 2011.
8. See Trends in College Pricing and Student Aid 2020 (College Board, 2020), https://tinyurl.com/yxp45soq.
9. See Congressional Budget Office, “Student Loan Programs—CBO’s Baseline as of March 6, 2020” (March 2020), https://go.usa.gov/x7KxB (PDF, 524 KB). Budgetary estimates for the student loan program are made following procedures specified by the Federal Credit Reform Act of 1990. For a more detailed discussion of those procedures, see Congressional Budget Office, Income-Driven Repayment Plans for Student Loans: Budgetary Costs and Policy Options (February 2020), pp. 19–21, 35–36, www.cbo.gov/publication/55968.
10. See, for example, Douglas A. Webber, “Are College Costs Worth It? How Ability, Major, and Debt Affect the Returns to Schooling,” Economics of Education Review, vol. 53 (August 2016), pp. 296–310, https://tinyurl.com/y7b7e4sp.
11. Although the Department of Education does not provide separate default rates by school type for each year, CBO’s estimate of the average default rates is several percentage points higher than the default rates the Department of Education produces. That is probably the result of differences in the way CBO and the Department of Education define repayment cohorts.
12. See David Deming, Claudia Goldin, and Lawrence Katz, “For-Profit Colleges,” The Future of Children, vol. 23, no. 1 (Spring 2013), pp. 137–163, https://muse.jhu.edu/article/508224; and Bill Hussar and others, The Condition of Education 2020 (National Center for Education Statistics, May 2020), https://nces.ed.gov/programs/coe.
13. See Doug Shapiro and others, Completing College: A State-Level View of Student Attainment Rates, Signature Report 6a (National Student Clearinghouse Research Center, March 2014), https://tinyurl.com/y77jkgm5.
14. CBO based those rankings on the 2008 Barron’s Admissions Competitiveness Index, provided by the National Center for Education Statistics.
15. See Adam Looney and Constantine Yannelis, “A Crisis in Student Loans? How Changes in the Characteristics of Borrowers and in the Institutions They Attended Contributed to Rising Loan Defaults,” Brookings Papers on Economic Activity (Fall 2015), pp. 1–89, https://tinyurl.com/yadlgg6t.
16. A student is considered independent if he or she is at least 24 years old, married, a graduate or professional student, a veteran, a member of the armed forces, an orphan, a ward of the court, someone with legal dependents other than a spouse, an emancipated minor, or someone who is experiencing or is at risk of experiencing homelessness.
17. The government can recover most of the outstanding balance of loans that default—for example, by garnishing wages, tax refunds, or social security payments—so the effect of such an increase in defaults on the program’s subsidy rate would probably be small.
18. For unsubsidized loans, limits for independent freshmen and sophomores are $4,000 higher than the limits for dependent freshmen and sophomores. Loan limits for independent juniors and seniors are $5,000 higher than the limits for dependent juniors and seniors.
19. By itself, more borrowing is not necessarily associated with a greater likelihood of default. For example, people who enroll in graduate programs at public or not-for-profit private schools tend to borrow more than those who attend for-profit undergraduate programs. Despite their greater borrowing, they are much less likely to default.
20. See Adam Looney and Constantine Yannelis, “A Crisis in Student Loans? How Changes in the Characteristics of Borrowers and in the Institutions They Attended Contributed to Rising Loan Defaults,” Brookings Papers on Economic Activity (Fall 2015), pp. 1–89, https://tinyurl.com/yadlgg6t.
21. Interest rates are based on the highest yield of the 10-year Treasury notes sold in the last auction before June 1 of the previous academic year.
22. For a detailed analysis of IDR plans, see Congressional Budget Office, Income-Driven Repayment Plans for Student Loans: Budgetary Costs and Policy Options (February 2020), www.cbo.gov/publication/55968; and Daniel Herbst, “Liquidity and Insurance in Student-Loan Contracts: The Effects of Income-Driven Repayment on Borrower Outcomes” (draft, University of Arizona, May 2020), https://djh1202.github.io/website/IDR.pdf (2.9 MB).
About This Document
This report was prepared at the request of the Chairman of the Senate Committee on the Budget and the Chairman of the Senate Committee on Health, Education, Labor, and Pensions. In keeping with the Congressional Budget Office’s mandate to provide objective, impartial analysis, the report makes no recommendations.
David Burk (formerly of CBO) and Jeffrey Perry wrote the report with guidance from Sebastien Gay. Michael Falkenheim, Delaney Smith, and Constantine Yannelis (a visiting scholar from the University of Chicago) also contributed to the analysis. Nabeel Alsalam, Justin Humphrey, Leah Koestner, and Brooks Pierce provided useful comments.
Lindsey Burke of the Heritage Foundation, Alexander Monge-Naranjo of the Federal Reserve Bank of St. Louis, Marshall Steinbaum of the University of Utah, and Lesley Turner of Vanderbilt University also provided helpful comments. The assistance of external reviewers implies no responsibility for the final product, which rests solely with CBO.
Jeffrey Kling and Robert Sunshine reviewed the report. Rebecca Lanning was the editor, and Casey Labrack was the graphics editor. The report is available on CBO’s website (www.cbo.gov/publication/56706).
CBO continually seeks feedback to make its work as useful as possible. Please send any comments to communications@cbo.gov.

Phillip L. Swagel
November 2020