
At a Glance
The Congressional Budget Office regularly publishes reports that present projections of what federal deficits, debt, spending, and revenues would be for the current year and for the following 10 years if existing laws governing taxes and spending generally remained unchanged. This report is the latest in the series.
- Deficits. CBO projects a federal budget deficit of $3.3 trillion in 2020, more than triple the shortfall recorded in 2019. That increase is mostly the result of the economic disruption caused by the 2020 coronavirus pandemic and the enactment of legislation in response. At 16.0 percent of gross domestic product (GDP), the deficit in 2020 would be the largest since 1945.
The deficit in 2021 is projected to be 8.6 percent of GDP. Between 1946 and 2019, the deficit as a share of GDP has been larger than that only twice. In CBO’s projections, annual deficits relative to the size of the economy generally continue to decline through 2027 before increasing again in the last few years of the projection period, reaching 5.3 percent of GDP in 2030. They exceed their 50-year average of 3.0 percent in each year through 2030.
- Debt. As a result of those deficits, federal debt held by the public is projected to rise sharply, to 98 percent of GDP in 2020, compared with 79 percent at the end of 2019 and 35 percent in 2007, before the start of the previous recession. It would exceed 100 percent in 2021 and increase to 107 percent in 2023, the highest in the nation’s history. The previous peak occurred in 1946 following the large deficits incurred during World War II. By 2030, debt would equal 109 percent of GDP.
- Outlays. Federal outlays are projected to equal 32 percent of GDP in 2020, 11 percentage points (or about 50 percent) above what they were in 2019 and the highest percentage since 1945. Projected outlays fall relative to GDP over the following four years, as pandemic-related spending wanes and low interest rates reduce net interest outlays. In the second half of the projection period, outlays rise from about 22 percent of GDP to 23 percent in 2030. That change results from increased spending for major entitlement programs because of the aging of the population and rising health care costs, as well as from increasing net outlays for interest due to rising interest rates and debt.
- Revenues. Federal revenues are projected to fall from 16.3 percent of GDP in 2019 to 15.5 percent in 2021, primarily because of the economic disruption caused by the pandemic and the federal government’s response. Revenues rise after 2021, reaching almost 18 percent in 2030, as a result of the expiration of temporary provisions enacted in response to the pandemic, scheduled increases in taxes, and other factors.
- Changes Since CBO’s Previous Projections. CBO’s estimate of the deficit for 2020 is now $2.2 trillion more than the agency estimated in March 2020—mostly because of recently enacted legislation. CBO now projects a cumulative deficit over the 2021–2030 period of $13.0 trillion—$0.1 trillion less than the agency projected in March. That 10-year decrease is the net result of changes that go in opposite directions. Lower projected wages, salaries, and corporate profits, as well as recent legislation and other changes, increase deficits, but lower projected interest rates and inflation reduce them (see the appendix).
Notes
Notes
Unless this report indicates otherwise, all years referred to are federal fiscal years, which run from October 1 to September 30 and are designated by the calendar year in which they end.
Numbers in the text, tables, and figures may not add up to totals because of rounding.
Supplemental data for this analysis are available on the Congressional Budget Office’s website (www.cbo.gov/publication/56517), as are a glossary of common budgetary and economic terms (www.cbo.gov/publication/42904), a description of how CBO prepares its baseline budget projections (www.cbo.gov/publication/53532), a description of how CBO prepares its economic forecast (www.cbo.gov/publication/53537), and previous editions of this report (https://go.usa.gov/xQrzS).
In addition, CBO periodically reports to the Congress about the accuracy of its baseline projections of spending, revenues, and the deficit (www.cbo.gov/publication/55927).
CBO’s economic forecast was completed in early July. Unless otherwise indicated, the historical data and projections in this report do not reflect annual revisions to the national income and product accounts, which the Bureau of Economic Analysis released on July 30, 2020.
CBO has corrected this report since its original publication. Corrections are listed at the end of the report.
Visual Summary
In this report, the Congressional Budget Office provides detailed projections of the federal budget under current law for this year and for the following decade. The deficit currently estimated for 2020 is more than three times what CBO projected in March, mostly because of the economic disruption caused by the 2020 coronavirus pandemic and the enactment of legislation in response. In CBO’s current projections, deficits over the 2021–2030 period are similar to those the agency reported in March, because the deficit increases resulting from lower projected wages, salaries, and corporate profits, as well as from new legislation and other changes, are more than offset by the deficit-reducing effects of lower projected interest rates and inflation.
Deficits
CBO estimates that the deficit will total $3.3 trillion in 2020, or 16.0 percent of gross domestic product (GDP)—the largest shortfall relative to the size of the economy since 1945. The deficit is projected to generally narrow through 2027 and then begin to grow, totaling 5.3 percent of GDP in 2030. Deficits remain larger than their average over the past 50 years throughout the 10-year period.
Percentage of Gross Domestic Product
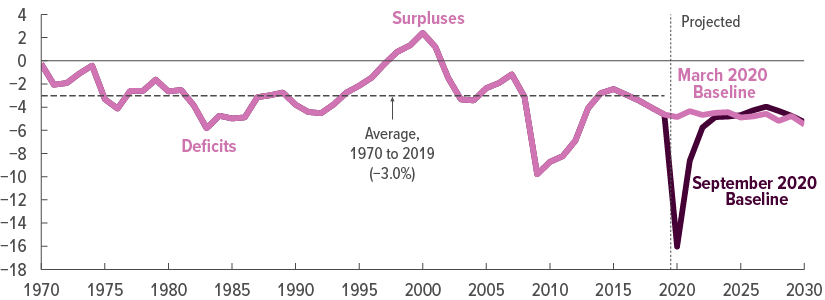
CBO has increased its estimate of the 2020 deficit by $2.2 trillion since the agency prepared its March 2020 projections, mostly as a result of legislation enacted since that time. Deficits over the 2021–2030 period total $13.0 trillion, similar to what CBO projected in March.
See Figure 1
Trillions of Dollars

Over the 2021–2030 period, the effects of changes in CBO’s economic forecast, the estimated effects of legislation, and other changes largely offset. On net, projected deficits over the 10-year period are $0.1 trillion smaller than CBO projected in March 2020.
See Figure A-1
Debt
Federal debt held by the public is projected to increase to 98 percent of GDP in 2020 (compared with 79 percent in 2019 and 35 percent in 2007, before the start of the last recession). It would exceed 100 percent in 2021 and rise to 107 percent in 2023, the highest in the nation’s history. The previous peak occurred in 1946 following the large deficits incurred during World War II.
Percentage of Gross Domestic Product

Federal debt in 2030 would equal 109 percent of GDP, nearly 30 percentage points higher than it was at the end of 2019. At the end of 2030, debt is projected to be more than two and a half times its average over the past 50 years.
See Figure 3
Outlays and Revenues
Outlays in 2020 are projected to be about 50 percent greater than spending in 2019, equaling 32 percent of GDP—the highest since 1945. In CBO’s projections, they decline to 23 percent in 2030, still well above their 50-year average. Revenues are estimated to equal 16 percent of GDP in 2020. After falling slightly next year, they are higher thereafter, reaching almost 18 percent of GDP by the end of the projection period.
Percentage of Gross Domestic Product
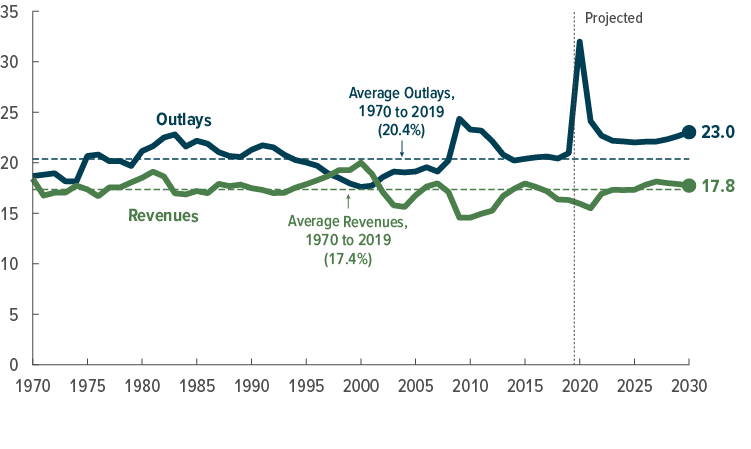
Outlays as a share of GDP fall over the first half of the projection period as pandemic-related spending wanes and low interest rates reduce net interest costs. Outlays rise in later years, boosted by increased spending for programs affected by the aging of the population and rising health care costs, as well as by higher interest costs.
Revenues as a share of GDP initially fall, primarily because of the economic disruption caused by the coronavirus pandemic and the federal government’s response. They are higher after 2021 as temporary provisions enacted in response to the pandemic expire and scheduled tax increases take effect.
See Figure 4
An Update to the Budget Outlook: 2020 to 2030
Overview
Since the Congressional Budget Office last issued its baseline projections, in March, the outlook for the 2020 budget deficit has deteriorated significantly.1 The economic disruption caused by the 2020 coronavirus pandemic and the enactment of legislation in response have led CBO to increase its projection of the deficit for this year by $2.2 trillion. As a result, CBO now anticipates that, if current policies remain the same and no further legislation affecting revenues or spending is enacted, the deficit in 2020 will total $3.3 trillion rather than the $1.1 trillion it projected in March. Measured relative to the size of the economy, the deficit would total 16.0 percent of gross domestic product (GDP), the largest deficit since 1945.2
According to CBO’s projections, under current law, the deficit would shrink after 2020, and by 2023, it would be roughly the same nominal amount that CBO projected in March of this year—before the pandemic. Nevertheless, deficits throughout the next decade would be larger as a percentage of GDP than their average over the past 50 years (see Figure 1).
Figure 1.
Deficits in CBO’s September 2020 Baseline Versus Its March 2020 Baseline
Percentage of Gross Domestic Product

The deficit in 2020 will be the largest since 1945 as a percentage of GDP. Under current law, it is projected to shrink over the following few years, eventually returning to levels similar to those CBO projected before the coronavirus pandemic. Nevertheless, annual deficits would exceed their 50-year average throughout the 2021–2030 period.
Source: Congressional Budget Office.
When October 1 (the first day of the fiscal year) falls on a weekend, certain payments that would ordinarily have been made on that day are instead made at the end of September and thus are shifted into the previous fiscal year. All projections presented here have been adjusted to exclude the effects of those timing shifts. Historical amounts have been adjusted as far back as the available data will allow.
GDP = gross domestic product.
Those large deficits would lead to a sharp increase in debt held by the public, which would reach 98 percent of GDP by the end of 2020, exceed 100 percent in 2021, and then reach 109 percent by the end of 2030 (compared with 79 percent at the end of 2019 and 35 percent at the end of 2007, before the start of the previous recession). Starting in 2023, federal debt as a percentage of GDP would surpass the previous peak, which occurred in 1946, following the large deficits incurred during World War II.
Deficits and Debt
CBO constructs its baseline in accordance with provisions set forth in the Balanced Budget and Emergency Deficit Control Act of 1985 (Public Law 99-177, referred to here as the Deficit Control Act) and the Congressional Budget and Impoundment Control Act of 1974 (P.L. 93-344). Those laws require CBO to construct its baseline under the assumption that current laws governing revenues and spending will generally stay the same and that discretionary appropriations in future years will match current funding, with adjustments for inflation. In consultation with the House and Senate Committees on the Budget, however, CBO deviated from those standard procedures when constructing its current baseline for discretionary spending. Because of the unusual size and nature of the emergency funding provided in legislation enacted in response to the coronavirus pandemic, the agency did not extrapolate $471 billion in discretionary budget authority that was provided for those purposes since March 6, 2020.3
CBO’s baseline is meant to provide a benchmark that policymakers can use to assess the potential effects of future policy; it is not intended to provide a forecast of future budgetary outcomes. Future legislative action could lead to markedly different outcomes—but even if federal laws remained unaltered for the next decade, actual budgetary outcomes would probably differ from CBO’s baseline, not only because of unanticipated economic conditions, but also as a result of the many other factors that affect federal revenues and outlays.
Deficits
The pandemic and legislation enacted in response to it have caused the deficit to surge in the past few months. It was $741 billion through the end of March; CBO now anticipates that the deficit in the second half of the fiscal year will be roughly three and a half times that amount. The projected deficit in 2020—$3.3 trillion—is more than triple the shortfall recorded last year. Outlays, which are projected to increase from 21.0 percent of GDP in 2019 to 32.0 percent in 2020, primarily as a result of legislation enacted since March, account for nearly all of that increase (see the appendix).
In CBO’s baseline, the deficit in 2021 is projected to be 8.6 percent of GDP. Between 1946 and 2019, the deficit as a share of GDP has been larger than that only twice. Deficits continue to decline over the next two years, to 4.9 percent in 2023, as spending provided in response to the pandemic wanes and the economy continues to improve. Relative to the size of the economy, deficits generally continue to decline through 2027, although more gradually, before increasing again over the last few years of the projection period, reaching 5.3 percent of GDP in 2030 (see Table 1).4
The cumulative deficit between 2021 and 2030 is projected to total $13.0 trillion (5.0 percent of GDP over that period), about the same as CBO projected in March. Lower projected wages, salaries, and corporate profits, as well as recent legislation and other changes, increase deficits, but that change is more than offset by lower projected interest rates and inflation, which decrease deficits. The average deficit projected over that 10-year period is 2.0 percentage points more than the 3.0 percent of GDP that annual deficits have averaged over the past 50 years. Until recently, deficits tended to be small by historical standards when the economy was relatively strong over a period of several years. For example, between 1969 and 2018, the average deficit totaled 1.5 percent of GDP in years when the unemployment rate was below 6 percent. In CBO’s projections, although the unemployment rate falls below 6 percent in the years after 2024, projected deficits average 4.6 percent of GDP in those years.
Primary deficits—that is, deficits excluding net outlays for interest—are projected to reach 14.4 percent of GDP in 2020 and to shrink considerably over the next few years (see Figure 2). Primary deficits would average 3.6 percent of GDP from 2021 through 2030. Net interest outlays would fall from 1.6 percent of GDP this year to a low of 1.1 percent in 2024 and 2025 and then increase over the remainder of the projection period, reaching 2.2 percent of GDP in 2030.
Figure 2.
Total Deficit, Primary Deficit, and Net Interest
Percentage of Gross Domestic Product
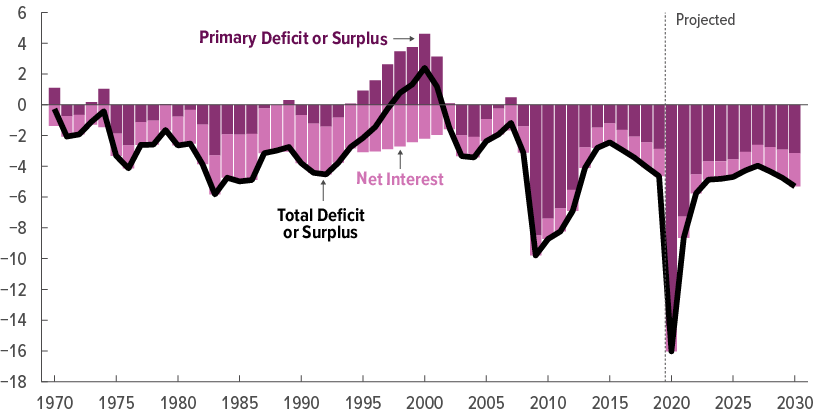
In CBO’s projections, primary deficits increase in 2020 and then decrease over the next several years before increasing again at the end of the projection period. Total deficits increase more rapidly in those final years, however, because of rising interest costs.
Source: Congressional Budget Office.
Primary deficits or surpluses exclude net outlays for interest.
When October 1 (the first day of the fiscal year) falls on a weekend, certain payments that would ordinarily have been made on that day are instead made at the end of September and thus are shifted into the previous fiscal year. All projections presented here have been adjusted to exclude the effects of those timing shifts. Historical amounts have been adjusted as far back as the available data will allow.
Debt Held by the Public
The deficits projected in CBO’s baseline would boost federal debt held by the public, which consists mostly of securities that the Treasury issues to raise cash to fund the federal government’s activities and pay off its maturing liabilities. The net amount that the Treasury borrows by issuing those securities (calculated as the amounts that are sold minus the amounts that have matured) is influenced primarily by the annual budget deficit. However, several other factors—collectively labeled “other means of financing” and not directly included in budget totals—also affect the government’s need to borrow from the public. Those factors include changes in the government’s cash balances, as well as cash flows associated with federal credit programs such as student loans and loans to small businesses (because only the subsidy costs of those programs are reflected in the budget deficit).5
Specifically, CBO estimates that the Treasury will increase its cash balances by $600 billion this year, which does not affect the deficit but results in an increase in debt of the same amount.6 But the deficit includes some costs for which the cash has not yet been disbursed, which reduces the amount of debt the Treasury will add in 2020 by $441 billion. That adjustment is primarily the result of new loan guarantee programs—the Paycheck Protection Program and the Small Business Administration’s (SBA’s) Debt Relief Program—that add more than $500 billion to this year’s deficit but whose cash payments are expected to occur mostly in future years.7 Including all other means of financing that reconcile the estimated deficit with the Treasury’s borrowing needs, CBO projects that the increase in debt held by the public in 2020 will exceed the deficit by $159 billion.
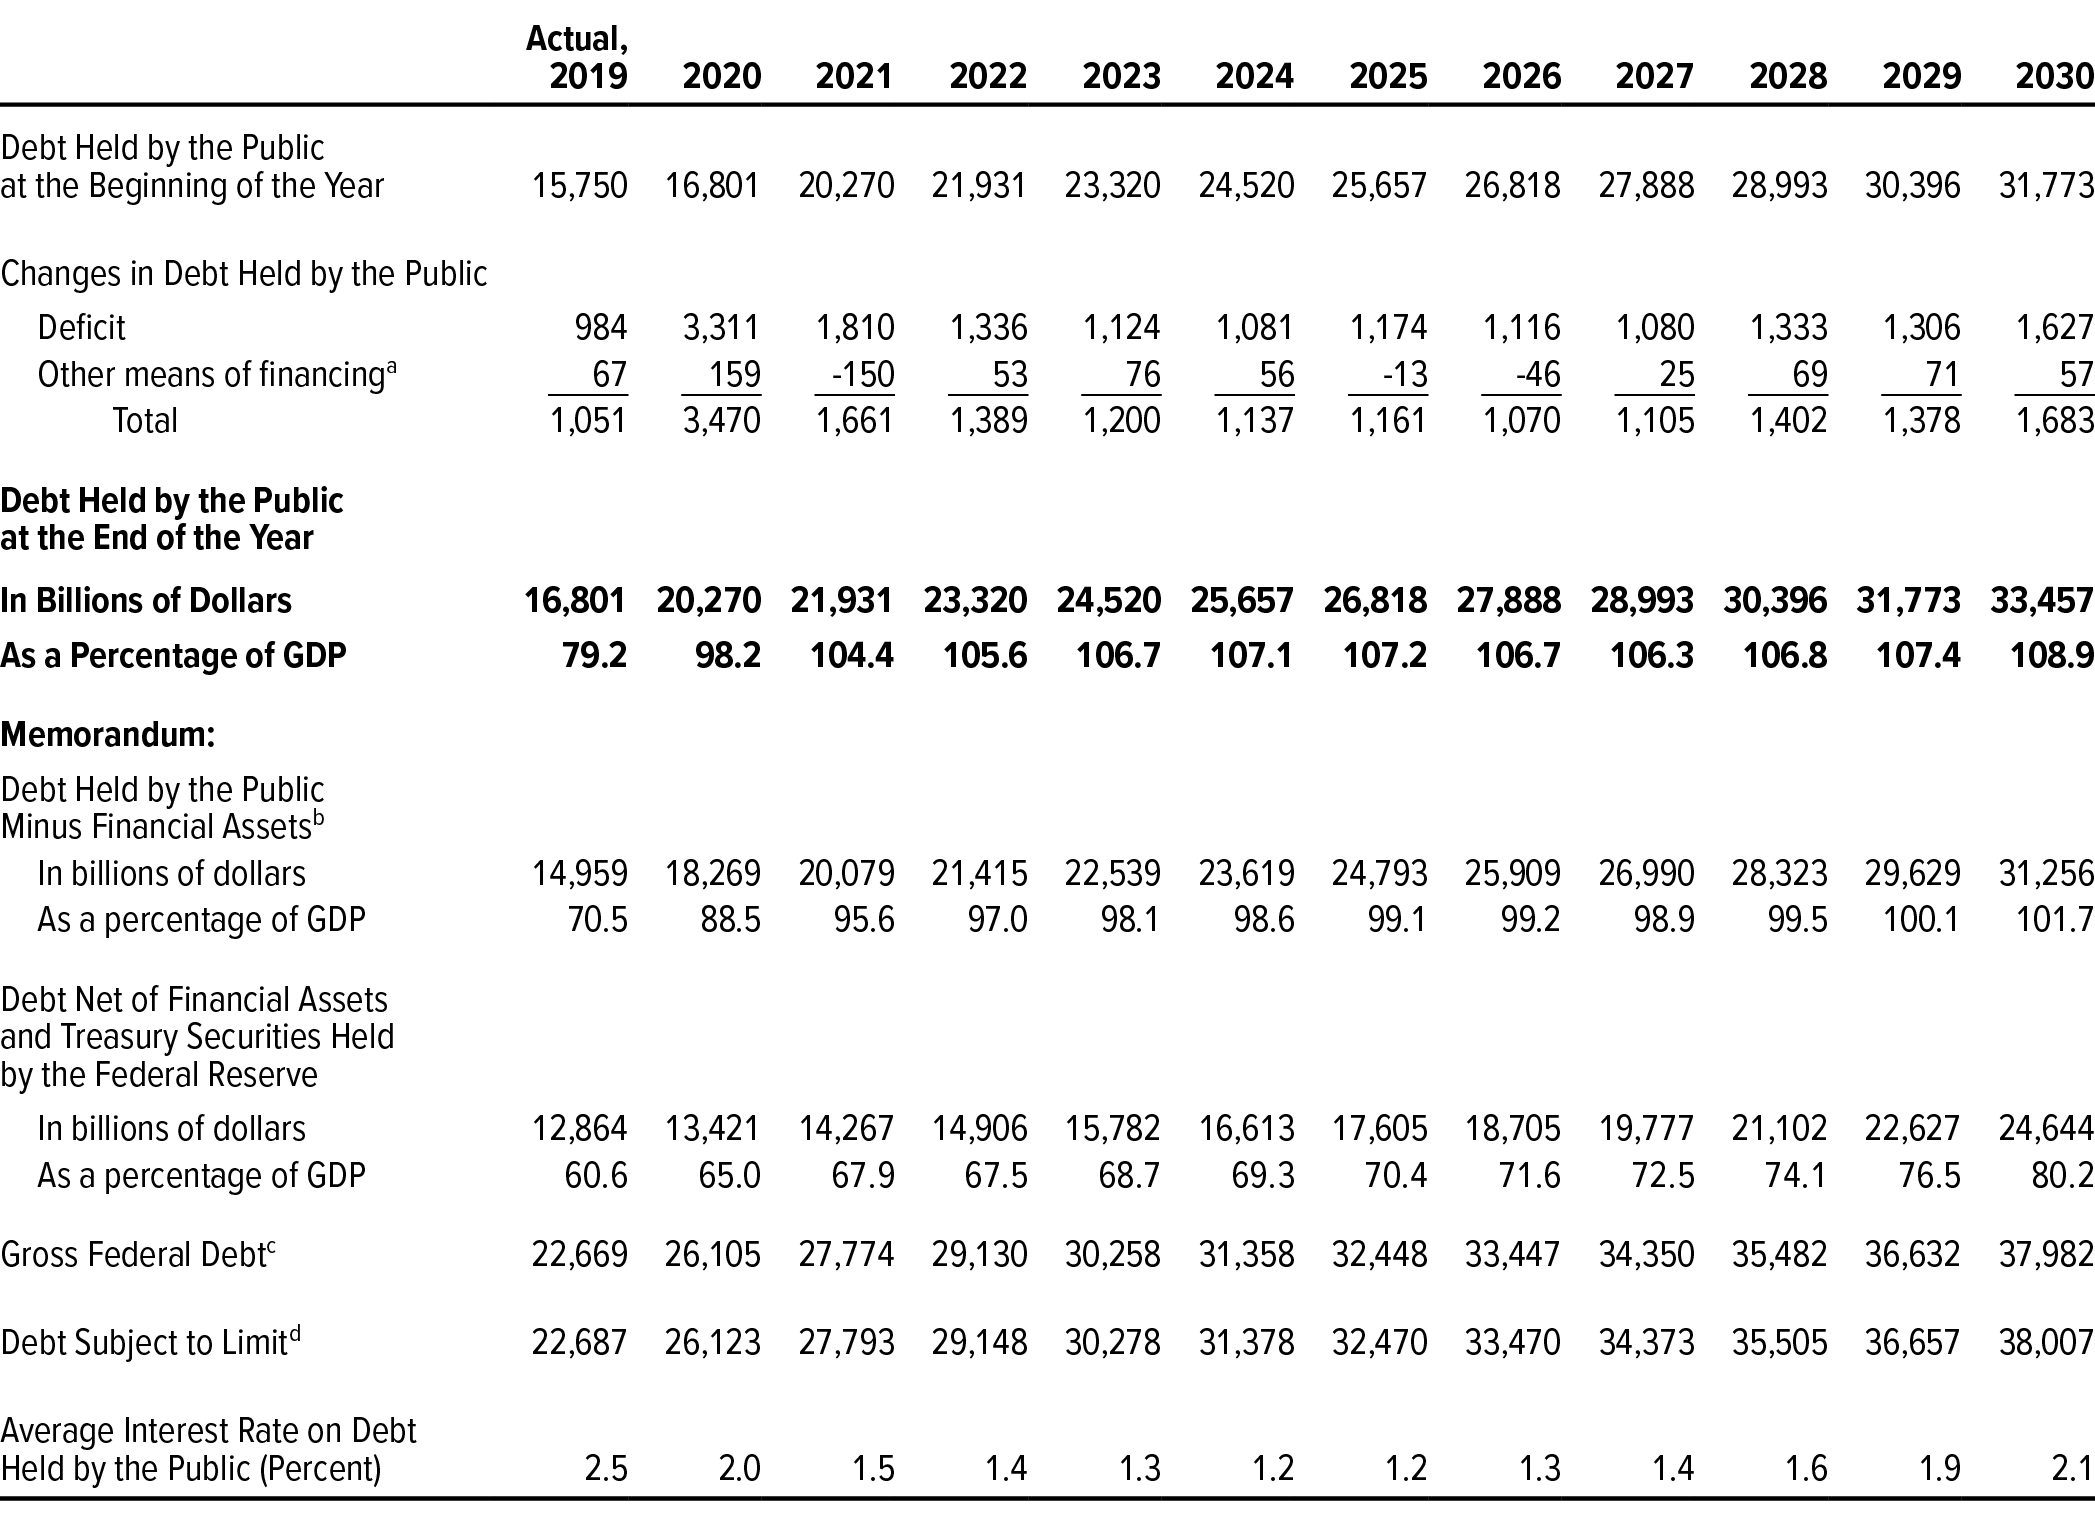
In CBO’s baseline, after accounting for all of the government’s borrowing needs, debt held by the public rises from $16.8 trillion at the end of 2019 to $33.5 trillion at the end of 2030 (see Table 2). As a percentage of GDP, debt at the end of 2030 would stand at 109 percent, about 30 percentage points above where it stood at the end of 2019 and more than two and a half times the average over the past 50 years (see Figure 3).
Table 2.
CBO’s Baseline Projections of Federal Debt
Billions of Dollars
Source: Congressional Budget Office.
GDP = gross domestic product.
a. Factors not included in budget totals that affect the government’s need to borrow from the public. Those factors include changes in the government’s cash balances, as well as cash flows associated with federal credit programs such as student loans (because only the subsidy costs of those programs are reflected in the budget deficit).
b. Debt held by the public minus the value of outstanding student loans and other credit transactions, cash balances, and various financial instruments.
c. Federal debt held by the public plus Treasury securities held by federal trust funds and other government accounts.
d. The amount of federal debt that is subject to the overall limit set in law. That measure of debt excludes debt issued by the Federal Financing Bank and reflects certain other adjustments that are excluded from gross federal debt. The debt limit was most recently set at $22.0 trillion but has been suspended through July 31, 2021. On August 1, 2021, the debt limit will be raised to its previous level plus the amount of federal borrowing that occurred while the limit was suspended. For more details, see Congressional Budget Office, Federal Debt and the Statutory Limit, February 2019 (February 2019), www.cbo.gov/publication/54987.
Figure 3.
Federal Debt Held by the Public
Percentage of Gross Domestic Product

Federal debt has increased sharply this year and is projected to increase in most years over the coming decade. Beginning in 2023, debt would be higher than at any other time in the nation’s history.
Source: Congressional Budget Office.
Another measure of debt excludes the value of the government’s financial assets. Debt net of financial assets reflects the government’s overall financial condition by accounting for government spending that results in the acquisition of financial assets, such as student loans. An additional measure, which also excludes Treasury securities held by the Federal Reserve, better reflects the government’s overall effect on credit markets. In CBO’s baseline projections, debt net of financial assets and holdings of the Federal Reserve increases from $12.9 trillion (or 61 percent of GDP) at the end of 2019 to $24.6 trillion (or 80 percent of GDP) at the end of 2030.
The Budget Outlook for 2020
Compared with last year’s outlays and revenues, outlays have risen sharply in 2020, and revenues have fallen. As a result, CBO estimates that the deficit for this year will total 16.0 percent of GDP. Before this year, by comparison, the largest deficit recorded since the end of World War II occurred in 2009, when the deficit totaled 9.8 percent of GDP.
This year’s deficit is projected to be 11 percentage points larger than last year’s shortfall. Most of the increase stems from the budgetary effects of legislation enacted in response to the ongoing coronavirus pandemic:
- The Coronavirus Preparedness and Response Supplemental Appropriations Act (P.L. 116-123, enacted on March 6, 2020),
- The Families First Coronavirus Response Act (FFCRA, P.L. 116-127, enacted on March 18, 2020),
- The Coronavirus Aid, Relief, and Economic Security Act (CARES Act, P.L. 116-136, enacted on March 27, 2020), and
- The Paycheck Protection Program and Health Care Enhancement Act (P.L. 116-139, enacted on April 24, 2020).
Outlays
In CBO’s projections, federal outlays in 2020 total $6.6 trillion—$2.2 trillion (or about 50 percent) more than the amount recorded in 2019. Most of that growth is attributable to mandatory outlays. Relative to the size of the economy, outlays are projected to equal 32.0 percent of GDP, the highest percentage since 1945 and about 12 percentage points above their 50-year average of 20.4 percent.
Mandatory Spending. Mandatory, or direct, spending includes outlays for some federal benefit programs and for certain other payments to people, businesses, nonprofit institutions, and state and local governments. Such outlays are generally governed by statutory criteria and are not normally constrained by the annual appropriation process.8 Certain types of payments that federal agencies receive from the public and from other government agencies are classified as offsetting receipts and are accounted for in the budget as reductions in mandatory spending.
The Deficit Control Act requires CBO to construct baseline projections for most mandatory spending under the assumption that current laws continue unchanged.9 Therefore, CBO’s baseline projections of mandatory spending reflect the estimated effects of economic influences, growth in the number of beneficiaries of certain mandatory programs, and other factors related to the costs of those programs. The projections also incorporate a set of across-the-board reductions in budgetary resources (known as sequestration) that are required under current law for some mandatory programs.
In 2020, CBO estimates, total mandatory outlays (net of offsetting receipts) will amount to $4.6 trillion, nearly 70 percent (or $1.9 trillion) more than they were in 2019 (see Table 3). As a share of GDP, those outlays are projected to equal 22.4 percent, the largest percentage recorded since at least 1962 (the earliest year for which such data have been reported). A number of programs account for that increase.
Table 3.
Mandatory Outlays Projected in CBO’s Baseline
Billions of Dollars

Source: Congressional Budget Office.
Data on outlays for benefit programs in this table generally exclude administrative costs, which are discretionary.
MERHCF = Department of Defense Medicare-Eligible Retiree Health Care Fund (including TRICARE for Life); * = between zero and $500 million.
a. Excludes the effects of Medicare premiums and other offsetting receipts. (Net Medicare spending, which includes those offsetting receipts, is shown in the memorandum section of the table.)
b. When October 1 (the first day of the fiscal year) falls on a weekend, as it will in calendar years 2022, 2023, and 2028, certain payments that would ordinarily have been made on that day are instead made at the end of September and thus are shifted into the previous fiscal year.
c. Premium tax credits are federal subsidies for health insurance purchased through the marketplaces established under the Affordable Care Act. Related spending consists almost entirely of payments for risk adjustment and the Basic Health Program.
d. Includes outlays for recovery rebates for individuals, the American Opportunity Tax Credit, and other credits.
e. Includes Temporary Assistance for Needy Families, Child Support Enforcement, Child Care Entitlements to States, and other programs that benefit children.
f. Includes benefits for retirement programs in the civil service, foreign service, and Coast Guard; benefits for smaller retirement programs; and annuitants’ health care benefits.
g. Includes veterans’ compensation, pensions, and life insurance programs. (Outlays for veterans’ health care are classified as discretionary.)
h. Cash payments from Fannie Mae and Freddie Mac to the Treasury are recorded as offsetting receipts in 2019 and 2020. Beginning in 2021, CBO’s estimates reflect the net lifetime costs—that is, the subsidy costs adjusted for market risk—of the guarantees that those entities will issue and of the loans that they will hold. CBO counts those costs as federal outlays in the year of issuance.
i. Includes premium payments, recoveries of overpayments made to providers, and amounts paid by states from savings on Medicaid’s prescription drug costs.
Small Business Administration Loans and Guarantees. Mandatory outlays for the SBA will total $577 billion this year, CBO estimates, compared with −$1 billion in 2019. The Paycheck Protection Program accounts for $541 billion of that increase. Under that program, the SBA guarantees loans—which may be forgiven if certain employment retention and compensation preservation criteria are met—to small businesses and other entities primarily to maintain existing payrolls over a 24-week period following disbursement.10 (CBO anticipates that most of those loans will ultimately be forgiven.) Recently enacted legislation also provided additional funding for the SBA to make advances to small businesses that suffered economic injury as a result of the coronavirus pandemic and gave the SBA authority to temporarily modify certain loans. Those provisions increase estimated outlays in 2020 by $20 billion and $17 billion, respectively.
Unemployment Compensation. Outlays for unemployment compensation are expected to soar in 2020, from $28 billion in 2019 to $557 billion, reflecting a legislative expansion of benefits and a sharp increase in the number of claims. Roughly 70 percent of that increase stems from recently enacted legislation that enhanced the weekly benefit amount, increased the number of weeks a person can claim benefits, and expanded eligibility to people who might not otherwise qualify for benefits. In addition, the widespread economic disruption caused by the pandemic resulted in an unprecedented surge in claims for unemployment compensation. The unemployment rate, which averaged 3.7 percent during fiscal year 2019, spiked to 14.7 percent in April, the highest level since the Great Depression. In March, CBO estimated that about 5 million initial claims for regular unemployment insurance would be made in fiscal year 2020; CBO now expects roughly 33 million such claims for regular unemployment insurance and an additional 12 million initial claims for pandemic unemployment assistance.
Recovery Rebates for Individuals. The CARES Act provided a refundable tax credit of $1,200 per person (or $2,400 for joint filers), plus $500 for each dependent child under the age of 17. The credit phases out for taxpayers whose adjusted gross income exceeds certain thresholds. Those tax credits are estimated to increase mandatory outlays by $272 billion in 2020.11
Coronavirus Relief Fund. The sharp economic contraction brought on by the coronavirus pandemic has caused the fiscal outlook for state, local, tribal, and territorial governments to deteriorate significantly. In response, the CARES Act provided direct assistance for those entities, which will increase outlays by $150 billion in 2020, CBO estimates.
Medicare. Outlays for Medicare (net of offsetting receipts) will rise by 12 percent in 2020, from $644 billion in 2019 to $721 billion, CBO projects. That increase results in part from payments made to providers in 2020 in advance of expected health care claims. CBO expects that those payments will be recouped from providers in 2020 and 2021. On net, those payments will increase mandatory outlays by $64 billion in 2020.
Medicaid. The coronavirus pandemic and legislation enacted in response to it have also caused spending for Medicaid to rise rapidly in 2020. Outlays for the program will total $466 billion this year, CBO estimates, an increase of $57 billion (or 14 percent) relative to spending in 2019. The deterioration in the economy has caused enrollment in the program to rise. In addition, legislation has raised the portion of costs the federal government must cover and required that states maintain coverage for all Medicaid enrollees during the public health emergency regardless of any changes in their income or circumstances that would otherwise have caused them to become ineligible for the program.
Higher Education. CBO estimates that outlays for higher education will rise from $33 billion in 2019 to $94 billion in 2020. Nearly all of that increase will occur because the Administration recorded a large upward revision to the subsidy costs of student loans made in previous years. That revision was made primarily because of newly available data that showed lower income for borrowers with income-driven repayment plans.12
Other Mandatory Spending. All other mandatory spending is estimated to rise by $159 billion (or 10 percent) in 2020. The following programs have the largest projected increases:
- Outlays for Social Security are estimated to increase by $52 billion (or 5 percent) in 2020, primarily as a result of growth in the number of beneficiaries and the average benefit payment.
- Outlays for the Supplemental Nutrition Assistance Program are projected to rise by $28 billion (or 45 percent) in 2020. Most of that increase stems from recently enacted legislation that allowed states to provide households with the maximum allowable benefit for their household size and to provide benefits to replace meals that children would otherwise have received at school. The deterioration in economic conditions has boosted enrollment in the program, which has also contributed to the increase in outlays.
- The CARES Act provided $32 billion in payroll support to air carriers and related contractors to maintain payrolls and avoid job losses in the airline industry. By CBO’s estimate, that funding will boost outlays in 2020 by $28 billion.
Discretionary Spending. Discretionary spending encompasses an array of federal activities that are funded through or controlled by appropriations. That category includes most defense spending, as well as spending for many nondefense activities, such as elementary and secondary education, housing assistance, international affairs, and the administration of justice, along with outlays for highway programs.13 In any year, some discretionary outlays arise from budget authority provided in the same year, and some arise from appropriations made in previous years.14
CBO’s projections of discretionary funding incorporate limits, or caps, that were previously set on discretionary appropriations for 2020 and 2021.15 Some elements of discretionary funding are not constrained by the caps; for most of those exceptions, the caps are adjusted to accommodate the funding provided. In particular, adjustments to the caps are made for all appropriations designated, in accordance with section 251 of the Deficit Control Act, for emergency requirements and overseas contingency operations (OCO). Subject to certain limits, additional adjustments are made for funding designated for disaster relief activities, some efforts to reduce overpayments in benefit programs, wildfire suppression, and (for this year only) activities related to the 2020 census.
Two types of funding do not count toward the caps and do not result in an adjustment to the caps: a portion of funding—up to amounts specified in law—for certain activities authorized by the 21st Century Cures Act (P.L. 114-255) and a small portion of funding provided for 2020 in division A of the CARES Act.16
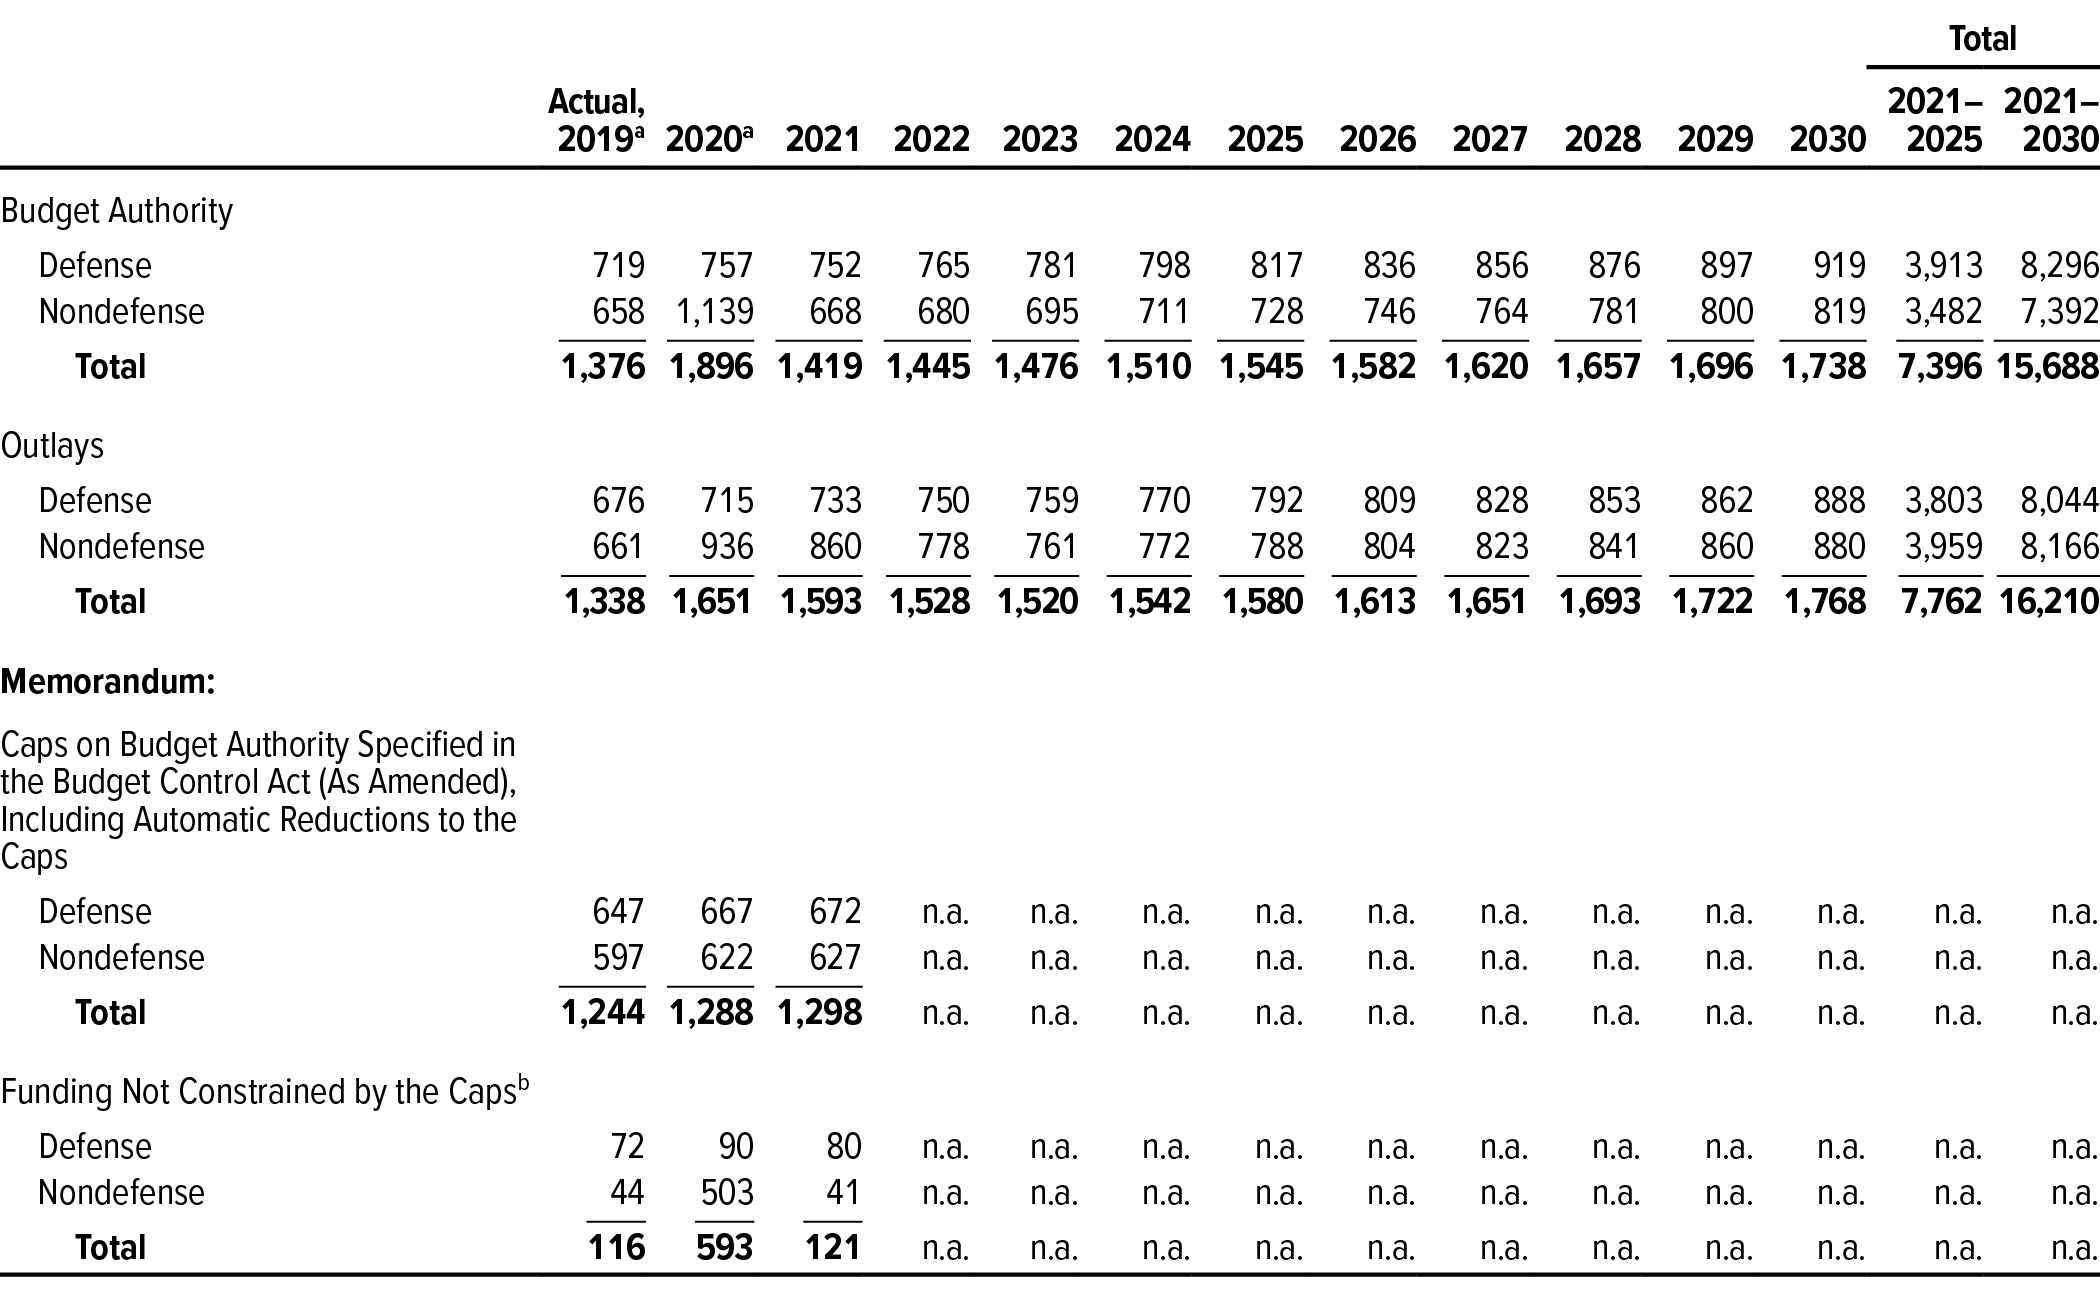
By CBO’s estimate, discretionary budget authority for 2020 totals $1.9 trillion, $520 billion (or 38 percent) more than the amount provided in 2019. That total for 2020 includes $593 billion for emergency requirements, OCO, and other activities not constrained by the caps (see Table 4).17 CBO anticipates that, if no further appropriations are provided this year, outlays from appropriations will total $1.7 trillion in 2020—$314 billion (or 23 percent) more than last year’s amount. The significant increase in budget authority and outlays for 2020 mostly stems from $487 billion in additional funding for activities that have been designated as emergency requirements in accordance with the Deficit Control Act. Almost all of that emergency funding was provided in legislation enacted in response to the ongoing coronavirus pandemic.
Table 4.
CBO’s Baseline Projections of Discretionary Spending
Billions of Dollars
Source: Congressional Budget Office.
CBO’s current baseline projections incorporate the assumption that the caps on discretionary budget authority and the automatic enforcement procedures specified in the Budget Control Act of 2011 (as amended) remain in effect through 2021.
Nondefense discretionary outlays are usually greater than budget authority because of spending from the Highway Trust Fund and the Airport and Airway Trust Fund that is subject to obligation limitations set in appropriation acts. The budget authority for such programs is provided in authorizing legislation and is considered mandatory.
n.a. = not applicable.
a. The amount of budget authority for 2019 and 2020 in CBO’s baseline does not match the sum of the caps on funding plus adjustments to the caps. That occurs mostly because net reductions in mandatory budget authority stemming from provisions in appropriation acts for those years were credited as offsets to new discretionary budget authority in judging the acts’ compliance with the caps. In the baseline, those changes to mandatory budget authority appear in their normal mandatory accounts.
b. Discretionary funding for certain types of activities is not constrained by the caps; for most of those activities, the caps are adjusted to accommodate such funding, up to certain limits. Specifically, appropriations designated for overseas contingency operations and activities designated as emergency requirements are assumed to grow with inflation after 2020; if that occurred, the caps would be adjusted accordingly. (However, because of the unusual size and nature of the emergency funding provided in recently enacted legislation in response to the coronavirus pandemic, CBO, in consultation with the budget committees, did not extrapolate the new discretionary budget authority that was designated as an emergency requirement.)
For four other activities—disaster relief, wildfire suppression, activities related to the 2020 census (for this year only), and certain efforts to reduce overpayments in benefit programs—the extent to which the caps can be adjusted is subject to annual constraints, as specified in law. Two additional exceptions do not count toward the caps but do not result in an adjustment to the caps: a portion of funding—up to amounts specified in law—for certain activities authorized by the 21st Century Cures Act (Public Law 114-255) and a small portion of funding provided by division A of the Coronavirus Aid, Relief, and Economic Security Act (P.L. 116-136) that was originally classified as mandatory spending.
Discretionary funding for defense totals $757 billion in 2020, CBO estimates, including $72 billion for OCO and $19 billion for activities designated as emergency requirements (including $11 billion related to pandemic response). Defense outlays, which amounted to $676 billion in 2019, will increase by $39 billion (or 6 percent), to $715 billion, according to CBO’s estimates. Outlays are projected to increase by $15 billion (or 12 percent) for procurement, $11 billion (or 4 percent) for operation and maintenance, $7 billion (or 8 percent) for research and development, and $4 billion (or 3 percent) for military personnel.
For 2020, nondefense discretionary funding in CBO’s baseline totals $1,139 billion. That amount includes $503 billion that is not limited by the caps on discretionary funding. Of that total, $500 billion will result in cap adjustments, CBO estimates, including $468 billion for activities designated as emergency requirements (nearly all of which are related to pandemic response), $18 billion for disaster relief, $8 billion for OCO, $2.5 billion for activities related to the 2020 census, $2 billion for efforts to reduce overpayments in benefit programs, and $2 billion for wildfire suppression. The remaining amount—nearly $2 billion in appropriations stemming from division A of the CARES Act and $1 billion for 21st Century Cures Act programs—is not subject to the caps and does not result in cap adjustments.
CBO expects that nondefense discretionary outlays will increase by $275 billion (or 42 percent) in 2020, to $936 billion. Nearly half of that increase ($135 billion) is for the Public Health and Social Services Emergency Fund of the Department of Health and Human Services. In addition, discretionary outlays will increase by $41 billion for community and regional development, $26 billion for transportation, and $14 billion for education, CBO estimates. Spending related to the pandemic response accounts for at least three-quarters of each of those increases in outlays in 2020. The remaining growth in nondefense discretionary spending is the result of smaller increases in spending for various programs.
Net Interest. In the budget, net interest outlays primarily encompass the government’s interest payments on federal debt, offset by interest income that the government receives. Net outlays for interest are dominated by the interest paid to holders of the debt that the Treasury issues to the public. The Treasury also pays interest on debt issued to trust funds and other government accounts, but such payments are intragovernmental transactions that have no effect on the budget deficit.
Although debt held by the public is set to increase by more than 20 percent relative to 2019, net outlays for interest in 2020 are projected to fall to $338 billion (or 1.6 percent of GDP), compared with $375 billion last year. That drop occurs primarily because interest rates have been much lower in 2020 than they were in 2019. In addition, inflation has been lower in 2020, resulting in smaller increases in the principal of inflation-protected securities. Those increases are recorded as interest outlays, so less inflation lowers net outlays for interest.
Revenues
On the basis of receipts through July 2020, CBO expects federal revenues to total $3.3 trillion this fiscal year, $167 billion (or about 5 percent) less than in 2019. That decline stems largely from lower collections of individual and corporate income taxes in the second half of the year. Receipts for 2020 reflect income and activity from before and after the onset of the economic disruption caused by the coronavirus pandemic and the federal government’s response, including the enactment of legislation. Revenues in the first six months of the fiscal year—October 2019 through March 2020—were 6 percent higher than in the previous fiscal year. CBO projects that revenues in the second half of the fiscal year—April 2020 through September 2020—will be 13 percent lower than over the same period last year.
Individual Income Taxes. CBO estimates that collections of individual income taxes will decline by $185 billion (or 11 percent) in 2020. That decline reflects changes in taxable income, as well as administrative and legislative changes implemented in response to the pandemic.
Taxes withheld from paychecks that are classified as individual income taxes will decrease by 10 percent, in CBO’s estimation. Wages and salaries are projected to decline in 2020 by about 1 percent, on net, because increases observed during the first half of the fiscal year will be more than offset by declines in the second half. CBO expects withheld income taxes to fall more than wages fall, largely because it anticipates that the Treasury will record the effects of some economic and legislative factors that would normally be expected to reduce payroll taxes in 2020 as reductions in income taxes.
Why will the Treasury record the effects that way? When it receives payments of withheld taxes, it does not initially observe a difference between payroll taxes and withheld individual income taxes. Instead, it first allocates withheld taxes to one source or the other on the basis of estimates made in advance of actual collections. As additional information becomes available, including detailed tax return information, the Treasury makes periodic reallocations to revise past allocations. CBO anticipates that payroll taxes recorded for 2020 will not reflect the declines in wages and salaries that occurred as a result of the pandemic, the effects of which began after the Treasury made those estimates. Those declines in payments to the Treasury will instead be recorded as reductions in individual income taxes.
Recently enacted legislation is also expected to reduce withheld taxes. The CARES Act allows most employers to defer payment of their portion of certain payroll taxes. In addition, FFCRA provides refundable credits against payroll taxes to compensate employers for paid sick leave and for family and medical leave, and the CARES Act provides a refundable credit against payroll taxes for employee retention. Although those provisions affect payroll taxes, they will not change the amounts credited to the Social Security and Railroad Retirement trust funds, and the effects are being recorded in the budget—at least for now—as reductions in individual income tax collections.
Nonwithheld payments of individual income taxes are also expected to decline by 11 percent this year. Those amounts reflect a combination of estimated and final payments for the 2019 tax year, as well as estimated payments for the 2020 tax year. Payments for 2019 tax liabilities reflect activity from before the pandemic and subsequent economic disruption. Payments of 2020 taxes probably reflect declines in economic activity, as well as the effects of recently enacted legislation. The CARES Act included several provisions that are expected to reduce estimated payments of individual income taxes this year, most notably a provision that temporarily allows taxpayers to offset more nonbusiness income with business losses. Refunds, largely for the 2019 tax year, are expected to be $17 billion (or 7 percent) lower than last year, boosting net receipts.18
Payroll Taxes. CBO expects that reported receipts from payroll taxes—which primarily fund Social Security and Medicare’s Hospital Insurance program—will increase by $70 billion (or 6 percent) this year, despite the projected decline in wages and salaries. As described in more detail above, amounts recorded by the Treasury as payroll taxes for 2020 were largely determined before the onset of the pandemic. The effects of subsequent declines in wages and enacted legislation are being recorded as lower individual income tax receipts in 2020. CBO anticipates that the Treasury will make reallocations between payroll and individual income taxes in future years to correct for allocations made in 2020, which will reduce payroll taxes recorded in future years.
Corporate Income Taxes. Income tax payments by corporations, net of refunds, are expected to decline by $79 billion (or 34 percent) in 2020. Collections in fiscal year 2020 include most businesses’ final tax payments for the 2019 tax year and their initial payments for 2020. The decline reflects reductions in business activity and taxable income as well as legislation enacted in response to the pandemic. Most significantly, the CARES Act changed the way businesses can use net operating losses (NOLs) to offset taxable income. The act temporarily increases the portion of taxable income that can be offset by NOLs from 80 percent to 100 percent during the three-year period from 2018 through 2020. It also allows corporations to use recently incurred NOLs from that three-year period to reduce tax liabilities for the prior five years and to receive refunds of taxes previously paid for those years.
Other Revenues. CBO expects that other revenues will increase, on net, by $26 billion (or 10 percent) in 2020. Remittances from the Federal Reserve to the Treasury are expected to rise by $30 billion this year for two reasons. First, lower short-term interest rates led the central bank to pay depository institutions less interest on their reserves. Second, as part of its efforts to carry out monetary policy in response to the pandemic, the Federal Reserve has significantly increased its holdings of assets, which tends to further increase remittances from the income received on those assets.
Excise taxes are projected to decline by $9 billion in 2020, in part because the CARES Act suspended the collection of certain aviation excise taxes for the rest of the calendar year. A general reduction in economic activity has also contributed to the decline, particularly for excise taxes levied on gasoline and other fuels. Declines in excise taxes for those reasons will be partially offset by the final payment of a tax on health insurance providers, which will be collected in 2020 but was not collected in 2019.
All other receipts are expected to increase by a combined $6 billion, on net.
CBO’s Projections of Outlays and Revenues for 2021 Through 2030
In CBO’s baseline projections, deficits as a percentage of GDP generally decrease over much of the projection period, falling from 8.6 percent of GDP in 2021 to a low of 4.0 percent of GDP in 2027. They increase at the end of the period, reaching 5.3 percent of GDP in 2030. In nominal terms, federal outlays change little from 2021 through 2023 and then grow at an average annual rate of almost 5 percent over the remainder of the projection period, about the same rate of growth that CBO projected in March 2020 before the current public health emergency. Revenues fall in 2021, jump up in 2022, and then increase by just under 5 percent per year, on average, through 2030, similar to the rate of growth that CBO projected in March. Projected revenues are bolstered by the scheduled expiration, at the end of 2025, of income tax cuts enacted in 2017.
Outlays
In CBO’s baseline projections, federal outlays fall from $6.6 trillion this year to $5.1 trillion in 2021 and remain near that amount in 2022 and 2023. Outlays rise thereafter, reaching $7.1 trillion in 2030.
Relative to the size of the economy, federal outlays fall from 32.0 percent of GDP in 2020 to a low of 21.8 percent in 2024, nearly 1 percentage point higher than the amount recorded in 2019 (see Figure 4). All three major categories of spending—mandatory, discretionary, and net interest—decline over that time relative to GDP, as spending related to the pandemic falls and sharply lower interest rates reduce net interest outlays. After 2024, outlays generally increase—a result of underlying trends involving the aging of the population and the rising cost of health care, as well as rising interest rates—and reach 23.0 percent of GDP in 2030 (see Figure 5).
Figure 4.
Total Revenues and Outlays
Percentage of Gross Domestic Product

Source: Congressional Budget Office.
When October 1 (the first day of the fiscal year) falls on a weekend, certain payments that would ordinarily have been made on that day are instead made at the end of September and thus are shifted into the previous fiscal year. All projections presented here have been adjusted to exclude the effects of those timing shifts. Historical amounts have been adjusted as far back as the available data will allow.
Figure 5.
CBO’s Baseline Projections of Outlays and Revenues, Compared With Actual Values 25 and 50 Years Ago
Percentage of Gross Domestic Product

Source: Congressional Budget Office.
When October 1 (the first day of the fiscal year) falls on a weekend, certain payments that would ordinarily have been made on that day are instead made at the end of September and thus are shifted into the previous fiscal year. That happened in 1994 and 1995, so values for 1995 have been adjusted to exclude the effects of those timing shifts.
a. Consists of outlays for Medicare (net of premiums and other offsetting receipts), Medicaid, the Children’s Health Insurance Program, subsidies for health insurance purchased through the marketplaces established under the Affordable Care Act, and related spending.
Mandatory Spending. In CBO’s baseline projections, outlays for mandatory programs (net of offsetting receipts) are projected to fall from 15.2 percent of GDP in 2021 to 14.2 percent in 2024 and then to rise in most years thereafter, reaching 15.1 percent of GDP by 2030 (compared with an average of 10.1 percent over the 1970–2019 period). That pattern mostly results from falling spending related to the pandemic over the next few years and the budgetary effects of two underlying factors that put upward pressure on mandatory outlays: the aging of the population, which causes the number of participants in Social Security and Medicare to grow faster than the overall population, and growth in federal health care costs per beneficiary that exceeds the growth in GDP per capita. As a result, CBO expects outlays for those two programs to increase relative to GDP between 2021 and 2030 (see Table 5). The effects of those two trends on federal spending will persist beyond the projection period.
Table 5.
Key Projections in CBO’s Baseline
Percentage of Gross Domestic Product

Source: Congressional Budget Office.
This table satisfies a requirement specified in section 3111 of S. Con. Res. 11, the Concurrent Resolution on the Budget for Fiscal Year 2016.
a. Consists of outlays for Medicare (net of premiums and other offsetting receipts), Medicaid, the Children’s Health Insurance Program, subsidies for health insurance purchased through the marketplaces established under the Affordable Care Act, and related spending.
b. Includes payroll taxes other than those paid by the federal government on behalf of its employees; those payments are intragovernmental transactions. Also includes income taxes paid on Social Security benefits, which are credited to the trust funds.
c. Does not include outlays related to the administration of the program, which are discretionary. For Social Security, outlays do not include intragovernmental offsetting receipts stemming from the employer’s share of payroll taxes paid to the Social Security trust funds by federal agencies on behalf of their employees.
d. The net increase in the deficit shown in this table differs from the change in the trust fund balance for the associated program. It does not include intragovernmental transactions, interest earned on balances, or outlays related to the administration of the program.
Social Security and the Major Health Care Programs. Outlays for Social Security and the major health care programs (Medicare, Medicaid, subsidies offered through the health insurance marketplaces established under the Affordable Care Act and related spending, and the Children’s Health Insurance Program), net of offsetting receipts, are projected to increase from 11.5 percent of GDP in 2021 to 12.9 percent in 2030.19
Specifically, in CBO’s current baseline:
- Outlays for Social Security total 5.4 percent of GDP in 2021 and then rise steadily thereafter, reaching 6.0 percent of GDP in 2030.
- Outlays for Medicare, which equal 3.2 percent of GDP in 2021, rise to 4.3 percent of GDP in 2030.
- Federal outlays for Medicaid remain relatively stable as a percentage of GDP over the coming decade, averaging about 2 percent each year.
- Outlays for subsidies for health insurance purchased through the marketplaces and related spending are projected to average 0.2 percent of GDP per year through 2030.
Other Mandatory Programs. Aside from spending on Social Security and the major health care programs, all other mandatory spending is projected to drop to 3.7 percent of GDP in 2021, a 7.3 percentage-point decline from this year’s amount, as the effects of spending related to the coronavirus pandemic dissipate. (All other mandatory spending stood at 2.7 percent of GDP in 2019.) That category includes spending on income support programs (such as unemployment compensation and the Supplemental Nutrition Assistance Program), military and civilian retirement programs, most veterans’ benefits, and major agriculture programs.
In CBO’s baseline projections, other mandatory spending declines more gradually as a share of GDP after 2021, falling to 2.3 percent in 2030. The projected decline occurs in part because benefit amounts for many of those programs are adjusted for inflation each year, and inflation in CBO’s economic forecast is estimated to be less than the rate of growth in nominal GDP.20
Discretionary Spending. In accordance with section 257 of the Deficit Control Act, CBO bases its projections of discretionary spending for individual accounts on the most recent appropriations and applies the appropriate inflation rate to project funding for future years.21 After account-level projections are made, the total amount of budget authority is adjusted to comply with the caps on discretionary funding in 2021, when the caps expire. All budget authority after that year is assumed to grow with inflation for the duration of the baseline projection period. In CBO’s baseline, discretionary budget authority constrained by the caps for 2021 equals the combined defense and nondefense limits of $1,298 billion.
For activities not constrained by the caps, CBO projects funding of $121 billion in 2021, largely related to OCO ($80 billion), emergency requirements ($19 billion), and disaster relief activities ($18 billion). For activities not constrained by the caps, funding is generally assumed to grow with inflation from the amounts provided in 2020 or to adhere to specified limits for those activities while the caps are in place.
The projected funding for emergency requirements in 2021, $19 billion, is a sharp reduction from the $487 billion of such funding provided for 2020. Because of the unusual size and nature of the emergency funding provided in recently enacted legislation in response to the coronavirus pandemic, CBO, in consultation with the budget committees, deviated from the standard procedures for constructing its baseline and did not extrapolate the discretionary budget authority provided by the three new laws responding to the pandemic that were enacted after March 6, 2020.22
In CBO’s projections for the 2021–2030 period, total discretionary budget authority rises by about 2.3 percent a year, on average. Total discretionary outlays, however, decline from $1.6 trillion in 2021 to $1.5 trillion 2023, as spending of the pandemic-related funding provided in 2020 declines over those years. After 2023, outlays begin to rise again, reaching $1.8 trillion in 2030. Measured as a share of GDP, discretionary outlays decrease steadily, from 7.6 percent in 2021 to 5.8 percent in 2030. That 2030 percentage would be the smallest in any year since 1962 (the earliest year for which such data have been reported); by comparison, discretionary outlays averaged 8.3 percent of GDP over the past 50 years, although they were as low as 6.0 percent of GDP in 1999.
Defense. Budget authority for defense programs—including funding for OCO—is projected to equal $752 billion in 2021, a drop of $5 billion (or 0.7 percent) from amounts provided for 2020. (Defense funding in 2020 included $11 billion for emergency pandemic response that was not extrapolated in CBO’s baseline.) After 2021, defense funding is projected to grow by 2.3 percent a year, on average, reaching $919 billion in 2030. Outlays for defense programs are projected to be $733 billion in 2021 and then grow at a rate similar to that of budget authority, rising to $888 billion in 2030. Despite that growth, discretionary defense outlays as a percentage of GDP are projected to fall from 3.5 percent in 2021 to 2.9 percent in 2030—at which point they would match the lowest percentage of GDP such spending has measured since 1962.
Nondefense. Despite an increase in the cap on nondefense discretionary funding from 2020 to 2021, total budget authority for such programs is projected to drop significantly over those two years, from $1,139 billion to $668 billion, primarily because $461 billion in nondefense emergency funding for pandemic response provided in 2020—stemming from legislation enacted after March 6, 2020—is not extrapolated in CBO’s baseline. After 2021, funding is projected to grow by 2.3 percent a year, on average, reaching $819 billion in 2030.
As outlays associated with the pandemic response decline, discretionary outlays for nondefense programs are projected to decrease from $860 billion in 2021 to $761 billion in 2023. (CBO estimates that, by 2023, about 90 percent of the $469 billion in nondefense funding for pandemic response will have been spent—with nearly 50 percent of the total outlays occurring in 2020 alone.) After 2023, nondefense outlays begin to rise again in CBO’s projections, reaching $880 billion in 2030. Relative to the size of the economy, outlays for nondefense discretionary programs are projected to fall from 4.1 percent of GDP in 2021 to 2.9 percent of GDP in 2030—lower than in any year since 1962.
Net Interest. The main factors that affect the federal government’s net interest costs are the amount of debt held by the public and interest rates on Treasury securities.23 In CBO’s projections, debt held by the public roughly doubles over the next 11 years (in nominal terms), but interest rates, which have declined in recent months, remain very low in the next few years before rising in the second half of the projection period. In 2019, the average interest rate on debt held by the public was 2.5 percent; that rate is estimated to fall to 1.2 percent by the middle of the decade.
Initially, the effects of those lower rates more than offset the effects of the projected increase in federal debt. As a result, net outlays for interest in CBO’s baseline decline from 1.6 percent of GDP in 2020 to 1.1 percent in 2024 and 2025. Thereafter, the average interest rate on federal debt rises, reaching 2.1 percent in 2030. Those rising rates (along with the projected increases in federal debt) cause net outlays for interest to double as a share of GDP in the second half of the projection period, reaching 2.2 percent of GDP in 2030. That amount is 0.1 percentage point higher than the 50-year average as a share of economic output.
Revenues
Following declines in both 2020 and 2021, revenues under current law are projected to grow for the remainder of the decade. As a share of GDP, after declining from 16.3 percent in 2019 to 16.0 percent this year, total revenues are projected to reach 17.8 percent in 2030. The growth in revenues relative to GDP mainly reflects an increase in revenues from individual income taxes and, to a lesser extent, from corporate income taxes.
The largest movements over the next decade are as follows:
- Individual income tax receipts are projected to rise from 2021 to 2030 because of the expiration of temporary provisions enacted in response to the pandemic, scheduled increases in taxes after 2025 resulting from the 2017 tax act, real bracket creep, and other factors.
- Corporate income tax receipts are projected to decline further relative to GDP in 2021 and then increase relative to GDP in each year from 2021 to 2025 before gradually declining through 2030. In addition to the expiration of temporary provisions enacted in response to the pandemic, those receipts are boosted over the next decade by scheduled changes in tax rules enacted by the 2017 tax act. After 2025, corporate income taxes are projected to shrink as a share of the economy, mostly because of the end of the scheduled payments for a onetime tax on previously untaxed foreign profits.
- Estate and gift tax receipts are projected to increase relative to GDP after 2026, as the provision in the 2017 tax act that doubled the exemption amount expires.
- Remittances from the Federal Reserve, which began to rise in 2020, will continue to grow over the next several years as a result of significant increases in the central bank’s asset holdings, which boost its earnings, and because of lower short-term interest rates, which reduce the amounts it must pay to depository institutions on their reserves. CBO expects the Federal Reserve’s asset holdings to begin to slowly shrink as a share of GDP beginning in 2023.
- Excise taxes are projected to continue to decline as a share of GDP in each year after 2020, along with the tax bases on which many excise taxes are levied.
Individual Income Taxes. If current laws generally remained unchanged, receipts from individual income taxes would rise by 2.0 percentage points as a share of economic output over the next decade—from 7.4 percent in 2020 to 9.5 percent by 2030, CBO estimates.
Expiration of Temporary Tax Provisions Enacted in Response to the Pandemic. Temporary tax provisions enacted in response to the pandemic and economic disruption are expected to significantly reduce receipts in 2020 and 2021. Altogether, the end of those temporary provisions will boost receipts, measured as a share of GDP, by 0.9 percentage points between 2020 and 2030, CBO estimates.24
Provisions reducing individual income tax receipts include allowing noncorporate taxpayers to use the full amount of their business losses to offset nonbusiness taxes for tax years 2018 through 2020, the waiver of required minimum distribution rules for certain retirement accounts in calendar year 2020, and the relaxation of certain limits on the amount that taxable income may be reduced by deductions for charitable contributions in calendar year 2020. Some of the anticipated reduction in receipts stemming from those provisions in 2020 and 2021 will be recovered in future years.
Recently enacted legislation also included provisions that affect payroll taxes but, at least initially, those effects are being recorded in the budget as reductions in individual income tax collections. The CARES Act allows most employers to defer payment of their portion of certain payroll taxes this year. In addition, the Families First Coronavirus Response Act and the CARES Act provide employers refundable credits against payroll taxes for paid sick leave, family and medical leave, and employee retention.25
Scheduled Increases in Taxes After 2025. The second most significant factor pushing up taxes relative to economic output is the scheduled expiration, after tax year 2025, of nearly all the individual income tax law changes made by the 2017 tax act. The provisions that are scheduled to expire include lower statutory tax rates, the higher standard deduction, the repeal of personal exemptions, and the expansion of the child tax credit. Those expirations would cause tax liabilities to rise in calendar year 2026, boosting individual income tax receipts relative to GDP by 0.9 percentage points from 2020 to 2030.
Real Bracket Creep and Related Factors. The third most significant factor pushing up taxes relative to economic output arises from the way certain parameters of the tax system are scheduled to change over time in relation to growth in income, which reflects the effects of both real (inflation-adjusted) economic activity and inflation. The most important component of that effect, real bracket creep, occurs because the income tax brackets are indexed only to inflation. If income grows faster than inflation, as generally occurs when the economy is expanding, more income is pushed into higher tax brackets. Other parameters of the tax system, including the amount of the child tax credit, are fixed in nominal dollars and are not adjusted for inflation. In CBO’s baseline, those factors boost projected revenues measured as a percentage of GDP by 0.5 percentage points from 2020 to 2030.26
Other Factors. Over the next decade, other factors would reduce projected receipts as a share of GDP by 0.2 percentage points, on net, in CBO’s estimation. Several factors contribute to that decline. First, CBO projects a decline in realizations of capital gains relative to the size of the economy. Those realizations have been larger in the past several years than their historical average share of GDP (after accounting for differences in applicable tax rates). CBO projects that such realizations will decline in 2021 and continue to gradually return to levels consistent with their historical average by 2030. Second, large payments of taxable unemployment insurance benefits in calendar year 2020 are expected to boost receipts in fiscal years 2020 and 2021, but payments are projected to decline thereafter as pandemic-related benefits expire and as the economy recovers, reducing receipts over the next decade.
Those declines are offset in part by reallocations between payroll and income taxes. As discussed above, amounts recorded by the Treasury as payroll taxes for 2020 reflect estimates made before the onset of the pandemic. The effects of the subsequent declines in wages on payroll taxes were recorded as reductions in individual income taxes in 2020. CBO anticipates that those circumstances will not reoccur in 2021 and that the Treasury will make reallocations between payroll and individual income taxes to correct for misallocations made in 2020, further boosting income tax receipts recorded in 2021 and 2022. In addition, receipts will increase as rules allowing accelerated depreciation deductions for certain business investments are scheduled to phase out between 2022 and 2027.
Corporate Income Taxes. Following sharp declines in 2020 and 2021, CBO projects that, under current law, corporate income tax receipts would rise through 2025, reaching 1.4 percent of GDP, up from 0.6 percent in 2021. After 2025, receipts would begin to decline, falling to 1.3 percent of GDP in 2030. That pattern reflects the expiration of temporary tax provisions enacted in response to the pandemic, provisions of the 2017 tax act, and other factors.
Expiration of Temporary Tax Provisions Enacted in Response to the Pandemic. The CARES Act made several changes to business taxation that CBO anticipates will reduce receipts by more in 2020 and 2021 than in future years. Most notably, the act temporarily modifies the way businesses can use net operating losses to offset taxable income. Some of the revenue reductions in 2020 and 2021 will reflect losses that would otherwise have been available to deduct in future years. Altogether, CBO expects the expiration of the temporary NOL rules and other provisions included in the CARES Act to boost corporate income tax receipts as a share of GDP by 0.4 percentage points by 2030.
Provisions of the 2017 Tax Act. Some provisions of the 2017 tax act include scheduled changes over the next decade that will increase corporate taxes by reducing allowable deductions or increasing tax rates on certain types of income. Those changes contribute 0.1 percentage point to the increase in receipts as a share of GDP between 2020 and 2030.
Most significantly, provisions allowing firms to immediately deduct from their taxable income 100 percent of their investments in equipment are scheduled to phase out between 2023 and 2026. Additionally, in 2022, a stricter limit on the deductibility of interest expenses will take effect, and firms will be required to capitalize and amortize certain expenditures for research and experimentation as they are incurred over a five-year period, rather than immediately deducting them. Rules related to the taxation of profits abroad, including the end of the scheduled payments for a onetime tax on certain foreign profits, will also change in 2026.27
Other Factors. Over the next decade, other factors raise projected receipts as a share of GDP by 0.1 percentage point. In CBO’s projections, taxable corporate profits increase slightly relative to GDP over the next decade. That anticipated increase in profits causes corporate tax receipts to rise as a share of the economy. In addition, a number of tax provisions that were extended temporarily by the Further Consolidated Appropriations Act, 2020, are scheduled to expire after 2020, which also boosts projected receipts over the next several years.
Estate and Gift Taxes. Revenues from estate and gift taxes are projected to rise from just below 0.1 percent of GDP in 2020 to just above 0.1 percent in 2027 and subsequent years, after a provision of the 2017 tax act that doubled the amount of the estate and gift tax exemption expires at the end of calendar year 2025.
Payroll Taxes. Receipts from payroll taxes, which fund social insurance programs—primarily Social Security and Medicare—typically remain stable as a share of wages because workers’ earnings constitute most of the payroll tax base. However, CBO expects those receipts to decline sharply from 6.4 percent of GDP in 2020 to 5.9 percent in 2021. As discussed above, amounts recorded by the Treasury as payroll taxes for 2020 reflected estimates made before the onset of the pandemic. The effects of subsequent declines in wages are expected to first become evident in 2021. CBO also anticipates that the Treasury will make reallocations between payroll and individual income taxes to correct for allocations made in 2020, further reducing the amount of payroll taxes recorded in 2021 and 2022. CBO expects payroll taxes to rise between 2021 and 2024 as states make larger deposits of revenues from unemployment insurance taxes, before returning to more typical levels by 2030. By that year, receipts from payroll taxes would equal 5.9 percent of GDP, about the same as in 2021.
Remittances From the Federal Reserve. After rising to 0.4 percent of GDP in 2020, remittances from the Federal Reserve are projected to continue to rise along with growth in its asset holdings, totaling 0.6 percent of GDP for 2022 through 2026, before declining to 0.2 percent of GDP by 2030, the same share as in 2019, before the onset of the pandemic. That decline after 2026 occurs because of rising short-term interest rates, which increase the interest the Federal Reserve pays on reserves, and because CBO forecasts that the central bank’s asset holdings will decline as a share of GDP.
Receipts From Other Sources. Receipts from all other sources are expected to remain at about the same share of GDP over the next decade. Customs duties, which are assessed on certain imports, are projected to remain between 0.3 percent and 0.4 percent of GDP throughout the next decade. Those duties include tariffs imposed by the Administration beginning in 2018 that have increased customs duties by roughly 0.2 percent of GDP.28 CBO’s baseline incorporates the assumption that tariffs, along with any subsequent exemptions provided by the Administration, continue throughout the projection period at the rates in effect as of June 26, 2020, when the agency completed its economic forecast.29
The federal government also collects revenues in the form of miscellaneous fees and fines. CBO projects that, under current law, revenues from those sources would grow at about the same pace as GDP through 2030.
Uncertainty in Budget Projections
CBO’s baseline budget projections are intended to show what would happen to federal spending, revenues, and deficits and debt if current laws governing spending and taxes generally remained the same. Changes to laws—particularly those affecting fiscal policies—that cause them to differ from the laws underlying CBO’s baseline projections could lead to budgetary outcomes that diverge considerably from those in the baseline. For example, CBO’s deficit estimate for 2020 has increased by more than $2 trillion since March, largely as a result of laws that have been enacted since those projections were published.
Even if federal laws remained the same for the next decade, actual budgetary outcomes would differ from CBO’s baseline projections because of unanticipated changes in economic conditions and in other factors that affect federal spending and revenues. Because of the ongoing coronavirus pandemic, the current projections are subject to an unusually high degree of uncertainty. That uncertainty stems from many sources, including incomplete knowledge about how the pandemic will unfold, how effective monetary and fiscal policy will be, and how global financial markets will respond to the substantial increases in government deficits and debt. CBO aims for its projections to be in the middle of the distribution of possible outcomes, given the baseline assumptions about policies governing federal taxes and spending, and recognizes that actual outcomes will typically differ from any such projections.
CBO’s projections of outlays and revenues and, therefore, of deficits and debt depend in part on the agency’s economic projections for the coming decade, which include forecasts for such variables as interest rates, inflation, and growth in productivity. Discrepancies between those forecasts and actual economic outcomes can cause significant differences between baseline budget projections and budgetary outcomes.
Although the agency’s current economic and budget projections are subject to an unusually high degree of uncertainty, particularly in the near term, historical experience gives some indication of the magnitude of the uncertainty of budget projections.30 On the basis of an analysis of its past projections, CBO estimates that there is approximately a two-thirds chance that, under current law, the deficit in 2021 would be between 7.6 percent and 9.7 percent of GDP. (The baseline projection is 8.6 percent.) The range in 2025 would be larger: CBO estimates that, under current law, there is approximately a two-thirds chance that the deficit would be between 2.8 percent and 6.6 percent of GDP in that year. (The baseline projection is 4.7 percent.)
1. See Congressional Budget Office, Baseline Budget Projections as of March 6, 2020 (March 2020), www.cbo.gov/publication/56268. On April 24, 2020, CBO released a preliminary assessment of deficits in 2020 and 2021 that anticipated a budget shortfall of $3.7 trillion in 2020. That analysis was based on a rough assessment of the overall changes in federal spending and revenues that had occurred since March but—unlike this report—was not a comprehensive update of the agency’s baseline projections.
2. The baseline projections described in this report incorporate the effects of legislation enacted through August 4, 2020. The projections do not reflect the budgetary effects of tariffs the United States reimposed on imports of aluminum from Canada beginning on August 6, 2020, nor do they account for the four administrative actions announced by the President on August 8, 2020.
3. Discretionary funding in CBO’s March 2020 baseline projections followed the typical treatment: Funding for activities designated as emergency requirements was projected to continue in the future, with increases for inflation in each year after 2020.
4. Because October 1 will fall on a weekend in 2022, 2023, and 2028, certain payments that are due on those days will be made at the end of September instead, thus shifting them into the previous fiscal year. In CBO’s projections, those shifts noticeably boost projected outlays and deficits in fiscal years 2022 and 2028 but reduce them in fiscal years 2024 and 2029. If not for those shifts, the deficit would decline in each year between 2021 and 2027 and would increase in each year between 2028 and 2030.
5. For more details on other means of financing in particular and federal debt in general, see Congressional Budget Office, Federal Debt: A Primer (March 2020), www.cbo.gov/publication/56165.
6. CBO estimates that the Treasury will maintain a large cash balance, of nearly $1 trillion, at the end of 2020 to provide it with more flexibility to manage cash flows during the financial uncertainty created by the coronavirus pandemic. See Department of the Treasury, “Report to the Secretary of the Treasury From the Treasury Borrowing Advisory Committee of the Securities Industry and Financial Markets Association” (press release, May 5, 2020), https://go.usa.gov/xfdQd.
7. In accordance with the Federal Credit Reform Act, the costs of such credit programs are recorded in the budget on an accrual basis, incorporating projected future cash flows in an up-front estimate of the net subsidy costs.
8. Each year, some mandatory programs are modified by provisions in annual appropriation acts. Such changes may increase or decrease spending for the affected programs for one or more years. In addition, some mandatory programs, such as Medicaid, the Supplemental Nutrition Assistance Program, and benefits for Coast Guard retirees and annuitants, are considered mandatory but require benefits to be paid from amounts provided in appropriation acts. Section 257 of the Deficit Control Act requires CBO to project outlays for those programs as if they were fully funded, regardless of the amounts actually appropriated.
9. Section 257 of the Deficit Control Act also requires CBO to project spending for certain mandatory programs beyond their scheduled expiration and to project spending for entitlement programs, including Social Security and Medicare, under the assumption that they will be fully funded and thus will be able to make all scheduled payments even if the trust funds associated with those programs do not have sufficient resources to make full payments. Other rules that govern the construction of CBO’s baseline have been developed by the agency in consultation with the House and Senate Committees on the Budget. For further details, see Congressional Budget Office, How CBO Prepares Baseline Budget Projections (February 2018), www.cbo.gov/publication/53532.
10. Borrowers who received Paycheck Protection Program loans before June 5, 2020, have the option to choose an 8-week forgiveness period rather than a 24-week forgiveness period. All such loans borrowed on or after June 5, 2020, include only the 24-week forgiveness period.
11. The Treasury has classified all of the rebates paid this year as outlays rather than as reductions in revenues.
12. CBO does not estimate those revisions to subsidy costs; rather, those totals reflect the amounts that the Office of Management and Budget recorded in fiscal year 2020.
13. The budget authority for highway programs is provided in authorizing legislation and is considered mandatory.
14. Budget authority is the funding provided by federal law to incur financial obligations that will result in immediate or future outlays of federal government funds. Outlays are the amount of money spent each year.
15. Most discretionary funding is limited by caps on discretionary appropriations that were originally specified in the Budget Control Act of 2011 (P.L. 112-25) and modified by subsequent legislation. For more information on the adjustments to the discretionary funding caps, see Congressional Budget Office, Sequestration Update Report: August 2020 (August 2020), www.cbo.gov/publication/56498. Under current law, separate caps exist for defense and nondefense funding through 2021. If the total amount of discretionary funding provided in appropriation acts for a given year exceeds the cap for either category, the President must sequester—or cancel—a sufficient amount of budgetary resources (following procedures specified in the Budget Control Act) to eliminate the breach.
16. In its cost estimate for the CARES Act, CBO classified all funding provided in division A as mandatory. After consulting with the Office of Management and Budget, CBO classified nearly $2 billion of that funding as discretionary in the September baseline.
17. The amount that is constrained by the caps—$1,303 billion—is $15 billion more than the overall limit on discretionary funding for this year; that excess occurs because appropriation acts for 2020 included provisions that, on net, were estimated to reduce budget authority for mandatory programs. When appropriation acts include changes that reduce mandatory funding, the estimated savings are credited against the discretionary funding provided by those acts when assessing whether the appropriation acts comply with the caps. Once those acts become law, however, any such savings are incorporated into CBO’s baseline projections for mandatory spending.
18. Although individuals received nearly $300 billion in refundable tax credits for recovery payments in 2020, the Treasury has classified that amount entirely as an outlay.
19. Offsetting receipts primarily include payments of premiums, recoveries of overpayments made to providers, and amounts paid by states from savings on Medicaid’s prescription drug costs.
20. For more details about CBO’s most recent economic forecast, see Congressional Budget Office, An Update to the Economic Outlook: 2020 to 2030 (July 2020), www.cbo.gov/publication/56442.
21. The Deficit Control Act specifies which measures of inflation CBO should use: Discretionary funding related to federal personnel is adjusted by using the employment cost index for wages and salaries of workers in private industry; other discretionary funding is adjusted by using the gross domestic product price index.
22. About $8 billion in emergency funding provided by the first law enacted in response to the coronavirus pandemic, the Coronavirus Preparedness and Response Supplemental Appropriations Act, was incorporated into CBO’s previous baseline and is included in this baseline in the usual way: The associated budget authority is projected into the future and increased for inflation in each year after 2020. The other 2020 emergency funding projected in the baseline stems from appropriations contained in regular funding bills and was mostly for defense.
23. Inflation rates also affect net outlays for interest, mostly for Treasury inflation-protected securities, which differ from other securities in that their principal amounts are adjusted to account for inflation.
24. The CARES Act provided a refundable tax credit, the recovery rebate for individuals, which is estimated to increase the deficit in 2020 by $272 billion. The Treasury has classified all of the rebates paid this year as outlays rather than reductions in revenues. For further information, see Congressional Budget Office, cost estimate for H.R. 748, the CARES Act, Public Law 116-136 (April 16, 2020, revised April 27, 2020), www.cbo.gov/publication/56334.
25. For further information, see Congressional Budget Office, cost estimate for H.R. 748, the CARES Act, Public Law 116-136 (April 16, 2020, revised April 27, 2020), www.cbo.gov/publication/56334, and cost estimate for H.R. 6201, the Families First Coronavirus Response Act, Public Law 116-127 (April 2, 2020), www.cbo.gov/publication/56316.
26. See Congressional Budget Office, “How Income Growth Affects Tax Revenues in CBO’s Long-Term Budget Projections” (presentation, June 2019), www.cbo.gov/publication/55368.
27. For additional explanation of the tax provisions included in the 2017 tax act, see Congressional Budget Office, The Budget and Economic Outlook: 2018 to 2028 (April 2018), pp. 108–110, www.cbo.gov/publication/53651.
28. The Administration’s recent actions on tariffs were taken under authority granted in section 232 of the Trade Expansion Act of 1962 and sections 201 and 301 of the Trade Act of 1974.
29. Specifically, CBO’s baseline projections incorporate the assumption that, in cases in which the Administration exercises its broad authority to impose tariffs without legislative action, the tariffs in effect on June 26, 2020, would continue permanently without planned or unplanned changes. The tariffs imposed during the past two years include those on imports of solar panels and certain appliances, which took effect on February 7, 2018; on steel and aluminum imports from most countries, which took effect on March 23, 2018; and on a range of products imported from China, the first of which took effect on July 6, 2018.
On August 6, 2020, the United States reimposed tariffs on imports of aluminum from Canada at a rate of 10 percent. Those imports had previously been exempted, as of May 19, 2019, from the aluminum tariffs imposed on most other countries. Those tariffs, which were imposed after this analysis was completed, are not included in CBO’s current baseline projections.
30. See Congressional Budget Office, An Evaluation of CBO’s Past Deficit and Debt Projections (September 2019), www.cbo.gov/publication/55234.
Appendix: Changes in CBO’s Baseline Projections
Overview
The Congressional Budget Office estimates that if no new legislation affecting spending and revenues is enacted, the budget deficit for fiscal year 2020 will total $3.3 trillion. That amount is $2.2 trillion more than the $1.1 trillion deficit the agency estimated in March 2020, when it last updated its baseline budget projections—a difference mostly attributable to the enactment of new legislation (see Figure A-1).1 CBO also now projects that if current laws generally remained in place, the cumulative deficit for the 2021–2030 period would be $13.0 trillion. That amount is $0.1 trillion less than the $13.1 trillion in the agency’s March 2020 baseline projections, reflecting a decrease stemming from economic changes that more than offsets increases from legislative and technical changes.
Figure A-1.
Changes in CBO’s Baseline Projections of Deficits Since March 6, 2020
Trillions of Dollars

Source: Congressional Budget Office.
CBO’s March 2020 baseline incorporated the effects of legislation enacted through March 6, 2020, including the Coronavirus Preparedness and Response Supplemental Appropriations Act, 2020 (Public Law 116-123, enacted on March 6, 2020).
The current baseline includes three major laws enacted in response to the 2020 coronavirus pandemic that were not incorporated into CBO’s March 2020 baseline. Those three laws are the Families First Coronavirus Response Act (P.L. 116-127, enacted on March 18, 2020); the Coronavirus Aid, Relief, and Economic Security Act (P.L. 116-136, enacted on March 27, 2020); and the Paycheck Protection Program and Health Care Enhancement Act (P.L. 116-139, enacted on April 24, 2020).
For the 2021–2030 period, the costs or savings in debt service resulting from the changes in deficits are included in the categories “Legislative Changes” and “Other Economic and Technical Changes.”
When CBO updates its baseline budget projections, it classifies the revisions it makes as either legislative, economic, or technical changes:
- Legislative changes result from laws enacted since the agency published its previous baseline projections and generally reflect the budgetary effects reported in CBO’s cost estimates at the time the legislation was enacted.2 The 2020 coronavirus pandemic has, however, continued to affect many of the factors underlying CBO’s original cost estimates of legislation enacted since March 2020. For certain programs, including the Paycheck Protection Program (PPP) and the expansion of unemployment benefits, the agency updated its assessment of the effects of that legislation and incorporated the results in the baseline projections presented here.3
- Economic changes arise from changes the agency has made to its economic forecast (including those made to incorporate the macroeconomic effects of recently enacted legislation).4
- Technical changes are revisions to projections that are neither legislative nor economic.5
The $2.2 trillion increase in the estimated deficit for 2020 is the net result of the following changes:
- A $2.3 trillion increase attributable to legislative changes stemming primarily from laws enacted to address the coronavirus pandemic and the resulting economic disruption,
- A $0.3 trillion increase resulting from economic changes, and
- A $0.4 trillion decrease attributable to technical changes (see Table A-1).
Table A-1.
Changes in CBO’s Baseline Projections Since March 6, 2020
Billions of Dollars

Source: Congressional Budget Office.
SNAP = Supplemental Nutrition Assistance Program; * = between -$500 million and $500 million.
a. Because of how the Treasury is recording the effects of certain provisions of new laws, CBO has adjusted some estimates to include amounts as increases in outlays that were shown in initial cost estimates as reductions in revenues and vice versa. Those shifts have no effect on the deficit.
b. Primary deficits exclude net outlays for interest.
The $0.1 trillion decrease in the agency’s projected cumulative deficit for the 2021–2030 period stems from the following changes:
- Legislative changes increased projected deficits by $0.5 trillion, primarily because of increases in outlays resulting from provisions of legislation enacted to address the coronavirus pandemic and the resulting economic downturn.
- Economic changes reduced deficits by $1.4 trillion. Most significantly, the agency revised its projections of interest costs downward by $2.3 trillion because it lowered its forecasts of interest rates considerably. That reduction more than offset the projected increase in deficits resulting from the lower revenues associated with lower projections of gross domestic product (GDP).
- Technical changes in the agency’s projections of revenues and outlays increased projected deficits over the period by a total of $0.8 trillion, on net. The single largest technical revision was a decrease of $0.3 trillion in CBO’s projections of individual income tax revenues.
As a result of those revisions, projected deficits over the 2021–2030 period are almost unchanged from CBO’s March projections. Primary deficits—that is, deficits excluding net outlays for interest—are now projected to be a total of $2.1 trillion more than they were in CBO’s March 2020 baseline projections. That increase in primary deficits is, however, fully offset by a reduction of $2.2 trillion in the agency’s projections of interest costs over that same period.
In March, the agency projected that debt held by the public would be $31.3 trillion (equal to 98 percent of GDP) at the end of 2030. CBO now projects that such debt would reach $33.5 trillion (or 109 percent of GDP) by the end of that year if current laws generally remained unchanged. That increase in projected debt is mostly driven by the large rise in the 2020 deficit. Additionally, the ratio of debt to GDP is projected to be higher throughout the 10-year projection period, partly because GDP is now expected to be lower than previously anticipated.
Legislative Changes
To account for legislation enacted after March 6, 2020, CBO increased its estimate of the deficit for 2020 by $2.3 trillion and increased projected deficits over the 2021–2030 period by a total of $0.5 trillion. Nearly all of those increases stem from legislation enacted to address the coronavirus pandemic and the related economic downturn. Over the 2020–2030 period, that legislation is projected to increase deficits by $2.6 trillion—boosting outlays by $2.2 trillion and decreasing revenues by $0.4 trillion (see Figure A-2).6
Figure A-2.
Deficit Increases Over the 2020–2030 Period From Legislation Enacted to Address the Coronavirus Pandemic, by Major Provision
Billions of Dollars

Sources: Congressional Budget Office; staff of the Joint Committee on Taxation.
The figure includes the effects of the three major laws enacted in response to the 2020 coronavirus pandemic that were not incorporated into CBO’s March 2020 baseline. Those laws are the Families First Coronavirus Response Act (Public Law 116-127, enacted on March 18, 2020); the Coronavirus Aid, Relief, and Economic Security Act (CARES Act, P.L. 116-136, enacted on March 27, 2020); and the Paycheck Protection Program and Health Care Enhancement Act (P.L. 116-139, enacted on April 24, 2020). The effects of the Coronavirus Preparedness and Response Supplemental Appropriations Act, 2020 (P.L. 116-123, enacted on March 6, 2020) were included in CBO’s March 2020 baseline and thus are not reflected in the figure.
The CARES Act authorized the Secretary of the Treasury to provide up to $454 billion to fund emergency lending facilities established by the Board of Governors of the Federal Reserve System. However, because the income and costs stemming from that lending are expected to roughly offset each other, CBO estimates that the provision will have little effect on the deficit.
HHS = Health and Human Services; SNAP = Supplemental Nutrition Assistance Program.
a. In CBO’s initial estimate of the recovery rebates, the deficit effect was split almost evenly between an increase in outlays and a reduction in revenues. Because the Treasury is recording those rebates almost entirely as outlays, CBO has adjusted its projections accordingly. That shift from a reduction in revenues to an increase in outlays has no effect on the deficit.
b. In this figure, “Other Programs” includes the effects of the Medicare accelerated payments shown in Table A-2.
c. In CBO’s initial estimate of the costs of the payroll tax credits related to paid leave and employee retention, a portion of the deficit effect was shown as an increase in outlays. Because the Treasury is recording those credits almost entirely as a reduction in revenues, CBO has adjusted its projections accordingly. That shift from an increase in outlays to a reduction in revenues has no effect on the deficit.
Changes in Outlays Stemming From Legislation to Address the Coronavirus Pandemic and the Related Economic Downturn
Since March 6, 2020, lawmakers have enacted three major laws in response to the coronavirus pandemic:7
- The Families First Coronavirus Response Act (FFCRA, Public Law 116-127, enacted on March 18, 2020);
- The Coronavirus Aid, Relief, and Economic Security Act (CARES Act, P.L. 116-136, enacted on March 27, 2020); and
- The Paycheck Protection Program and Health Care Enhancement Act (P.L. 116-139, enacted on April 24, 2020).
CBO projects that outlays stemming from the provisions of that legislation will total $1.8 trillion in 2020 and $0.4 trillion between 2021 and 2030 (see Table A-2). Those legislative changes reflect both the original cost estimates produced by CBO and the staff of the Joint Committee on Taxation (JCT) and CBO’s baseline updates of the effects of certain components of the legislation. The baseline updates reflect new information about the ways in which the laws have been implemented, actual outlays observed so far this year, and changes to the agency’s economic forecast. Those updates increase projected deficits over the 11 years by about $0.2 trillion relative to the effects estimated by CBO and JCT when the laws were enacted.8
Table A-2.
Effects on Outlays of Legislation Enacted to Address the Coronavirus Pandemic and Economic Downturn
Billions of Dollars
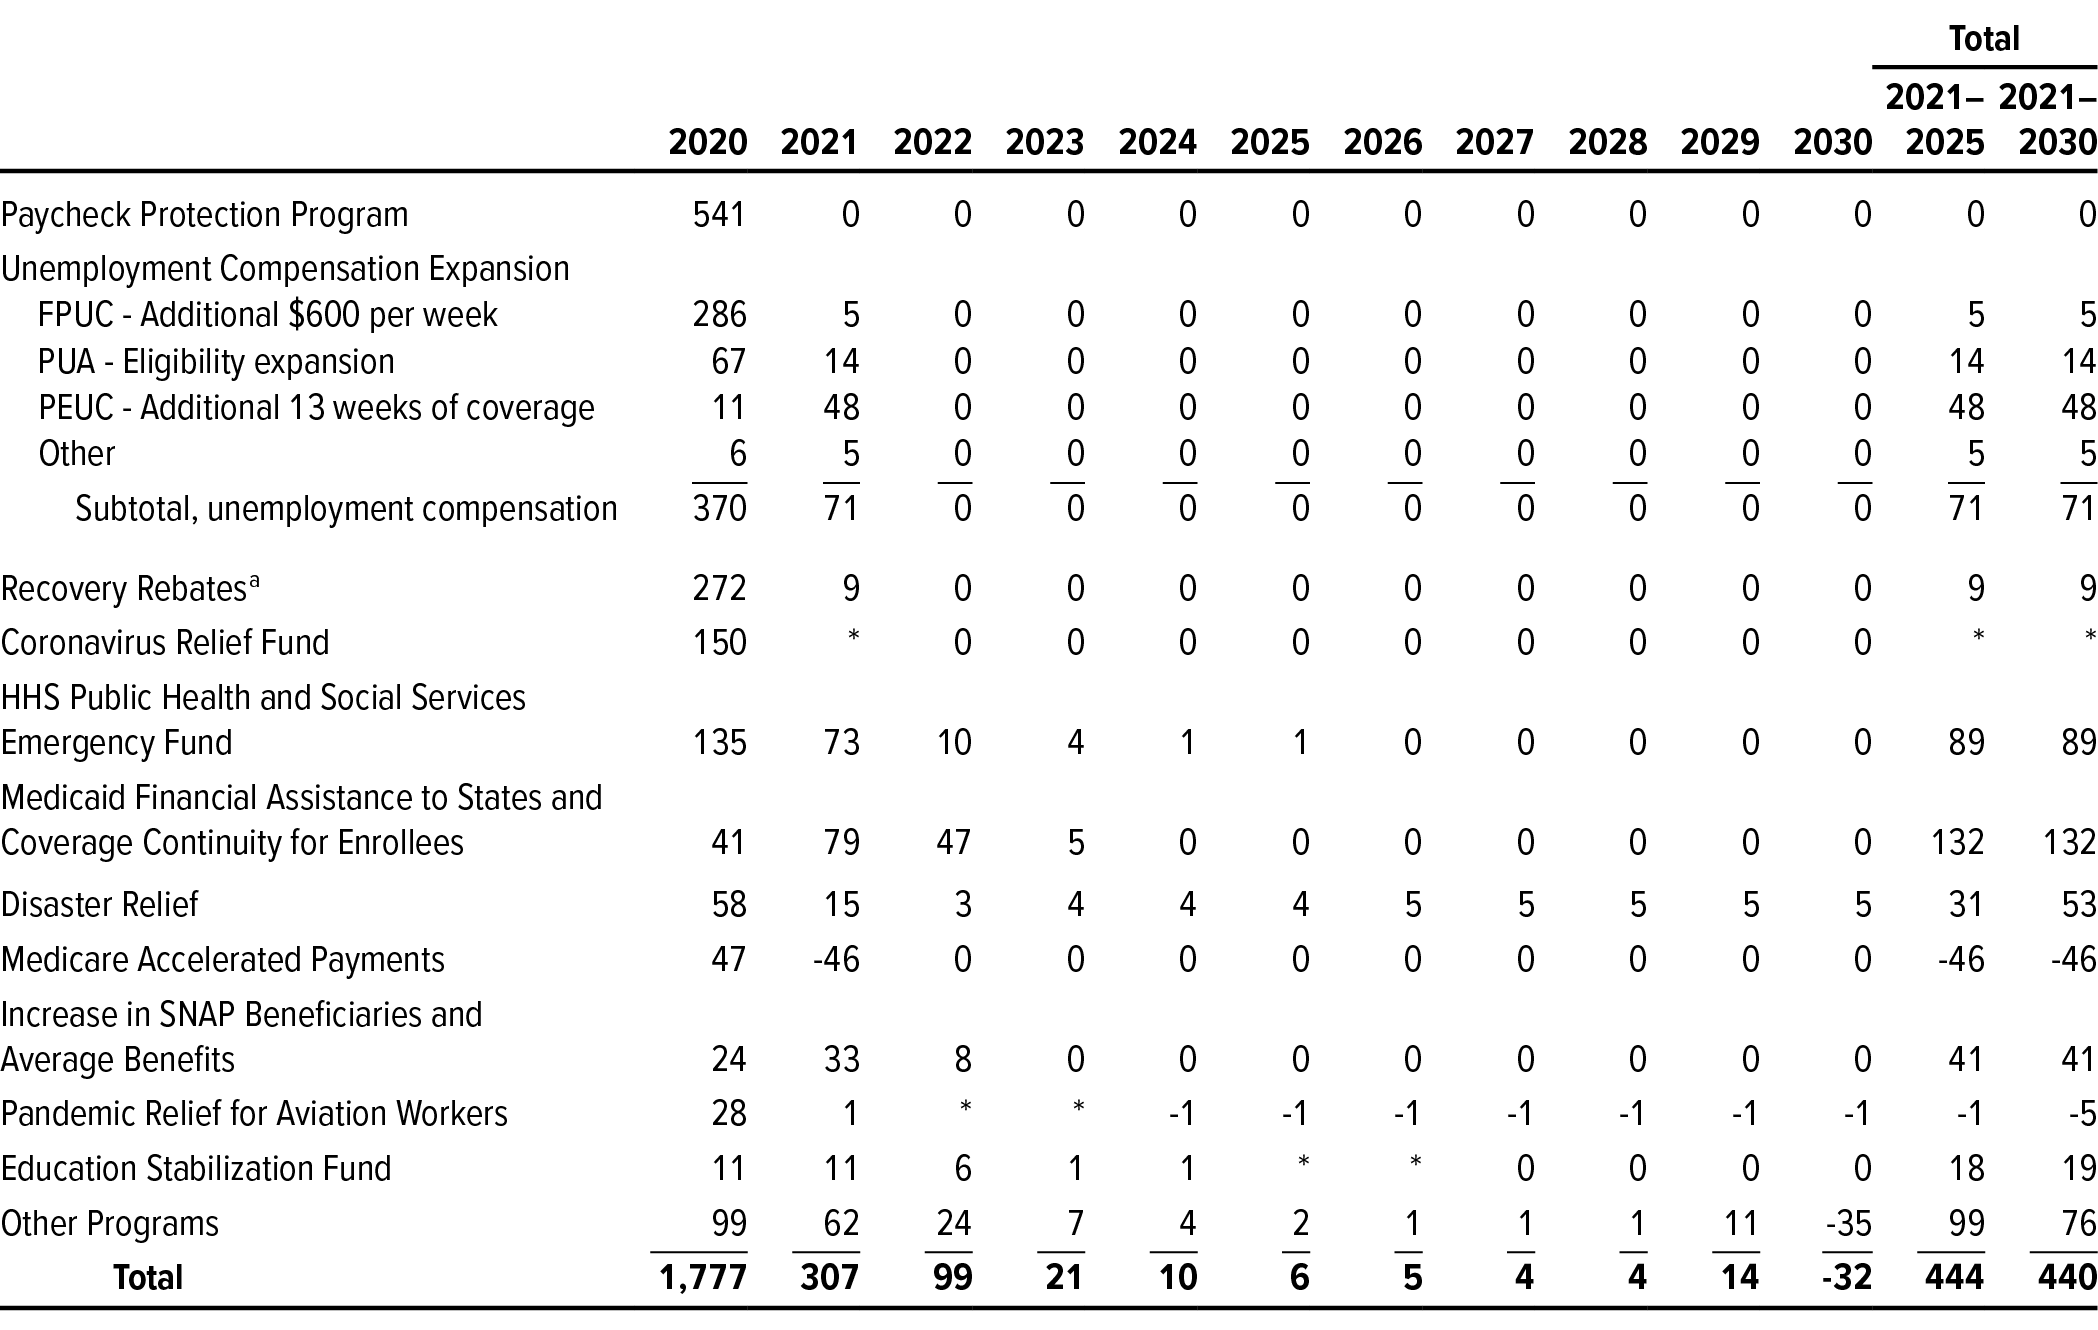
Source: Congressional Budget Office.
The table includes the effects of the three major laws enacted in response to the 2020 coronavirus pandemic that were not incorporated into CBO’s March 2020 baseline. Those three laws are the Families First Coronavirus Response Act (Public Law 116-127, enacted on March 18, 2020); the Coronavirus Aid, Relief, and Economic Security Act (CARES Act, P.L. 116-136, enacted on March 27, 2020); and the Paycheck Protection Program and Health Care Enhancement Act (P.L. 116-139, enacted on April 24, 2020). The effects of the Coronavirus Preparedness and Response Supplemental Appropriations Act, 2020 (P.L. 116-123, enacted on March 6, 2020) were included in CBO’s March 2020 baseline and thus are not reflected in the table.
The CARES Act authorized the Secretary of the Treasury to provide up to $454 billion to fund emergency lending facilities established by the Board of Governors of the Federal Reserve System. However, because the income and costs stemming from that lending are expected to roughly offset each other, CBO estimates that the provision will have little effect on the deficit.
FPUC = Federal Pandemic Unemployment Compensation; HHS = Health and Human Services; PEUC = Pandemic Emergency Unemployment Compensation; PUA = Pandemic Unemployment Assistance; SNAP = Supplemental Nutrition Assistance Program; * = between -$500 million and $500 million.
a. In CBO’s initial estimate of the recovery rebates, the deficit effect was split almost evenly between an increase in outlays and a reduction in revenues. Because the Treasury is recording those rebates almost entirely as outlays, CBO has adjusted its projections accordingly. That shift from an increase in outlays to a reduction in revenues has no effect on the deficit.
Most of the added spending is for mandatory programs. CBO estimates that the new laws will increase mandatory outlays by $1.5 trillion this year and $0.2 trillion over the 2021–2030 period. Most of that spending is for the PPP, an expansion of unemployment compensation, and recovery rebates.9
In addition, the new legislation enacted in response to the coronavirus pandemic provided $471 billion in discretionary funding that was designated as an emergency requirement.10 The largest appropriations, amounting to $351 billion, were for the Health and Human Services (HHS) Public Health and Social Services Emergency Fund, disaster relief, and the Education Stabilization Fund, which are discussed below. Outlays from those appropriations will amount to $185 billion this year and to $162 billion over the 2021–2030 period, CBO estimates. The remaining $120 billion in discretionary funding provided by lawmakers in response to the pandemic will increase outlays by $46 billion this year and by $72 billion over the 2021–2030 period, CBO projects. Roughly 30 percent of that funding was for transportation programs, 16 percent was for veterans’ programs (mostly medical care), and most of the rest was for defense, agriculture, housing, and income security programs.
Paycheck Protection Program. CBO projects that the PPP will increase outlays by $541 billion this year. Administered by the Small Business Administration (SBA), the PPP was established to provide guarantees of loans of up to $10 million to small businesses, nonprofit organizations, independent contractors, and other eligible entities. PPP loans are primarily for maintaining existing payrolls over 24 weeks following the loans’ disbursement.11 The full principal amount and any accrued interest on a PPP loan may be forgiven, although the amount that may be forgiven diminishes under certain circumstances if a borrower decreases the number of employees on its payroll or reduces employees’ compensation. CBO anticipates that most of those loans will ultimately be forgiven. Amounts that are not forgiven must be repaid to lenders within two or five years at an interest rate of 1 percent.
The demand for PPP loans suggests that the amount allocated to the program was more than sufficient to provide loans to the businesses that wanted them. At the beginning of the program, businesses requested an average of $28 billion in PPP loans each day, but demand for the loans had declined to about $200 million per day by mid-July. In addition, the SBA’s authority to guarantee PPP loans expired on August 9, 2020. Thus, CBO now projects $130 billion less in outlays for the PPP than it originally anticipated.12
Expansion of Unemployment Compensation. Legislation enacted in response to the coronavirus pandemic significantly expanded unemployment compensation by increasing the amount of the benefits, enlarging the pool of eligible workers, and extending the length of time that beneficiaries receive benefits. CBO estimates that the cost of the expansion will total $370 billion in 2020 and $71 billion in 2021.
Specifically, three major new programs were created:
- Federal Pandemic Unemployment Compensation (FPUC) provided an additional $600 each week to beneficiaries who receive regular or extended unemployment compensation benefits, trade readjustment allowances, short-time compensation (which provides benefits to workers who, instead of being laid off, are offered the opportunity to work reduced hours), Pandemic Unemployment Assistance benefits, or Pandemic Emergency Unemployment Compensation for weeks of unemployment ending on or before July 31, 2020. CBO projects that FPUC will increase outlays by $286 billion in 2020 and by $5 billion in 2021.
- Pandemic Unemployment Assistance (PUA) provides weekly benefits to the self-employed and others who are working less, or not at all, for reasons related to the pandemic and who are otherwise ineligible for unemployment compensation benefits. PUA pays benefits for up to 39 weeks beginning on or after January 27, 2020, and ending on or before December 31, 2020. CBO estimates that PUA will increase outlays by $67 billion in 2020 and by $14 billion in 2021.
- Pandemic Emergency Unemployment Compensation (PEUC) provides up to 13 additional weeks of benefits for people who have exhausted regular state and federal unemployment insurance benefits. The benefit amount is the same as the amount a beneficiary would receive as regular unemployment benefits. PEUC is projected to increase outlays by $11 billion in 2020 and by $48 billion in 2021.
CBO estimates that the expansion of unemployment compensation will cost $151 billion more in 2020, and $23 billion more in 2021, than anticipated in the agency’s April 2020 cost estimate.13 The agency raised its projections of those outlays because it now expects more people to collect unemployment compensation than it did when the preliminary estimates were produced.
Two factors have increased CBO’s projection of the number of FPUC beneficiaries, thus increasing its estimate of the cost of that program by $114 billion this year and by $5 billion in 2021. First, the agency has raised its forecast of the unemployment rate, resulting in more projected beneficiaries of the program. Second, significantly more beneficiaries have enrolled in PUA than originally projected. Because PUA beneficiaries also receive FPUC, that change has resulted in an increase in the projected number of FPUC beneficiaries.
Because eligibility requirements for PUA were not as strict as first anticipated, there have been many more beneficiaries enrolled in the program than CBO originally projected. As a result, CBO now projects that the costs of PUA will be $37 billion more this year, and $9 billion more in 2021, than the agency originally estimated.
CBO has reduced its projection of outlays for PEUC by $1 billion in 2020 and increased it by $9 billion in 2021. Those adjustments are based on actual outlays to date, as well as updated caseload projections for other programs.
Recovery Rebates. For tax year 2020, lawmakers created a refundable tax credit of $1,200 per person ($2,400 for joint filers), plus $500 for each dependent child under the age of 17. The credit phases out for taxpayers whose adjusted gross income exceeds $75,000 ($150,000 for joint filers; $112,000 for head-of-household filers). CBO projects that those recovery rebates will increase outlays by $272 billion in 2020 and by $9 billion in 2021 (and anticipates that the rebates will reduce revenues by $11 billion in 2021).14 In its estimates, the agency has shifted $3 billion of outlays from 2021 to 2020 to reflect actual spending so far this year.
Coronavirus Relief Fund. Lawmakers provided $150 billion to state, local, tribal, and territorial governments to help offset eligible expenses stemming from the pandemic. In addition to being pandemic-related, those expenses must be incurred between March 1 and December 30, 2020, and they must not have been included in a state’s most recent budget. CBO estimates that nearly all of those funds will be provided in 2020, increasing outlays by $150 billion. The relief funds are allocated as follows:
- $139 billion for state governments,
- $8 billion for tribal governments, and
- $3 billion for the District of Columbia and U.S. territories.
The funds are allocated on the basis of population within each category. Up to 45 percent of each state’s allocation may be provided directly to units of local government if those units certify to the Treasury that they have incurred pandemic-related expenses. Allocations to local governments are based on each locality’s share of its state’s population.
HHS Public Health and Social Services Emergency Fund. Lawmakers appropriated $225 billion for the Public Health and Social Services Emergency Fund of the Department of Health and Human Services. CBO projects that the funding will result in $135 billion in outlays in 2020 and $89 billion in outlays over the 2021–2025 period. Most of the funding, $175 billion, was dedicated to reimbursing health care providers (such as hospitals) for expenses related to health care or lost revenues as a result of the coronavirus pandemic. The remaining amount, including $16 billion for the Strategic National Stockpile, can be used to support the development and purchase of vaccines, therapeutic treatments and drugs, and medical supplies.
Because the funding dedicated to reimbursing health care providers is being spent faster than originally anticipated, CBO has shifted the timing of those outlays in its projection. As a result, the agency now projects $61 billion more in outlays in 2020 stemming from those appropriations than it did in its original estimate.
Medicaid Financial Assistance to States and Coverage Continuity for Enrollees. CBO projects that the changes to Medicaid enacted in response to the pandemic will increase outlays by $41 billion in 2020 and by $132 billion over the 2021–2030 period. The most significant provision among those changes was an increase in the federal medical assistance percentage (FMAP) for Medicaid by 6.2 percentage points for the duration of the coronavirus public health emergency.15 FMAP is the share of Medicaid costs paid by the federal government and is based on a formula that provides higher federal reimbursement to states with lower per capita incomes (and vice versa) relative to the national average. By law, states can receive an FMAP rate of no less than 50 percent and no more than 83 percent.
To receive the additional funds, states are required to maintain continuous coverage for people enrolled in Medicaid for the duration of the coronavirus public health emergency regardless of changes in their income or other eligibility criteria.16 In addition, states may not increase Medicaid premiums, enact stricter eligibility standards, or establish any cost sharing for services related to the coronavirus pandemic.
CBO initially estimated that this provision would increase outlays by $30 billion in 2020 and by $23 billion in 2021. Mostly because many more enrollees are remaining on Medicaid than initially estimated and because CBO increased its estimate of the length of the public health emergency, the agency now projects that the expansion will cost $11 billion more in 2020, and $108 billion more from 2021 through 2023, than it projected in its April 2020 cost estimate.17
Disaster Relief. In response to the coronavirus pandemic, lawmakers appropriated $115 billion for disaster relief ($20 billion of which was for Economic Injury Disaster Loans and is considered mandatory). Altogether, that funding is projected to increase outlays by $58 billion in 2020 and by $53 billion over the 2021–2030 period. The Federal Emergency Management Agency’s (FEMA’s) Disaster Relief Fund received $45 billion in funding, and the SBA received $70 billion. The funding for FEMA was allocated to reimburse state, local, and tribal governments and nonprofit organizations for certain expenses related to responding to the coronavirus pandemic; the SBA funding is meant to support loans for small businesses that have been harmed by the pandemic, including the funding for Economic Injury Disaster Loans, which were provided in the form of emergency advances that do not need to be repaid.
Because spending from the Disaster Relief Fund and spending on loans for small businesses have occurred much more slowly than anticipated, CBO has shifted the timing of those outlays in its projections. The agency now estimates that $30 billion less will be spent in 2020 than originally anticipated.
Medicare Accelerated Payments. Medicare can make accelerated payments to hospitals based on expected future health care claims, and those amounts are recouped by reducing Medicare’s payments for future claims. The CARES Act includes a provision that allows hospitals more time before they must repay those amounts. Although CBO initially expected that provision to have minimal budgetary effects, the agency now estimates that, on net, it will increase outlays in 2020 by $47 billion and lower outlays in 2021 by $46 billion.
Increase in Supplemental Nutrition Assistance Program Beneficiaries and Average Benefits. An expansion of the Supplemental Nutrition Assistance Program (SNAP, which helps people in low-income households purchase food) is expected to increase the number of beneficiaries in that program, increase benefits for certain households, and provide benefits to certain school children to replace meals they would otherwise have received at school. CBO projects that the expansion will increase outlays by $24 billion in 2020 and by $41 billion over the 2021–2030 period.
Pandemic Relief for Aviation Workers. Financial assistance to the airline industry for payroll support is projected to increase outlays by $28 billion in 2020 but to decrease them by $5 billion over the 2021–2030 period as companies repay a portion of the assistance.
Education Stabilization Fund. Lawmakers appropriated $31 billion for the Education Stabilization Fund to help educational institutions respond to the pandemic. CBO projects that the funding will increase outlays by $11 billion in 2020 and by $19 billion between 2021 and 2030.
Other Programs. Other programs associated with legislation enacted in response to the coronavirus pandemic will increase outlays by $99 billion this year and by $76 billion over the 2021–2030 period, CBO projects.
Changes in Outlays Stemming From Other Legislation
Although almost all of the changes in CBO’s projections of outlays are the result of legislation enacted to address the coronavirus pandemic and the related economic downturn, other legislation enacted since March has raised projected mandatory outlays by less than $1 billion for 2020 and by $17 billion over the 2021–2030 period. Nearly all of those changes stem from the enactment of the Great American Outdoors Act (P.L. 116-152), which established the National Parks and Public Land Legacy Restoration Fund to support deferred maintenance projects on federal lands.18
Changes in Debt Service
Before debt-service costs are taken into account, the changes that CBO made to its projections to reflect legislation enacted since March increased the deficit for 2020 by $2.3 trillion and the cumulative deficit for the 2021–2030 period by $0.3 trillion. The additional federal borrowing stemming from those larger annual deficits added $182 billion to CBO’s projection of total outlays for interest on federal debt.
Changes in Revenues
As a result of legislative changes, CBO has reduced its projections of revenues by $539 billion for 2020 and increased them by $153 billion for the 2021–2030 period. Almost all of the net decrease of $385 billion stems from the provisions of the FFCRA and the CARES Act. The revisions to the baseline associated with those two laws—that is, the changes CBO categorizes as legislative—reflect the estimates of the revenue effects produced by JCT on March 16, 2020, and April 23, 2020.19
The acts decrease revenues, on net, in 2020 by deferring some tax payments; suspending certain taxes; expanding available deductions, exclusions, and credits; and allowing greater use of losses to offset taxable income. Some of that decrease in revenues is offset by increased receipts in later years when, for example, deferred taxes are paid.
Individual Income Taxes. Most of the legislative changes to CBO’s projections of revenues stem from changes to individual income taxes. CBO reduced its projection of revenues from those taxes by $462 billion for 2020 but increased it by $114 billion for the 2021–2030 period. The reduction in 2020 stems from provisions of the FFCRA, which created payroll tax credits for employers required by that law to provide emergency paid sick leave and emergency paid family and medical leave, and from the CARES Act, which provided for deferral of payments of some payroll taxes, created payroll tax credits for employee retention, and relaxed the limitation on the amount of business losses that can be used to offset tax liability.20 The CARES Act also temporarily eliminated penalties for early withdrawals from retirement accounts and expanded certain exclusions and deductions that are anticipated to temporarily decrease revenues in 2021. The payroll tax credits created by the FFCRA and the CARES Act reduce tax payments in 2020 and 2021. Although some of those laws’ provisions affect payroll taxes, the Treasury is recording the effects in the budget—at least initially—as individual income tax reductions. After 2021, projected receipts of individual income taxes increase for legislative reasons, primarily because of payments in 2022 and 2023 of taxes deferred in 2020 and 2021.
Corporate Income Taxes. CBO reduced its estimate of corporate income taxes by $75 billion for 2020 but increased it by $45 billion for the 2021–2030 period. The reduction for 2020 results primarily from provisions of the CARES Act, which gave corporations an expanded ability to carry back refunds for net operating losses generated in 2018, 2019, and 2020. Those losses can be used to offset tax liability for up to five prior years. As of 2018, corporations could only carry forward net operating losses generated to offset future liability. Those provisions of the CARES Act will decrease corporate income taxes in 2020 and 2021 but increase them thereafter.
Payroll Taxes. As a result of provisions in the CARES Act and the FFCRA that affect taxable wages, CBO increased its estimate of payroll taxes by $3 billion for 2020 but decreased it by $4 billion over the 2021–2030 period.
Other Revenues. Because the CARES Act suspended certain excise taxes, CBO has reduced its projection of excise tax revenues by $4 billion in 2020 and by $2 billion over the 2021–2030 period.
Economic Changes
The economic forecast that underlies CBO’s baseline budget projections includes the agency’s projections of GDP, income, the unemployment rate, interest rates, inflation, and other factors that affect federal spending and revenues.21 The current projections are based on the latest economic forecast, which was completed on June 26, 2020, and reflects the agency’s estimates of the effects on the economy of legislation enacted before that date.
In the first quarter of 2020, the coronavirus pandemic and the social distancing resulting from it ended the longest economic expansion and triggered the deepest downturn in output and employment since the demobilization following World War II. CBO’s current economic forecast incorporates the agency’s estimates of the effects of the widespread economic disruption caused by the pandemic as well as the effects of the laws enacted to address the public health emergency and to directly assist households, businesses, and state and local governments.
The changes that CBO has made to its economic forecast have increased its estimate of the deficit for 2020 by $316 billion but have decreased its projections of deficits over the 2021–2030 period by a total of $1.4 trillion. Those budgetary effects stem largely from changes in CBO’s projections of interest rates, wages and salaries, inflation, and the unemployment rate (see Figure A-3). The reduction in deficits over the 10-year period results from a decrease in projected net interest outlays and spending for benefit programs, including Social Security and Medicare, partially offset by a reduction in tax revenues.
Figure A-3.
Changes in CBO’s Economic Forecast Since January 2020

Source: Congressional Budget Office.
The data shown are for fiscal years, and the 2019 values reflect the annual revisions to the national income and product accounts released by the Bureau of Economic Analysis on July 30, 2020.
a. Calculated using the consumer price index for urban wage earners and clerical workers.
Changes in Outlays
The revisions that CBO made to its economic forecast raised its estimate of outlays for the current year by $92 billion (or 2 percent) but decreased its projections of outlays for the 2021–2030 period by $3.5 trillion (or 6 percent). Most of the reduction in outlays projected for the latter period stems from two factors. First, CBO significantly reduced its forecast of interest rates, which decreased its projections of net interest costs by $2.3 trillion before changes in debt-service costs are accounted for. Second, the reduction in the agency’s forecast of inflation resulted in a decrease of about $0.8 trillion in projected outlays for Social Security and Medicare over the 2021–2030 period.
Mandatory Outlays. Because of changes the agency made to its economic forecast, CBO increased its estimate of mandatory spending for 2020 by $136 billion (or 5 percent) and decreased its projections for the 2021–2030 period by $851 billion (or 2 percent). The largest economic changes are reflected in CBO’s projections of outlays for Social Security.
Social Security. Projected outlays for Social Security over the 2021–2030 period decreased by a total of $536 billion (or 4 percent). Most of that reduction—$440 billion—is attributable to lower estimates of the cost-of-living adjustments (COLAs) that beneficiaries will receive in the next several years. Social Security’s COLAs are based on changes in the consumer price index for urban wage earners and clerical workers (CPI-W). To account for changes in its forecast of the CPI-W, CBO decreased its projection of the COLAs that beneficiaries will receive in January 2021 by 1.7 percentage points. The agency also decreased its projections of the COLAs in both January 2022 and 2023 by about 1 percentage point. The rest of the decrease in projected spending is the result of the agency’s downward revision to its projections of average wages, which lowered the initial benefits expected to be received by new Social Security claimants.
Medicare. CBO decreased its projections of Medicare outlays for the 2021–2030 period by $269 billion (or 3 percent) because of revisions it made to its economic forecast. Under current law, payment rates for much of Medicare’s fee-for-service sector (such as hospital care and services provided by home health agencies and skilled nursing facilities) are updated automatically. Those updates are based on changes in the prices of the labor, goods, and services that health care providers purchase, and they include an adjustment to account for gains in private nonfarm business productivity (the ability to produce the same output using fewer inputs, such as hours of labor) that occur over a 10-year period.22 CBO’s latest economic forecast includes large downward revisions to the growth of many prices. As a result of those revisions, the agency now expects payment rates to increase by smaller amounts between 2021 and 2030 than it had previously projected—a change that decreases projected Medicare outlays.
Unemployment Compensation. CBO increased its projection of spending on regular unemployment compensation by $128 billion for 2020 and by $126 billion (or 27 percent) for the 2021–2030 period, primarily because of a sharp increase in the forecast of the unemployment rate this year and next. In its previous economic forecast, the agency projected that the unemployment rate would be 3.5 percent in fiscal years 2020 and 2021. As a result of the economic downturn caused by the coronavirus pandemic, the agency now projects that the unemployment rate will be 8.8 percent in fiscal year 2020 and 9.1 percent in fiscal year 2021. Such a large increase in the unemployment rate will result in many more people receiving unemployment benefits and thus much more spending on unemployment compensation. That increase in spending is partially offset by lower projected wage growth, which results in lower projected average benefits. (The unemployment compensation discussed in this section refers to benefits provided under permanent law by the states in partnership with the federal government; such benefits flow through the unemployment trust fund and are considered federal outlays. Additional unemployment benefits stemming from recent laws enacted in response to the coronavirus pandemic are discussed in the section on legislative changes.)
Medicaid. The agency decreased its projections of Medicaid spending for the 2021–2030 period by $106 billion (or 2 percent), primarily because it reduced its forecasts of inflation. CBO revised downward its projections of growth in both the consumer price index for all urban consumers and the employment cost index for wages and salaries of workers in private industry (ECI) over the first few years of the projection period. It did so because new data indicate that inflation will be weaker than previously anticipated. Average benefit costs are projected to be lower as a result of that lower inflation.
Veterans’ Benefits and Services. CBO decreased its projections of outlays for mandatory veterans’ benefits over the 2021–2030 period by $51 billion (or 3 percent), largely because of reductions in its forecast of inflation. As is the case with Social Security, the COLAs that beneficiaries receive are based on the CPI-W. The agency decreased its projections of that measure of inflation, resulting in smaller COLAs and thus lower projected spending.
Other Mandatory Programs. CBO updated its projections of outlays for several other mandatory programs to reflect changes in its economic forecast; those changes resulted in both upward and downward adjustments to such outlays, decreasing projected outlays for the 2021–2030 period by a total of $16 billion, on net.
Discretionary Outlays. CBO’s baseline projections generally reflect the assumption that funding for discretionary programs keeps pace with inflation (unless such funding is constrained by statutory limits).23 Changes to the forecasts of the measures of inflation that CBO is required to use in developing its baseline projections of discretionary funding drove the economic changes in discretionary outlays. For discretionary funding related to federal personnel, the agency uses the ECI to prepare its projections; for other types of discretionary funding, the agency uses the GDP price index. As a result of significant decreases in the agency’s forecasts of those measures, discretionary funding over the 2021–2030 period is now projected to be lower than it was projected to be in March, and outlays for that period are now projected to be $254 billion (or 2 percent) smaller.
Net Interest. Economic changes caused CBO to reduce its baseline projections of net interest costs by $44 billion (or 12 percent) for 2020 and by $2.4 trillion (or 40 percent) for the 2021–2030 period. The main reason for that reduction is that the agency has substantially lowered its forecasts of both short- and long-term interest rates on Treasury securities since January. For 2020 to 2030, CBO decreased its forecast of the rate on 3-month Treasury bills by an average of 1.5 percentage points (or 70 percent) each year. The agency decreased its forecast of the rate on 10-year Treasury notes by an average of 1.2 percentage points (or 50 percent) in the first half of the period. As a result of those substantial reductions, the agency now projects that the average interest rate on debt held by the public for the period will be 60 percent lower than it projected in March. Primarily because of the lower projected interest rates, the agency decreased its projections of net interest outlays (and thus of deficits) by $45 billion in 2020 and by $2.3 trillion for the 2021–2030 period (before accounting for the resulting change in the amount of federal debt).
Because of those changes and others stemming from revisions to its economic forecast, CBO increased its projected deficit for 2020 by $0.3 trillion but reduced projected deficits for the 2021–2030 period by $1.4 trillion (before accounting for the resulting change in the amount of federal debt). The debt-service savings associated with those changes in projected deficits are estimated to equal $40 billion.
Changes in Revenues
As a result of revisions to its economic forecast, CBO reduced its estimate of revenues for 2020 by $223 billion (or 6 percent) and its projections for 2021 through 2030 by a total of $2.1 trillion (or 4 percent). The reduction in revenues for the entire 2020–2030 period stems from several lowered projections, among them a decrease in GDP and taxable income—primarily wages and salaries, proprietors’ income, and domestic and foreign profits. In addition, CBO lowered its projections of interest rates and of imports, which also affected the baseline revenue projections. Partially offsetting those factors are increases in the agency’s projections of states’ deposits of unemployment insurance taxes and of the amount of debt and securities held by the Federal Reserve.
Individual Income Taxes. In response to economic changes, CBO lowered its projections of total individual income tax revenues by $111 billion (or 6 percent) in 2020 and by $1.6 trillion (or 6 percent) over the 2021–2030 period. The largest source of the revision was a 6 percent reduction in projected wages and salaries over the 2020–2030 period. Projections of proprietors’ income, capital gains realizations, and distributions from pensions and IRAs also decreased.
Other factors partially offset those reductions. The agency lowered its forecast of inflation, thereby raising its projections of income tax revenues. (Because the tax brackets and other parameters of the individual income tax system are indexed to inflation, lower inflation pushes a larger portion of taxable income growth into higher tax brackets, thus raising income tax receipts.) The agency also lowered its forecast of interest paid on owner-occupied housing, which in turn reduced its projections of deductions for mortgage interest and raised projected income tax receipts.
Payroll Taxes. As a result of its latest economic forecast, CBO lowered its projection of payroll tax revenues by $89 billion (or 7 percent) for 2020 and by $656 billion (or 4 percent) for the 2021–2030 period. Nearly all of that reduction stems from a $9.5 trillion downward revision in the agency’s projections of wages and salaries and of proprietors’ income. An increase in the projection of state unemployment insurance deposits partially offsets some of that decrease.
Corporate Income Taxes. CBO lowered its projection of corporate income tax revenues by $30 billion (or 13 percent) for 2020 and by $277 billion (or 8 percent) for the period from 2021 to 2030 because of economic changes. That decrease occurred largely because the agency lowered its projections of domestic corporate profits by 3 percent over the 2020–2030 period and reduced its projections of foreign profits. Lowered forecasts of interest rates are among other factors contributing to the decrease in projected revenues from corporate income taxes.
Other Revenues. In response to economic changes, CBO increased its projection of Federal Reserve remittances by $13 billion (or 19 percent) for 2020 and by $491 billion (or 64 percent) over the 2021–2030 period—mostly because of actions taken by the Federal Reserve in response to the significant changes in the economic outlook. Those actions increased the Federal Reserve’s holdings of assets and the interest that the central bank earns from those assets. The lower interest rates in CBO’s current economic forecast partially offset the additional earnings on assets, thereby lowering remittances, but they also reduce the interest expenses the Federal Reserve pays to banks whose deposits it holds, thus increasing remittances.
CBO also lowered its projections of imports over the 2020–2030 period by a total of $2.9 trillion (or 10 percent). That change in the economic forecast reduced CBO’s projections of customs duties over the same period by $51 billion (or 5 percent).
Technical Changes
Technical changes—those changes that are neither legislative nor economic—caused CBO to decrease its estimate of the deficit for 2020 by $396 billion but to increase its projections of deficits over the 2021–2030 period by a total of $815 billion. Revisions to the agency’s projections of income and payroll taxes are the main reasons for the overall adjustments.
Changes in Revenues
Because of technical changes, CBO increased its estimate of revenues for 2020 by $425 billion (or 12 percent). Most of that increase stems from recent data on tax collections, which have indicated stronger revenues than expected. That strength suggests that employers have deferred a smaller share of 2020 taxes in recent months, which in turn reduces the offsetting increase in taxes in later years.
The agency has revised projected revenues downward, for technical reasons, by $735 billion (or 1.5 percent), on net, over the 2021–2030 period. Those reductions stem from changes to individual and corporate income taxes that reflect businesses’ responses to the coronavirus pandemic and the need for social distancing. (As businesses’ expenses increase, the share of businesses with taxable profits is reduced.) The net reductions also reflect new information about recent tax collections.
Individual Income Taxes. Because of technical changes, the agency increased its projection of individual income tax revenues by $315 billion (or 18 percent) for 2020 but lowered it by $324 billion (or 1 percent) for the 2021–2030 period. Those changes are the result of several offsetting factors. Most of the increase in 2020 and 2021 derives from the fact that the amount of taxes withheld from paychecks over the past several months has been much greater than expected, given the estimated declines in wages and the initial estimates of the reductions to withholding that would result from recently enacted tax provisions. Those provisions, which affect payroll taxes but are being recorded in the budget as reductions in individual income taxes, include the option for employers to defer payment of their portion of most payroll taxes on wages paid from March 27, 2020, through December 31, 2020. The provisions also include tax credits to compensate employers for paid sick leave, family and medical leave, and employee retention. Although the reasons for the larger-than-expected amount of withheld taxes are not yet fully known, less take-up by employers of the option to defer payroll taxes is probably a significant factor. The larger revenues in 2020 and 2021 from that smaller amount of deferred taxes are largely offset by corresponding reductions in 2022 and 2023.
Other factors increasing individual income taxes are greater taxable unemployment benefits and an upward revision to the projected share of wages and salaries going to high-wage earners, which was based on data showing that low-wage workers have been disproportionately affected by the economic disruption caused by the pandemic. For any given amount of aggregate wages, when high-wage earners’ share of wages and salaries increases, individual income tax revenues rise because of the progressive nature of income tax rates in the United States. As a result of that revision, CBO increased its projections of individual income tax receipts over the next decade by about $120 billion. (That revision is partially offset by a corresponding but smaller reduction in payroll taxes, which is described below.)
One factor reducing individual income tax receipts in 2020, but netting to zero over the full forecast period, is related to the way tax payments are attributed to individual or payroll taxes. As a result of the Treasury’s administrative practice, estimates of employment dictate the portion of tax payments remitted by employers that is initially allocated to payroll taxes. As more information becomes available (including detailed information about tax returns), periodic reallocations are made to revise past allocations. Lower wages in 2020 will reduce both payroll and income tax payments, but that reduction is initially reflected only as lower individual income tax receipts. CBO projects that, as a result, corresponding adjustments in future fiscal years will increase income tax receipts, generating offsetting technical changes.
The net increase in individual income taxes for technical reasons in 2020 is more than offset by reductions in subsequent periods, amounting to a decrease of $324 billion (or 1 percent) over the 2021–2030 period. The most significant factors leading CBO to lower its projections of individual income tax receipts include a downward revision to the effective tax rate on business income over the next several years and a reduction in projections of taxable withdrawals from retirement accounts—the latter a response to recent data indicating that assets in retirement accounts are worth less than previously anticipated.
Corporate Income Taxes. For technical reasons, CBO increased its projection of corporate income tax receipts by $23 billion (or 10 percent) for 2020 but decreased it by $207 billion (or 6 percent) for the 2021–2030 period. The increase for 2020 reflects the expectation that some refunds originally anticipated to be paid to businesses this year will instead be paid in 2021. The decrease in subsequent years is largely attributable to a downward revision to the share of profits in the national income and product accounts (NIPA) that represents taxable income, reflecting firms’ adjusting investments and operations in response to the pandemic and the related economic downturn. Declines in the taxable share of NIPA profits also occurred following previous recessions.
Payroll Taxes. For technical reasons, the agency has increased its estimate of payroll taxes for 2020 by $97 billion (or 7 percent). That change is driven primarily by the Treasury’s accounting procedures (described above) that also affect individual income taxes: Lower wages in 2020 will initially be reflected in individual income taxes rather than in payroll taxes; that allocation will be corrected in subsequent years. CBO has therefore increased the amount of payroll taxes that it estimates will be recorded in 2020 and correspondingly reduced the amounts of payroll taxes in subsequent periods.
CBO reduced its projections of payroll taxes for the 2021–2030 period by a total of $110 billion (or 1 percent), largely because of an upward revision in high-wage earners’ projected share of total wages and salaries. That change reduces payroll taxes because it lowers the share of income below the maximum amount subject to Social Security payroll taxes (currently $137,700). That revision is more than offset by a corresponding increase in individual income tax revenues, as described above.
Customs Duties. For technical reasons, the agency decreased its projections of customs duties by $4 billion (or 5 percent) for 2020 and by $72 billion (or 7 percent) over the 2021–2030 period. That change reflects the Administration’s actions to reduce tariffs on a range of imports from China.24
Other Revenues. CBO lowered its projection of revenues from other sources by $6 billion (or 3 percent) for 2020 and by $22 billion (or 1 percent) for the 2021–2030 period. The most significant changes among those revenue sources was a $19 billion (or 4 percent) reduction in miscellaneous fees and fines over the 2020–2030 period and a $5 billion (or 2 percent) reduction in the collections of estate and gift taxes. The reduction in estate taxes aligns CBO’s projections with recently recorded collection amounts, changes to mortality rates resulting from the coronavirus pandemic, and other changes.
Changes in Outlays
Because of technical updates—largely for mandatory spending programs—CBO increased its estimate of outlays in 2020 by $30 billion (or 1 percent) and its projections for the 2021–2030 period by $80 billion (or less than 1 percent).
Mandatory Outlays. For technical reasons, CBO increased its estimates of spending this year for some programs and decreased spending estimates for others. On net, the technical changes increased mandatory outlays for 2020 by $24 billion (or 1 percent). For the 2021–2030 period, projections of mandatory outlays increased by $126 billion (or less than 1 percent).
Supplemental Nutrition Assistance Program. CBO increased is projections of outlays for SNAP over the 2021–2030 period by $154 billion (or 24 percent)—an adjustment based on substantial projected increases in program enrollment. In 2021, nearly 50 million people are projected to participate in SNAP, about 40 percent more than the 35 million that CBO projected in March 2020. In 2030, participation is projected to be about 20 percent higher than CBO projected in March.
Unemployment Compensation. CBO increased its estimate of outlays for unemployment compensation in 2020 by $30 billion, largely because a much higher-than-expected percentage of unemployed workers are receiving benefits. For the 2021–2030 period, CBO decreased its projections of unemployment compensation benefits by $55 billion (or 12 percent). That change primarily derives from a reduction in the projected average weekly benefit, which was based on actual benefit amounts reported for 2020.
Social Security. CBO increased projected outlays for Social Security over the 2021–2030 period by $52 billion (or less than 1 percent), on net, because of partially offsetting revisions. The agency reduced its population projections, partly in response to the coronavirus pandemic, resulting in a $143 billion reduction in outlays for Old-Age and Survivors Insurance (OASI) and Disability Insurance (DI). Offsetting that reduction, however, is CBO’s expectation that more working-age people will now claim DI and that more people ages 62 to 64 will claim OASI because of the economic downturn. Over the 10-year period, those changes increased the agency’s projection of DI outlays by $91 billion and OASI outlays by $106 billion.
Premium Tax Credits and Related Spending. CBO and JCT reduced their projections of outlays for premium tax credits and related spending over the 2020–2030 period by $67 billion (or 10 percent), on net.25 The current update reflects lower projected premiums for health insurance purchased through the marketplaces established by the Affordable Care Act. The projection of premiums is, on average, 6 percent lower over the 2021–2030 period than the agencies previously projected. The decreased premiums are mostly the result of lower estimates of personal disposable income. Private insurance premiums are projected on the basis of past trends in premium growth and on the basis of projected growth in personal income, which affects people’s ability to buy health insurance.
Supplemental Security Income. CBO increased its projections of spending on Supplemental Security Income (SSI) by $46 billion (or 7 percent) over the 2021–2030 period. Under the SSI program, the federal government and the states provide monthly cash assistance to people who are disabled, blind, or elderly, and who have low income and few assets. The increase in projected spending was primarily the result of a projected increase in the number of beneficiaries receiving SSI. That larger number of beneficiaries was in turn derived from a projected increase in the unemployment rate and from the extension of the program to Puerto Rico, the latter the result of U.S. v. José Luis Vaello-Madero, decided in the U.S. Court of Appeals for the First Circuit on April 10, 2020.
Earned Income and Child Tax Credits. CBO increased projected outlays for the earned income tax credit (EITC) and the child tax credit over the 2021–2030 period by $45 billion (or 5 percent). That change was based on the larger projected number of households receiving the EITC as a result of the projected decrease in the share of wages and salaries going to low-wage earners. According to new data, low-wage earners have been disproportionately affected by the widespread economic disruption caused by the coronavirus pandemic.
Veterans’ Benefits and Services. CBO increased its projections of outlays for mandatory veterans’ benefits over the 2021–2030 period by $37 billion (or 2 percent). That change stems largely from an increase in the agency’s projections of outlays for veterans’ compensation and pensions: Recent data show that average payments for disability compensation are rising faster than previously projected and that the number of new veterans qualifying for disability compensation is greater than previously projected. Both the number of veterans with disabilities connected to their service and the average severity of their disabilities have increased at faster rates than CBO had projected. The more severe veterans’ injuries and illnesses are, the greater the disability compensation payments.
Medicare. CBO estimates that net Medicare spending will be reduced by $25 billion (or 4 percent) in 2020 and by $27 billion (or less than 1 percent) over the 2021–2030 period, primarily because of declines in the use of medical services. The agency projects that, compared with its March baseline, that development will reduce Medicare spending under Part A by about $11 billion, and under Part B by about $26 billion, for fiscal year 2020. Partially offsetting that reduction is an increase in outlays to providers under Medicare Part B in 2020, which stems from payments made in advance of expected future health care claims. Those payments will then be recouped in 2020 and 2021. Advance payments made under Part B are governed by existing regulatory authority.
Other Mandatory Programs. Smaller technical changes decreased CBO’s projections of outlays for other mandatory programs by $59 billion over the 2021–2030 period.
Discretionary Outlays. Technical updates increased CBO’s estimate of discretionary outlays in 2020 by $8 billion (or 1 percent) and reduced its projections of such outlays over the 2021–2030 period by $14 billion (or less than 1 percent). Those changes stem from adjustments made to better reflect the recent rates at which funding for various discretionary programs has been spent. (The changes discussed here do not include the significant changes to discretionary spending resulting from laws enacted to address the coronavirus pandemic, which appear in the section on legislative changes.)
Net Interest. Technical changes decreased CBO’s projections of net interest outlays for the 2021–2030 period by $32 billion (or 1 percent). That decrease stems from three main sources. First, on the basis of recent debt issuance, the agency decreased its projection of the average maturity of newly issued debt. Because shorter-term debt carries lower interest rates, that change reduced the agency’s projections of interest costs by $34 billion over the 10-year period. Second, technical changes to revenues and other outlays decreased the projected deficit for 2020 by $397 billion but increased projected deficits for the 2021–2030 period by $788 billion. The additional debt-service costs associated with those changes in projected deficits are estimated to equal $28 billion. Third, CBO increased its estimate of interest earnings from credit-financing accounts by $24 billion to acknowledge the increases in the loan balances in those accounts. Credit-financing accounts, which are not included in the federal budget, track the cash flows of the federal government’s various loan programs. (Only the net subsidy costs of loan and loan guarantee programs are recorded in the budget.) To provide loans to borrowers, the accounts often borrow from the Treasury and then pay interest back to the Treasury. Those interest earnings are classified as offsetting receipts, or negative outlays; thus, an increase in earnings is classified as a reduction in outlays.
1. See Congressional Budget Office, Baseline Budget Projections as of March 6, 2020 (March 2020), www.cbo.gov/publication/56268.
2. The baseline projections described in this report incorporate legislation enacted through August 4, 2020. The most recently enacted law with significant budgetary effects reflected in this analysis is the Great American Outdoors Act (Public Law 116-152).
3. CBO does not ordinarily update cost estimates for enacted legislation when economic and technical factors change after enactment. Doing so is often difficult, particularly when the budgetary effects of that legislation cannot be separately identified. However, in preparing its baseline projections for this report, the agency had enough new information to update its estimates for some components of legislation enacted since March. For those components, CBO has incorporated updates to the originally estimated costs.
4. The current projections are based on CBO’s latest economic forecast, which was completed on June 26 and reflects the agency’s estimates of the effects on the economy of legislation enacted before that date. For further explanation of the revisions to the agency’s economic forecast, see Congressional Budget Office, An Update to the Economic Outlook: 2020 to 2030 (July 2020), www.cbo.gov/publication/56442. The economic changes discussed in this report reflect differences between that forecast and CBO’s January 2020 forecast. For more details on that earlier forecast, see Congressional Budget Office, The Budget and Economic Outlook: 2020 to 2030 (January 2020), www.cbo.gov/publication/56020.
5. The projections do not reflect the budgetary effects of tariffs the United States reimposed on imports of aluminum from Canada beginning on August 6, nor do they account for the four administrative actions announced by the President on August 8, 2020.
6. The Coronavirus Aid, Relief, and Economic Security Act (CARES Act, P.L. 116-136) authorized the Secretary of the Treasury to provide up to $454 billion to fund emergency lending facilities established by the Board of Governors of the Federal Reserve System. However, because the income and costs stemming from that lending are expected to roughly offset each other, CBO estimates that the provision will have little effect on the deficit.
7. The effects of the Coronavirus Preparedness and Response Supplemental Appropriations Act, 2020 (P.L. 116-123) are not included here because that law was enacted on March 6, 2020, and thus its effects were incorporated into CBO’s March 2020 baseline.
8. Because of how the Treasury is recording the effects of certain provisions of new laws, CBO has adjusted some estimates to include amounts as increases in outlays that were shown in initial cost estimates as reductions in revenues and vice versa. Those shifts have no effect on the deficit.
9. Mandatory outlays consist primarily of payments for benefit programs, such as Social Security, Medicare, and Medicaid. The Congress largely determines funding for those programs by setting rules for eligibility, benefit formulas, and other parameters rather than by appropriating specific amounts each year.
10. Discretionary outlays result from the funding controlled by appropriation acts in which policymakers specify how much money can be obligated for certain government programs in specific years. Because of the unusual size and nature of that funding, CBO, after consulting with the House and Senate Committees on the Budget, did not extrapolate the funding in its projections. Laws governing how CBO constructs its baseline projections would otherwise have required the agency to include that amount of funding, adjusted for inflation, in each year of the projection period.
11. Borrowers that received a PPP loan before June 5, 2020, have the option to choose an 8-week forgiveness period rather than a 24-week forgiveness period. All PPP loans borrowed on or after June 5, 2020, include only the 24-week forgiveness period.
12. See Congressional Budget Office, cost estimate for H.R. 748, the CARES Act, P.L. 116-136 (April 16, 2020, revised April 27, 2020), www.cbo.gov/publication/56334, and cost estimate for H.R. 266, the Paycheck Protection Program and Health Care Enhancement Act (April 22, 2020), www.cbo.gov/publication/56338.
13. See Congressional Budget Office, cost estimate for H.R. 748, the CARES Act, P.L. 116-136 (April 16, 2020, revised April 27, 2020), www.cbo.gov/publication/56334.
14. JCT initially projected that recovery rebates would increase the deficit by $269 billion in 2020 and by $23 billion in 2021, nearly all of which the Treasury has classified as outlays; see Joint Committee on Taxation, Estimated Revenue Effects of the Revenue Provisions Contained in an Amendment in the Nature of a Substitute to H.R. 748, the “Coronavirus Aid, Relief, and Economic Security (‘CARES’) Act,” as Passed by the Senate on March 25, 2020, and Scheduled for Consideration by the House of Representatives on March 27, 2020, JCX-11R-20 (April 23, 2020), https://go.usa.gov/xvQuv.
15. The law specifies that the FMAP increase is to remain in effect until the last day of the quarter in which the coronavirus public health emergency ends. The coronavirus public health emergency is currently in effect, as was most recently determined on July 25, 2020. See the Families First Coronavirus Response Act, P.L. 116-127, 134 Stat. 178, enacted on March 18, 2020; and Department of Health and Human Services, “Renewal of Determination That A Public Health Emergency Exists” (July 23, 2020), https://go.usa.gov/xG3ag.
16. The law specifies that the continuous coverage provision is to remain in effect until the end of the month in which the coronavirus public health emergency ends. See the Families First Coronavirus Response Act, P.L. 116-127, 134 Stat. 178, enacted on March 18, 2020.
17. See Congressional Budget Office, cost estimate for H.R. 6201, the Families First Coronavirus Response Act (April 2, 2020), www.cbo.gov/publication/56316.
18. See Congressional Budget Office, “Direct Spending Effects of the Senate Amendment to H.R. 1957, the Great American Outdoors Act” (July 16, 2020), www.cbo.gov/publication/56477.
19. See Joint Committee on Taxation, Estimated Revenue Effects of the Revenue Provisions Contained in Division G of H.R. 6201, the “Families First Coronavirus Response Act,” JCX-9-20 (March 16, 2020), https://go.usa.gov/xvaWT, and Estimated Revenue Effects of the Revenue Provisions Contained in an Amendment in the Nature of a Substitute to H.R. 748, the “Coronavirus Aid, Relief, and Economic Security (‘CARES’) Act,” as Passed by the Senate on March 25, 2020, and Scheduled for Consideration by the House of Representatives on March 27, 2020, JCX-11R-20 (April 23, 2020), https://go.usa.gov/xvQuv.
20. In CBO’s initial estimate of the payroll tax credits related to paid leave and employee retention, a portion of the deficit effect was shown as an increase in outlays. Because the Treasury is recording those credits almost entirely as a reduction in revenues, CBO has adjusted its projections accordingly. That shift from an increase in outlays to a reduction in revenues has no effect on the deficit.
21. For further explanation of the revisions to the agency’s economic forecast, see Congressional Budget Office, An Update to the Economic Outlook: 2020 to 2030 (July 2020), www.cbo.gov/publication/56442.
22. See Centers for Medicare & Medicaid Services, “Market Basket Research and Information” (accessed August 20, 2020), https://go.usa.gov/xG3aQ.
23. In its projections, CBO did not extrapolate the new funding that was designated as an emergency requirement, as noted in the section on legislative changes.
24. The United States agreed to reduce the List 4A tariffs on approximately $120 billion of Chinese products from 15 percent to 7.5 percent, effective February 14, 2020. In addition, the Administration announced on March 16, 2020, that it would exclude imports of certain medical products from the Section 301 duties.
25. The related spending consists almost entirely of outlays for risk adjustment and the Basic Health Program.
About This Document
This volume is one of a series of reports on the state of the budget and the economy that the Congressional Budget Office issues each year. It satisfies the requirement of section 202(e) of the Congressional Budget Act of 1974 for CBO to submit to the Committees on the Budget periodic reports about fiscal policy and to provide baseline projections of the federal budget. In keeping with CBO’s mandate to provide objective, impartial analysis, this report makes no recommendations.
The following pages list the CBO staff members who contributed to this report by preparing the revenue and spending projections; writing the report; reviewing, editing, fact-checking, and publishing it; compiling the supplemental materials posted along with it on CBO’s website (www.cbo.gov/publication/56517); and providing other support.
CBO continually seeks feedback to make its work as useful as possible. Please send any comments to communications@cbo.gov.

Phillip L. Swagel
Director
September 2020
Revenue Projections
The revenue projections were prepared by the Tax Analysis Division, supervised by John McClelland, Joseph Rosenberg, Joshua Shakin, and Edward Harris. In addition, the staff of the Joint Committee on Taxation provided valuable assistance.
Kathleen Burke—Individual income taxes, wage distribution
Paul Burnham—Retirement income
Dorian Carloni—Business taxation
Madeleine Fox—Customs duties
Nathaniel Frentz—Federal Reserve System earnings, miscellaneous fees and fines
Bilal Habib—Tax modeling
Bayard Meiser—Excise taxes
Shannon Mok—Tax modeling
Kevin Perese—Tax modeling
Molly Saunders-Scott—International taxation, business taxation
Kurt Seibert—Payroll taxes, depreciation, tax modeling
Jennifer Shand—Corporate income taxes
Naveen Singhal—Capital gains realizations, tax modeling
Ellen Steele —Refundable tax credits
James Williamson—Estate and gift taxes
Spending Projections
The spending projections were prepared by the Budget Analysis Division, with contributions from analysts in other divisions. That work was supervised by Theresa Gullo, Leo Lex, Sam Papenfuss, Christina Hawley Anthony, Megan Carroll, Kim Cawley (formerly of CBO), Chad Chirico, Sheila Dacey, Paul Masi, Sarah Masi, David Newman, and Susan Willie of the Budget Analysis Division, as well as by Julie Topoleski, Chapin White, and Alexandra Minicozzi of the Health, Retirement, and Long-Term Analysis Division and Sebastien Gay of the Financial Analysis Division.
Defense, International Affairs, and Veterans’ Affairs
Kent Christensen (formerly of CBO)—Defense (projections, working capital funds, operation and maintenance, procurement, scorekeeping)
Sunita D’Monte—International affairs
Ann Futrell—Veterans’ health care and employment training services, international food assistance
Raymond Hall—Defense (research and development, stockpile sales, atomic energy, Navy procurement, military construction, and family housing)
Paul Holland—Veterans’ education benefits, reservists’ education benefits
William Ma—Defense (operation and maintenance, procurement, compensation for radiation exposure and energy employees’ occupational illness, other defense programs)
Aldo Prosperi—Military construction, military family housing, Cybersecurity and Infrastructure Security Agency, other defense programs
David Rafferty—Military retirement
Dawn Sauter Regan—Defense (military personnel)
Matt Schmit—Military health care
Logan Smith—Veterans’ compensation and pensions, other benefits for disabled veterans
Alice Burns—Medicaid, Public Health Service, private health insurance coverage
Julia Christensen—Food and Drug Administration, prescription drugs
Katherine Feinerman—Health insurance coverage
Ryan Greenfield—Prescription drugs, National Institutes of Health, Food and Drug Administration
Stuart Hammond—Medicare, Federal Employees Health Benefits program
Caroline Hanson—Health insurance coverage
Zhuang Hao—Health insurance coverage
Keren Hendel (formerly of CBO)—Health insurance coverage
Ben Hopkins—Health insurance coverage
Lori Housman—Medicare
Geena Kim—Medicaid, health insurance coverage
Jamease Kowalczyk (formerly of CBO)—Medicare
Sean Lyons—Health insurance coverage
Rachel Matthews—Medicare, other programs
Kevin McNellis (formerly of CBO)—Health insurance marketplaces, private health insurance
Eamon Molloy—Health insurance coverage
Hudson Osgood—Medicare
Romain Parsad—Health insurance coverage
Allison Percy—Health insurance coverage
Lisa Ramirez-Branum—Medicaid, other programs
Lara Robillard—Medicare
Asha Saavoss—Medicare
Sarah Sajewski—Medicare, Public Health Service
Robert Stewart—Medicaid, Children’s Health Insurance Program, Indian Health Service
Carolyn Ugolino—Health insurance marketplaces, private health insurance
Emily Vreeland—Health insurance marketplaces, private health insurance
Ellen Werble—Prescription drugs, Public Health Service
Katherine Young—Prescription drugs, Public Health Service
Chris Zogby—Health insurance coverage
Susan Yeh Beyer—Child nutrition and other nutrition programs
Meredith Decker—Unemployment insurance, training programs, Administration on Aging, Smithsonian Institution, arts and humanities
Elizabeth Cove Delisle—Housing assistance
Jennifer Gray—Supplemental Nutrition Assistance Program and other nutrition programs, Social Services Block Grant, support programs for children and families
Justin Humphrey—Student loans, higher education
Arin Kerstein—Child Care and Development Block Grant, refugee assistance
Wendy Kiska—Pension Benefit Guaranty Corporation
Leah Koestner—Elementary and secondary education, Pell grants
Justin Latus—Supplemental Security Income
Susanne Mehlman—Temporary Assistance for Needy Families, Child Support Enforcement program, foster care, child care programs, Low Income Home Energy Assistance Program
Noah Meyerson—Old-Age and Survivors Insurance, Social Security trust funds, Pension Benefit Guaranty Corporation
Emily Stern—Disability Insurance
Natural and Physical Resources
Tiffany Arthur—Agriculture
Michael Falkenheim—Federal Deposit Insurance Corporation
Madeleine Fox—General government
Kathleen Gramp—Energy, Outer Continental Shelf receipts, spectrum auction receipts, Orderly Liquidation Fund
Sofia Guo—Workplace and mine safety
David Hughes—Recreational resources, Commerce, Small Business Administration, Universal Service Fund
Wendy Kiska—Federal Deposit Insurance Corporation
Aaron Krupkin—Aviation and water transportation, energy
Erik O’Donoghue—Agriculture
Jeffrey Perry—Fannie Mae and Freddie Mac, Federal Housing Administration
Matthew Pickford—General government, legislative branch
Stephen Rabent—Federal Deposit Insurance Corporation, Postal Service, credit unions, pollution control and abatement
Robert Reese—Other natural resources, highways, mass transit, Amtrak, Federal Housing Administration
Mitchell Remy—Fannie Mae and Freddie Mac, Federal Housing Administration
Janani Shankaran—Science and space exploration, conservation and land management
Jon Sperl—Judicial branch, community and regional development, Federal Emergency Management Agency, Bureau of Indian Affairs
Aurora Swanson—Water resources, Fannie Mae and Freddie Mac
Lindsay Wylie—Law enforcement, justice assistance, homeland security
Shane Beaulieu—Computer support
Barry Blom—General budget projections
Joanna Capps—Appropriation bills (Labor, Health and Human Services, and Education; Legislative Branch)
Aaron Feinstein—Other interest, monthly Treasury data, historical data
Avi Lerner—Interest on the public debt, automatic budget enforcement and sequestration, Troubled Asset Relief Program
Amber Marcellino—Federal civilian retirement
George McArdle—Appropriation bills (Military Construction and Veterans Affairs; State and Foreign Operations)
Dan Ready—Various federal retirement programs, national income and product accounts, federal pay
Justin Riordan—Appropriation bills (Commerce, Justice, and Science; Financial Services and General Government)
Mark Sanford—Appropriation bills (Agriculture and Food and Drug Administration; Defense)
Esther Steinbock—Appropriation bills (Energy and Water Development; Transportation and Housing and Urban Development)
J’nell Blanco Suchy—Appropriation bills (Interior and Environment; Homeland Security), authorization bills
Patrice Watson—Application and data systems manager
Writing
Barry Blom prepared the visual summary. Barry Blom and Amber Marcellino wrote the main text, with assistance from Avi Lerner and Joshua Shakin. Aaron Feinstein wrote the appendix, with assistance from Nathaniel Frentz and Jennifer Shand.
Reviewing, Editing, Fact-Checking, and Publishing
Mark Doms, Mark Hadley, Jeffrey Kling, and Robert Sunshine reviewed the report. The editing and publishing were handled by CBO’s editing and publishing group, supervised by Benjamin Plotinsky, and the agency’s communications team, supervised by Deborah Kilroe.
The editors were Scott Craver and Rebecca Lanning, and the graphics editor was Jorge Salazar. Annette Kalicki and Simone Thomas published the report on CBO’s website.
Rachel Austin, Fiona Forrester, Paul Holland, Arin Kerstein, Bayard Meiser, Tess Prendergast, Aldo Prosperi, Dan Ready, and Justin Riordan fact-checked the report. Dan Ready coordinated the preparation of figures for the budget projections. Bayard Meiser and Dan Ready compiled data and supplemental information. Benjamin Plotinsky and Simone Thomas coordinated the presentation of those materials.
Corrections
The Congressional Budget Office has corrected this report since its original publication. Both the PDF and online versions were corrected, but for ease of reference, this list indicates the locations of the corrections in the PDF.
The following changes were made on October 8, 2020:
Page 28, Figure A-1, notes: “three laws” was changed to “three major laws.”
Page 29, right-hand column, second full paragraph: “three laws” was changed to “three major laws.”
Page 32, Figure A-2, notes, and Page 34, Table A-2, notes: “shows the effects of the three laws” was changed to “includes the effects of the three major laws.”
Page 36, right-hand column, fifth line: “matching assistance” was changed to “medical assistance.”
Page 39, Figure A-3, panel titled “Unemployment Rate”: “Trillions of Dollars” was changed to “Percent.”