This morning I briefed the press about The Budget and Economic Outlook: 2019 to 2029, which the Congressional Budget Office published today. I delivered the following remarks about that report. Also presented here are some answers to questions that I expected to receive.
Remarks About the Report
Today I’d like to draw your attention to important information in our report about the amount of debt that the federal government will incur if we continue on the current budgetary path. I’m going to focus on four questions.
What Does CBO Project?
Federal debt is already large, and budget deficits over the next decade and beyond are projected to keep pushing it up in relation to the size of the economy. Eventually, debt as a share of economic output would reach its highest level in our nation’s history. Let me highlight a few key numbers:
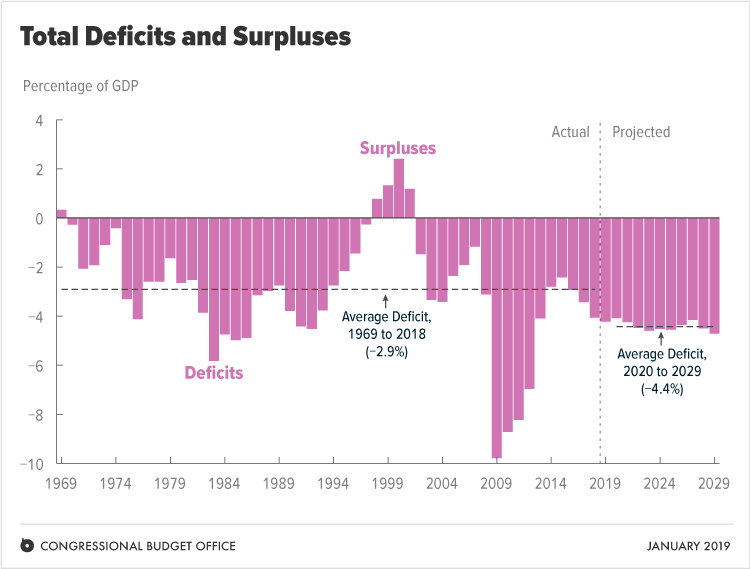
- At the end of 2018, the amount of debt held by the public was equal to 78 percent of gross domestic product (GDP).
- In CBO’s projections, debt equals 93 percent of GDP by 2029 and about 150 percent of GDP by 2049.
- Even at its highest point ever, just after World War II, debt was far less than that: 106 percent of GDP.
Why Does Debt Become So Large in CBO’s Projections?
You can see the answer in the summary of the report. This year we’ve summarized our findings in a new way, using the charts in the report to illustrate some key messages. The figure on the bottom of the first page indicates why debt grows: Federal spending and revenues both grow through 2029, yet the gap between them persists.
On the spending side, growth is driven by benefits for older people and by interest costs.
- Outlays for Social Security and Medicare increase significantly in CBO’s baseline projections. As members of the baby-boom generation age, the number of people at least 65 years old—who are the main beneficiaries of that spending—is expected to grow by about one-third, and their health care costs will continue to rise.
- Interest costs are also projected to rise, primarily because of increases in federal borrowing and higher interest rates.
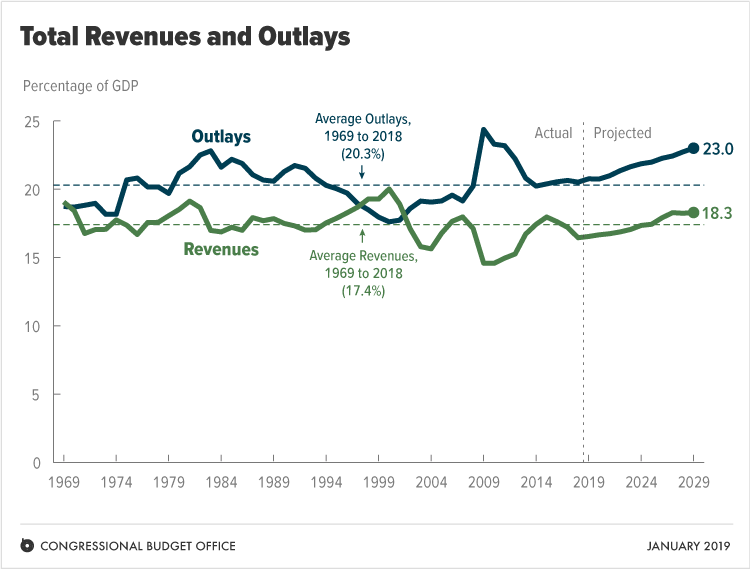
As for revenues, they too are projected to increase through 2029, partly because of the scheduled expiration of some tax cuts at the end of 2025. However, that growth in revenues is not enough to keep deficits from being significantly larger than they have been over the past 50 years.
In CBO’s projections, the average deficit over the next 10 years equals 4.4 percent of GDP. That average deficit is not only large but also unusual for times of low unemployment—in contrast to times of high unemployment, when the government sometimes implements policies aiming to stabilize the economy, causing deficits to be larger.
What Would Happen If the Economy Grew More Quickly?
If GDP grew more quickly than it does in CBO’s projections, revenues would increase more than spending would, and deficits would be smaller than projected. If economic growth was fast enough, deficits could actually shrink, and debt could stabilize or even fall as a percentage of GDP rather than continuing to grow.
But such an outcome is unlikely. In 2018, the real growth rate of the economy—that is, growth with the effects of inflation removed—was 3.1 percent, the highest rate since 2005. Nevertheless, the deficit equaled 3.8 percent of GDP, and debt increased as a percentage of GDP.
Furthermore, this year the boost that recent tax legislation gave to business investment wanes in CBO’s projections. Also, federal purchases drop sharply under current law, starting in the fourth quarter of the year. As a result, economic growth is projected to slow in 2019. Over the longer term, output growth is projected to be lower than its long-term historical average because the working-age population is expected to grow more slowly than it did in the past. Real GDP grows by an average of 1.8 percent per year in CBO’s 10-year projections. In short, the economy isn’t likely to grow quickly enough to shrink the budget deficit.
We have posted an interactive workbook on our website that lets you specify different economic scenarios and see the results. For example, if productivity growth turned out to be half a percentage point higher in every year than CBO projects, real GDP would grow by 2.4 percent per year over the coming decade instead of by 1.8 percent. Deficits would average 3.7 percent of GDP instead of 4.4 percent. And debt would stabilize at roughly 80 percent of GDP by 2029. Such economic growth is possible, but it is not likely under current law, in CBO’s assessment.
CBO aims for its projections to be in the middle of potential outcomes. So there is about the same chance that productivity growth could turn out to be half a percentage point lower than CBO projects. If that happened, real GDP growth would average 1.1 percent over the next decade, average deficits would be 5.2 percent of GDP, and debt would swell even more than it does in CBO’s projections.
What Are the Consequences of High and Rising Debt?
If debt rose to the amounts that CBO projects, there would be troubling consequences.
- First, as interest rates continued to rise toward levels more typical than today’s, federal spending on interest payments would increase—surpassing the entire amount of defense spending by 2025 in CBO’s baseline projections, for example.
- Second, because federal borrowing reduces national saving over time, the nation’s capital stock ultimately would be smaller, and productivity and total wages would be lower, than would be the case if debt was smaller.
- Third, lawmakers would have less flexibility than otherwise to use tax and spending policies to respond to unexpected challenges.
- Fourth, the likelihood of a fiscal crisis in the United States would increase.
In closing, I will emphasize that debt is on an unsustainable course in CBO’s projections. To put it on a sustainable one, lawmakers will have to make significant changes to tax and spending policies—making revenues larger than they would be under current law, making spending for large benefit programs smaller than it would be under current law, or adopting some combination of those approaches. I’m happy to answer your questions.
What Are the Effects of the Partial Government Shutdown?
CBO has estimated the effects of the five-week partial shutdown of the government that started on December 22, 2018, and ended on January 25, 2019. CBO’s findings include the following:
CBO estimates that the five-week shutdown delayed approximately $18 billion in federal discretionary spending for compensation and purchases of goods and services and suspended some federal services.
- As a result of reduced economic activity, CBO estimates, real GDP in the fourth quarter of 2018 was reduced by $3 billion (in 2019 dollars) in relation to what it would have been otherwise. (Such references are in calendar years or quarters.) In the first quarter of 2019, the level of real GDP is estimated to be $8 billion lower than it would have been—an effect reflecting both the five-week partial shutdown and the resumption in economic activity once funding resumed.
- As a share of quarterly real GDP, the level of real GDP in the fourth quarter of 2018 was reduced by 0.1 percent, CBO estimates. And the level of real GDP in the first quarter of 2019 is expected to be reduced by 0.2 percent. (The effect on the annualized quarterly growth rate in those quarters will be larger.)
- In subsequent quarters, GDP will be temporarily higher than it would have been in the absence of a shutdown. Although most of the real GDP lost during the fourth quarter of 2018 and the first quarter of 2019 will eventually be recovered, CBO estimates that about $3 billion will not be. That amount equals 0.02 percent of projected annual GDP in 2019. In other words, the level of GDP for the full calendar year is expected to be 0.02 percent smaller than it would have been otherwise.
- Underlying those effects on the overall economy are much more significant effects on individual businesses and workers. Among those who experienced the largest and most direct negative effects are federal workers who faced delayed compensation and private-sector entities that lost business. Some of those private-sector entities will never recoup that lost income.
- All of the estimated effects and their timing are subject to considerable uncertainty. In particular, CBO is uncertain about how much discretionary spending was affected by the partial shutdown, how affected federal employees and contractors adjusted their spending in response to delayed compensation, and how agencies will adjust their spending on goods and services now that funding has resumed.
In CBO’s estimation, the shutdown dampened economic activity mainly because of the loss of furloughed federal workers’ contribution to GDP, the delay in federal spending on goods and services, and the reduction in aggregate demand (which thereby dampened private-sector activity).
CBO’s estimates do not incorporate other, more indirect negative effects of the shutdown, which are more difficult to quantify but were probably becoming more significant as it continued. For example, some businesses could not obtain federal permits and certifications, and others faced reduced access to loans provided by the federal government. Such factors were probably beginning to lead firms to postpone investment and hiring decisions. In addition, risks to the economy were becoming increasingly significant as the shutdown continued. Although their precise effects on economic output are uncertain, the negative effects of such factors would have become increasingly important if the partial shutdown had extended beyond five weeks.
What Are the Effects of Recent Changes in Trade Policy?
In 2018, the United States imposed new tariffs on 12 percent of imported goods. Some of those tariffs were on goods and commodities, such as solar panels and steel, imported from most countries, and others were only on various products imported from China. The new tariffs range from 10 percent to 30 percent of the imports’ assessed customs values. In response, U.S. trading partners imposed tariffs on 9 percent of all goods exported by the United States.
CBO’s baseline projections incorporate the assumption that all newly implemented changes to trade policy, both domestic and foreign, are permanent and that scheduled changes to trade policy do not take effect. The Administration possesses broad authority to adjust tariff policy without legislative action, but CBO did not attempt to predict those adjustments.
On net, CBO estimates that the new tariffs on both imports and exports will reduce U.S. real GDP by about 0.1 percent, on average, through 2029. The changes in trade policy also increase uncertainty among investors, which may further reduce U.S. output. CBO’s estimates of the economic effects of the new tariffs are subject to considerable uncertainty, particularly over the longer run.
In addition to their broad effects on the economy, the new tariffs are projected to boost customs duties. Such duties have equaled 0.2 percent of GDP in recent years, amounting to $41 billion in 2018. In CBO’s baseline projections, they increase to 0.3 percent of GDP in 2019 and remain between 0.3 percent and 0.4 percent of GDP through the next decade. (For additional details, see Box 2-1 in today’s report.)
How Does CBO Make Projections of Immigration and Its Effects?
Underlying CBO’s baseline projections are estimates of many demographic factors, including immigration. CBO estimates the annual net flows of three kinds of immigrants: legal permanent residents, legal temporary residents, and foreign-born individuals without legal status. The agency’s estimates are informed by analyses of recent trends and current immigration policy. CBO’s baseline projections incorporate the following estimates:
- Annual net flows of legal permanent residents grow at an average rate of about 0.4 percent per year over the next 10 years, averaging approximately 860,000 per year.
- Annual net flows of legal temporary residents remain steady at approximately 80,000 per year over the next decade.
- Annual net flows of foreign-born individuals without legal status increase over the next five years, from zero in 2019 (meaning that immigration is offset by emigration) to about 170,000 in 2024. After that, annual net flows remain about the same through 2029.
All told, in CBO’s projections, net immigration to the United States—a measure that accounts for all people who either enter or leave the country in any year—grows by an average of 2.0 percent per year over the next decade.
In estimating the budgetary effects of proposed legislation related to immigration, CBO and the staff of the Joint Committee on Taxation start with the baseline projections and then examine many aspects of the legislation, including the immigration status of affected people, where they currently live, and factors related to their employment and their use of federal benefits. Such factors include the ways in which the legislation would change people’s eligibility for federal benefits and ability to work, which are defined in current law. They also include the ways in which the legislation would affect people’s behavior.
Keith Hall is CBO’s Director.