Last Monday, the Congressional Budget Office released The Budget and Economic Outlook: 2018 to 2028, the latest installment of an annual report explaining the agency’s budget and economic projections. This week, CBO is publishing daily blog posts to share key excerpts from the report, and today’s post is about the agency’s projections of federal spending.
Under current law, federal outlays in 2018 will total $4.1 trillion, CBO estimates—$160 billion, or 4 percent, more than the amount spent in 2017. Spending is projected to grow at an average annual rate of 5.5 percent over the coming decade, reaching $7.0 trillion in 2028. Social Security, Medicare, and net interest account for more than two-thirds of that increase.
Projected Spending in 2018 Differs From Spending in the Past
Federal outlays in 2018 will equal 20.6 percent of gross domestic product (GDP), CBO estimates, down slightly from 20.8 percent last year but above the 50-year average of 20.3 percent. That increase over the historical average is largely attributable to significant growth in mandatory spending (net of the offsetting receipts that are credited against such spending), which is expected to equal 12.7 percent of GDP in 2018, compared with its 9.8 percent average over the 1968–2017 period. As a share of GDP, the other major components of federal spending will fall below their 50-year averages: Discretionary spending is anticipated to equal 6.4 percent of GDP this year, compared with its 8.5 percent average over the past 50 years, and net outlays for interest are expected to equal 1.6 percent of GDP, compared with the 50-year average of 2.0 percent.
About half of the projected growth in outlays in 2018 is attributable to discretionary spending, which is projected to rise by $80 billion, or 7 percent, from $1.2 trillion last year to nearly $1.3 trillion this year. The government’s net interest costs are also anticipated to grow in 2018, increasing by $53 billion, or 20 percent, to $316 billion. CBO estimates that mandatory spending will remain close to last year’s amount—$2.5 trillion—rising by $27 billion, or 1 percent.
Shifts in the Timing of Payments Will Affect Spending
Spending for 2018 would be about $44 billion higher if not for a shift in the timing of certain payments because the first day of fiscal year 2018—October 1, 2017—was a Sunday. When the first day of a month falls on a weekend, certain monthly payments (mostly for mandatory benefit programs such as Medicare, Supplemental Security Income, and certain programs for veterans) normally made on that day are shifted to the preceding month; when that date is October 1, the shift moves payments to the preceding fiscal year. Accordingly, for those benefit programs, only 11 months of payments will be made in fiscal year 2018 rather than the usual 12.
Without that shift in the timing of payments, outlays this year would be 5 percent greater than in 2017 and measure 20.8 percent of GDP, CBO estimates—a slight uptick from the 20.7 percent of GDP they would have measured last year if a similar shift in the timing of payments was excluded. Additional timing shifts will occur later in the projection period: CBO estimates that $62 billion in outlays will shift from 2023 into 2022, $67 billion will shift from 2024 into 2023, and $89 billion will shift from 2029 into 2028.
Spending Is Projected to Rise Significantly Relative to GDP
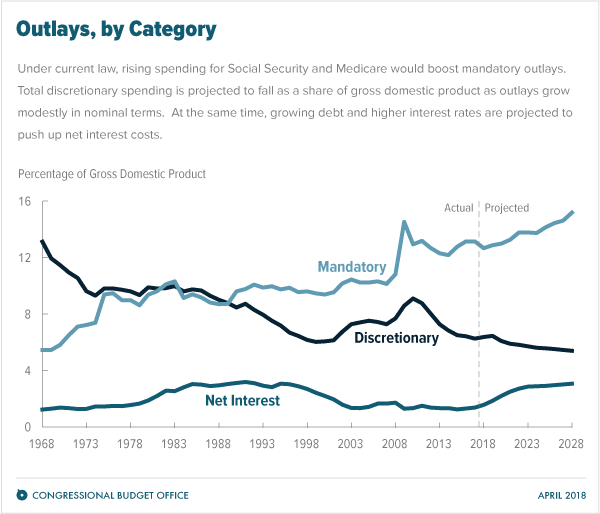
In CBO’s baseline projections, outlays continue to rise in relation to the size of the economy over the coming decade, reaching 23.3 percent of GDP in 2028 (adjusted to exclude the effects of timing shifts), an increase of 2.5 percentage points from the adjusted estimate for 2018. Relative to GDP, mandatory spending and net interest costs are projected to rise significantly, whereas discretionary spending is projected to decline. Specifically:
- Mandatory spending is projected to increase by 2 percentage points (from 12.9 percent of GDP to 14.9 percent), primarily because the aging of the population and rising health care costs per beneficiary will increase spending for Social Security, Medicare, and other programs.
- As interest rates return to historically higher levels and federal debt continues to mount, net outlays for interest are projected to jump significantly, increasing by 1.5 percentage points and nearly doubling as a share of the economy (from 1.6 percent of GDP to 3.1 percent) by 2028.
- Discretionary spending is projected to fall by 1.0 percentage point as a share of GDP—from 6.4 percent to 5.4 percent. That decline reflects lower statutory limits on discretionary funding in 2020 and 2021 and the assumption (required by law) that discretionary funding will grow at the rate of inflation—which is slower than projected growth in GDP—beginning in 2022. Those projected decreases follow significant increases in discretionary funding provided for 2018 in the Consolidated Appropriations Act, 2018 (Public Law 115-141), and permitted for 2019 by the Bipartisan Budget Act of 2018 (P.L. 115-123).
Among mandatory programs, outlays for Social Security and for major health care programs are projected to rise relative to GDP; spending for all other mandatory programs is projected to decline relative to GDP. In particular (adjusted to exclude the effects of timing shifts):
- Outlays for the largest federal program, Social Security, are expected to rise from 4.9 percent of GDP in 2018 to 6.0 percent in 2028.
- Federal outlays for the major health care programs—Medicare, Medicaid, subsidies offered through the health insurance marketplaces established under the Affordable Care Act and related spending, and the Children’s Health Insurance Program—are projected to grow from 5.3 percent of GDP in 2018 to 6.6 percent in 2028, mostly because of growth in Medicare spending.
- Outlays for all other mandatory programs (net of offsetting receipts) are projected to decline from 2.7 percent of GDP in 2018 to 2.4 percent in 2028.
Amber Marcellino is an analyst in CBO’s Budget Analysis Division. Megan Carroll, Avi Lerner, and Dan Ready assisted with this work, with guidance from Christina Hawley Anthony, Theresa Gullo, Leo Lex, and Sam Papenfuss.