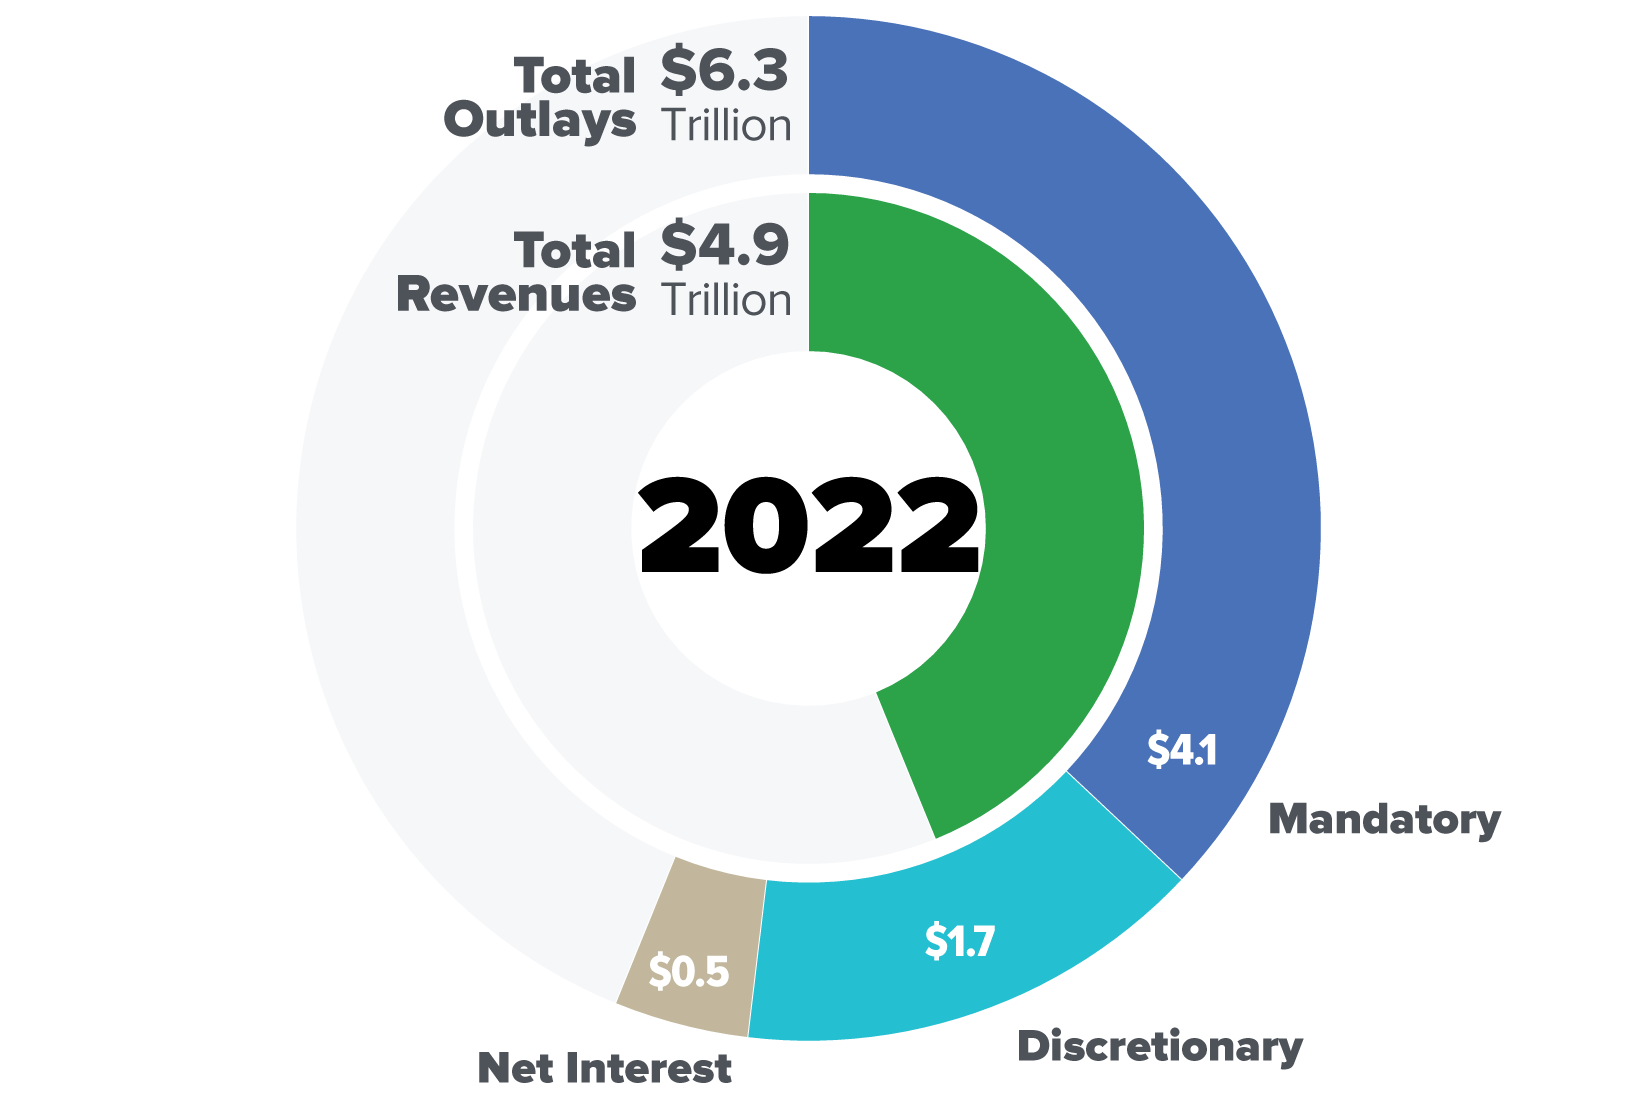
View CBO’s budget infographics to see how much the federal government spent and took in during fiscal year 2022, as well as broader trends in the budget over the past few decades.
CBO Blog
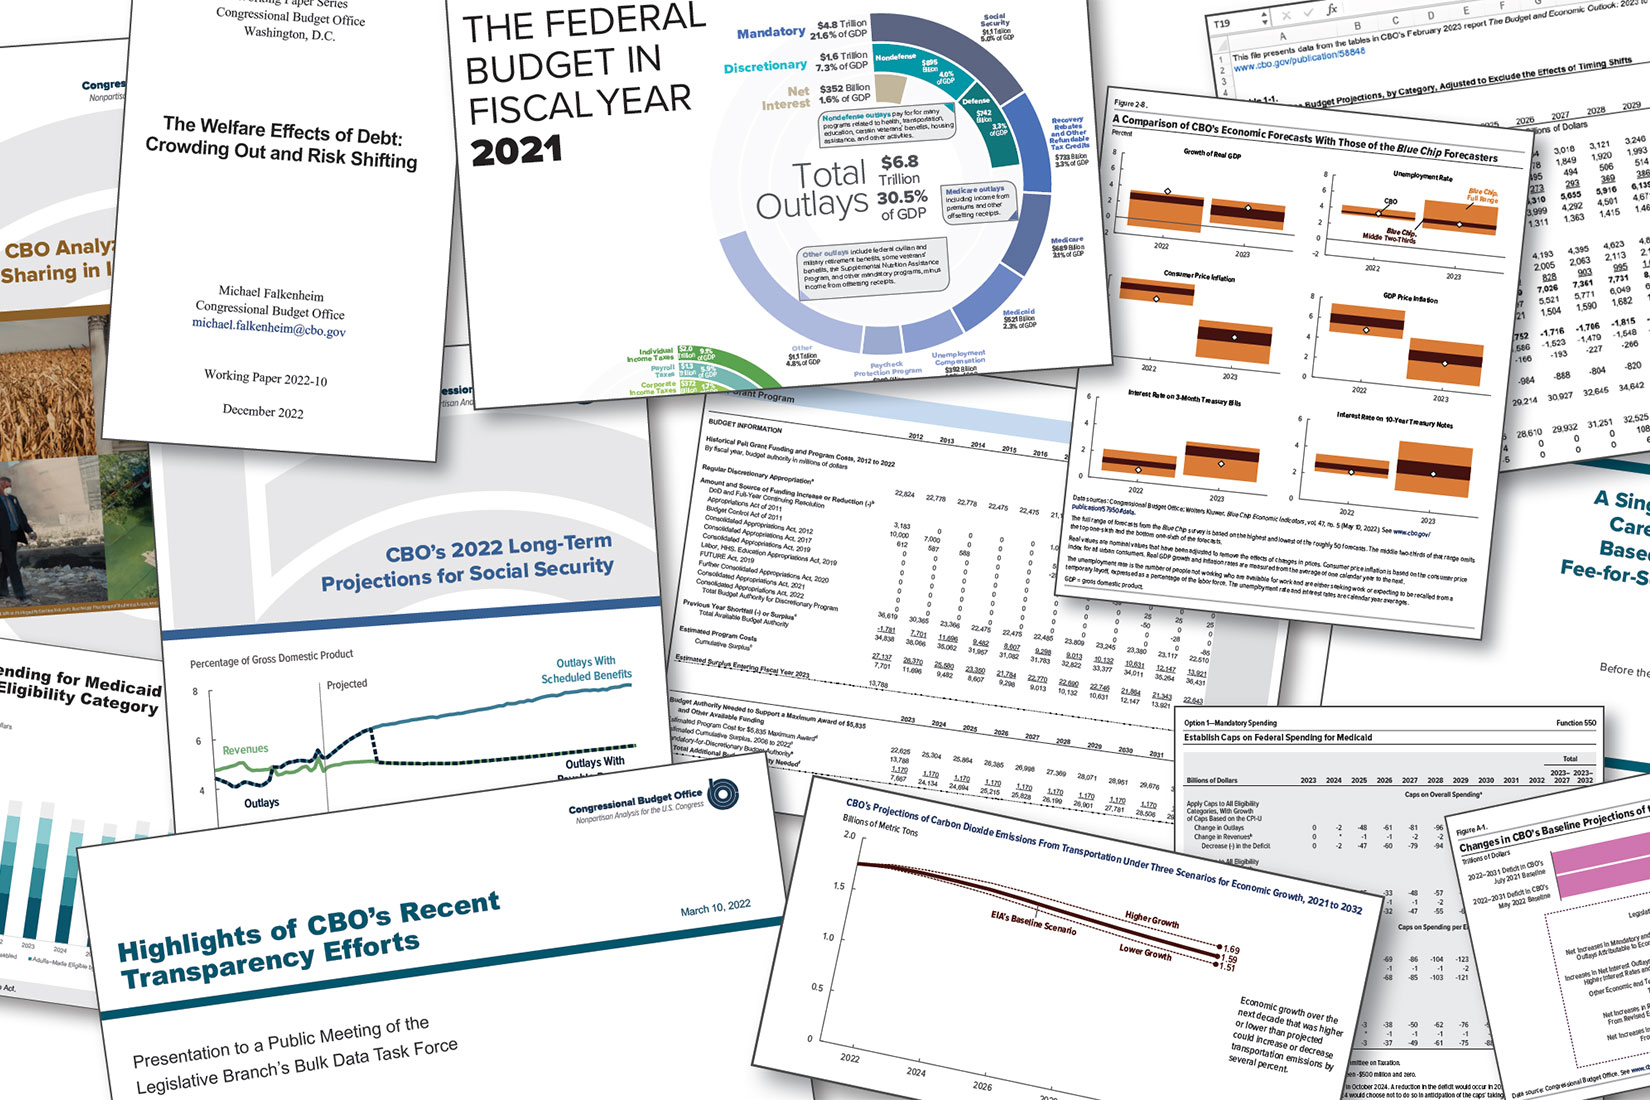
CBO's transparency efforts are intended to promote a thorough understanding of its work, help people gauge how estimates might change if policies or circumstances differed, and enhance the credibility of its analyses and processes.

CBO describes the commitments the federal government has made through its credit and insurance programs, including housing, real estate, and student loan programs, deposit insurance, insurance for private pensions, and flood and crop insurance.
CBO estimates that the effects on mandatory spending and revenues of laws enacted in 2022 will add about $810 billion to deficits from 2022 to 2032—the net result of a $900 billion increase in outlays and a $90 billion increase in revenues.

The federal budget deficit was $724 billion in the first five months of fiscal year 2023, CBO estimates—$248 billion more than the shortfall recorded during the same period last year.

CBO’s Director, Phillip Swagel, uses the agency’s latest report on budget options to illustrate ways to reduce the deficit.
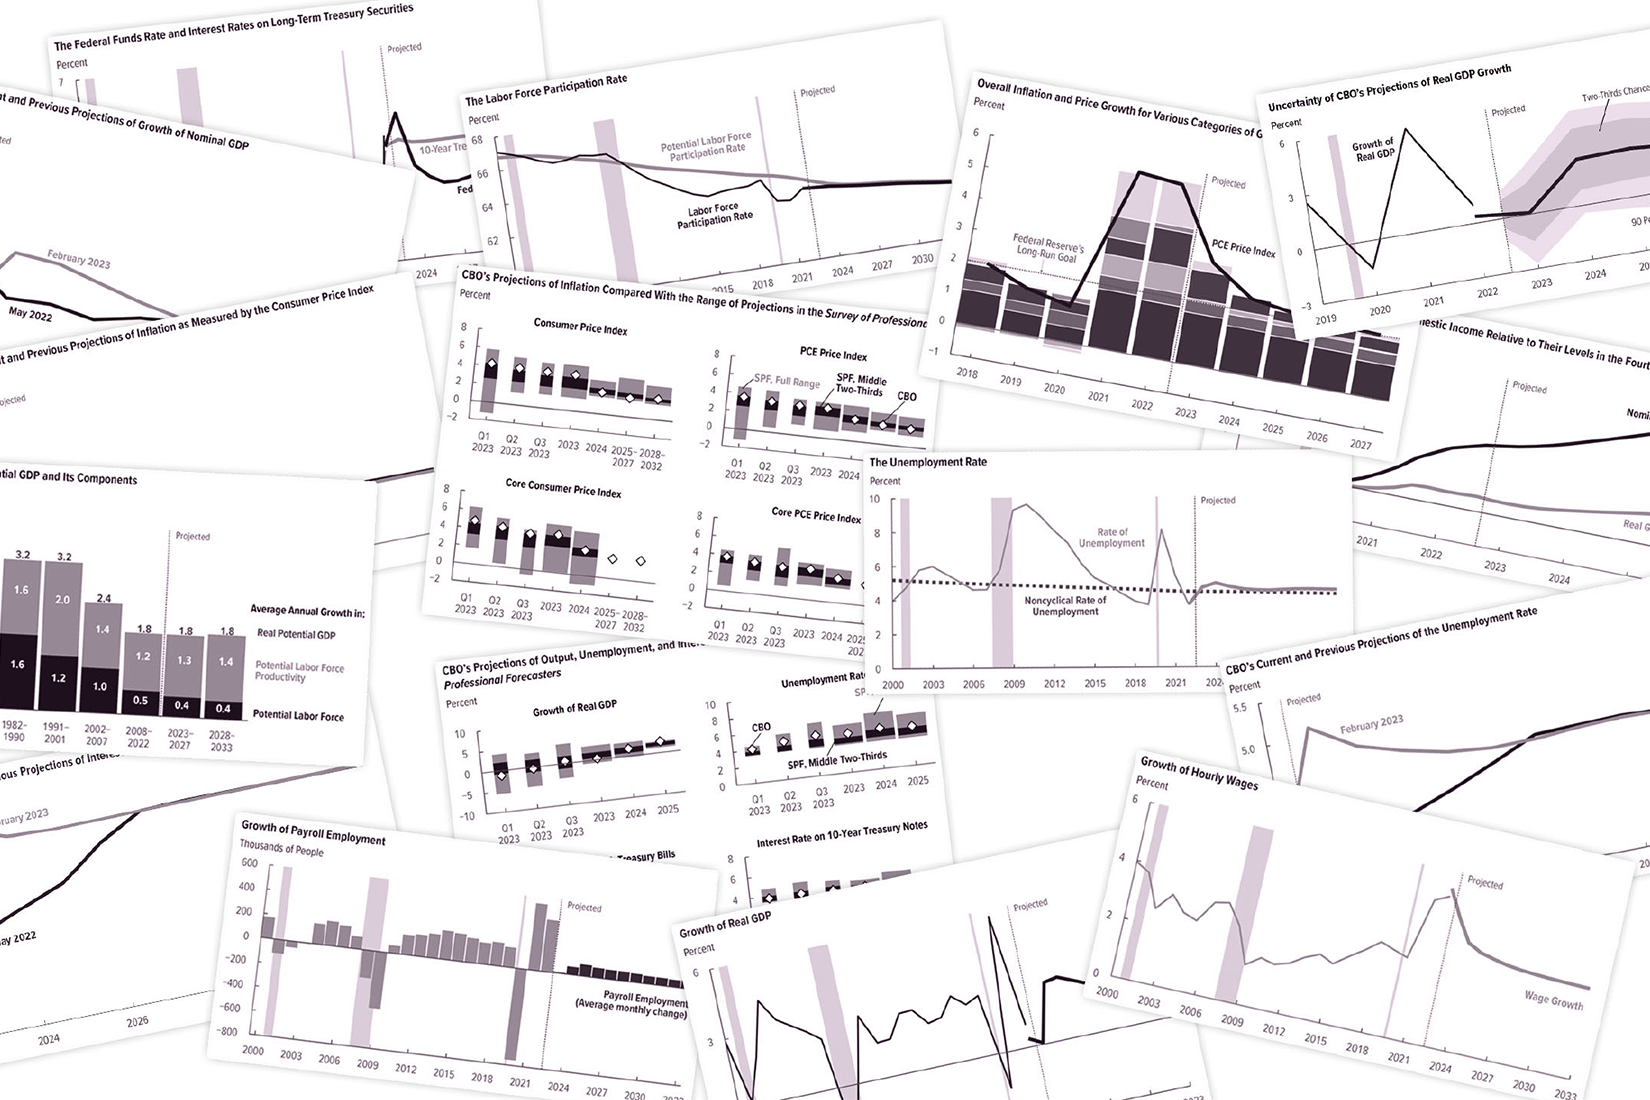
CBO summarizes in graphic form its projections of what the economy would look like this year and over the next decade if current laws governing federal taxes and spending generally remained in place.

For fiscal year 2024, CBO is requesting an appropriation of $70.8 million, up from the $63.2 million that it received for 2023. The request reflects strong interest in CBO’s work from Congressional leadership, committees, and Members.
-
CBO Director Phillip Swagel discusses the current budget and economic outlook.
In CBO’s projections, the federal deficit totals $1.4 trillion in 2023 and averages $2.0 trillion per year from 2024 to 2033. Real GDP growth comes to a halt in 2023 and then rebounds, averaging 2.4 percent from 2024 to 2027.